Multi-lane traffic: lane change control in theory and practice - Victor L. Knoop 6 February 2023
←
→
Page content transcription
If your browser does not render page correctly, please read the page content below
Multi-lane traffic:
lane change control in theory and
practice
Victor L. Knoop
6 February 2023

                                    1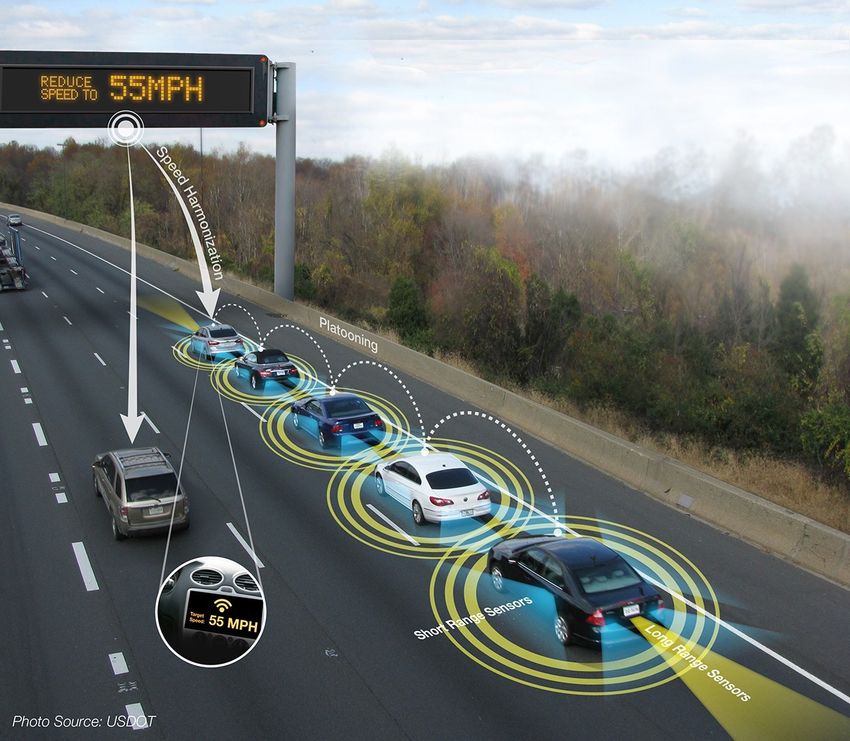
Scope and relevance
●
    Cost of traffic jams:
    several billion euros/yr
    (10⁹)
●
    Cause: traffic demand exceeds
    capacity
●
    Measures to improve
    road capacity and
    road use
●
    How will they work?

                                    2
Single lane traffic
●
     The capacity directly
     relates to the distance between two
     vehicles
●
     Much already known
     Multi-lane traffic:
●
     Inefficiency in lane usage (not all lanes
     are fully used)
●
     Traffic jams due to
     merging/ lane changing
●
     Many unknowns
●
     In practice, most relevant
                                                 3
Multi-lane traffic
●
    Inefficient: at busy conditions, many choose the left lane
●
    How do lane change decisions work?

    You are at the right lane, driving at your desired speed. You approach the white car, and the black car
    passes you at higher speed. What will you do?

                                                                                                              4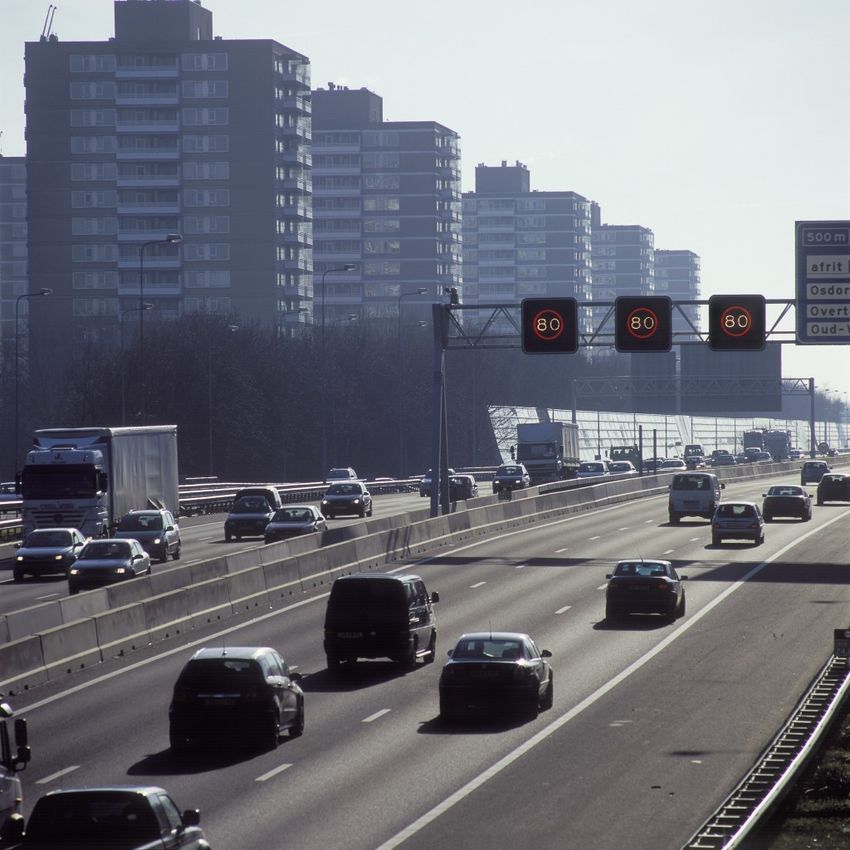
Multi-lane traffic
●
    Choice of lane

    You are at the right lane, driving at your desired speed. You approach the white car, and the black car
    passes you at higher speed. What will you do?

    A. I remain in this lane and will adapt my speed
    B. I change lanes and will keep my current speed
    C. I change lanes and will (temporarily) increase my speed to overtake
        the white car
    D. I change lanes and increase my speed and will keep following
        the black car                                                                                         5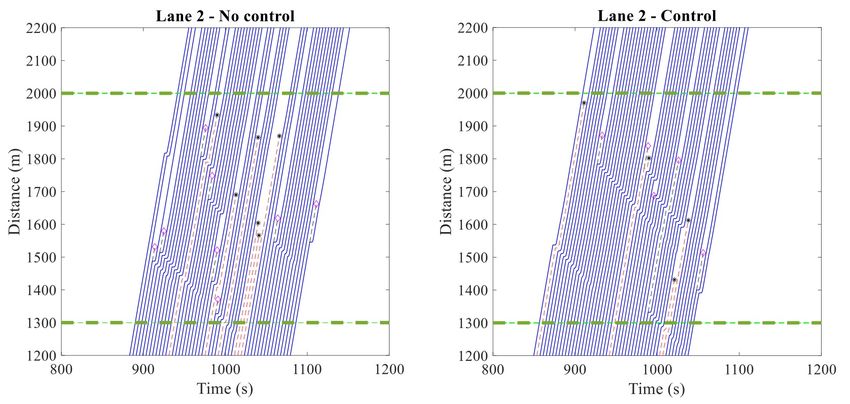
6

 Dynamic traffic control
Traditional traffic management strategies
Scientific innovations

                         7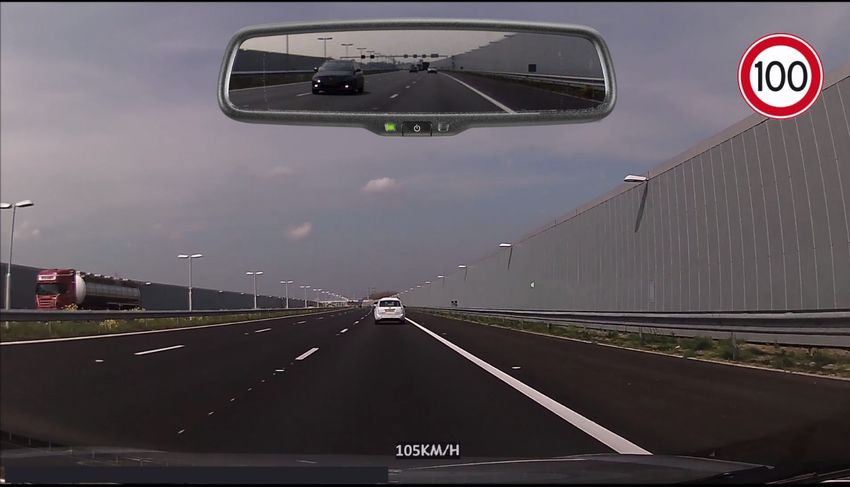
8

    Research question
What benefit can connected and automated vehicles
bring near an off-ramp or weaving section?

     Keep lane

           Keep lan
                   e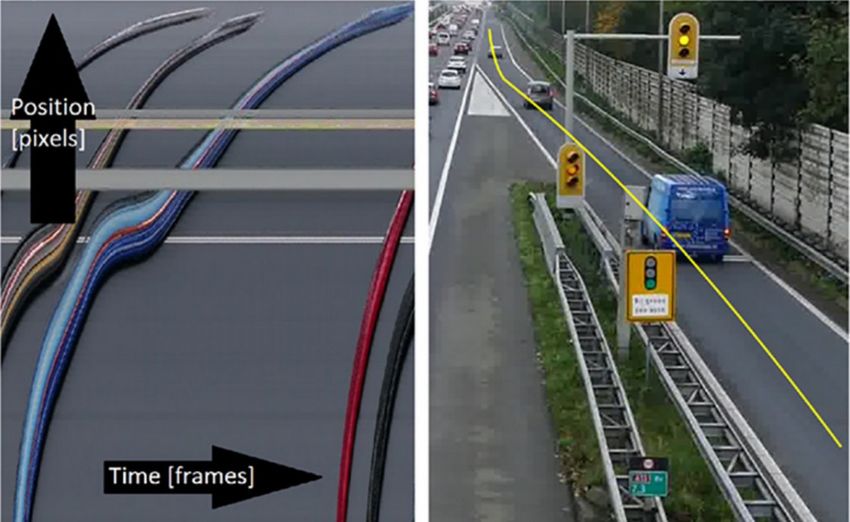
9

    Various potential strategies
●
    Under diversions
        1: Assign all vehicles to lanes based on their destination
        with respect to the exit [DS1].
        2: Assign all exiting vehicles to right lane, as well as some
        some through vehicles (due to capacity constraints) [DS2].
        3: Assign some exit vehicles to the right lane (due to
        capacity contraints), and all through vehicles to left lanes.
        [DS3].
●
    Under weaving: as above +
    –   4: Assign some exiting vehicles to a left lane to pass
        congestion due to merging vehicles.
10

              Contribution
●
    Analytical description of traffic processes and
    effect of control strategies
●
    Insight into strategies to choose under various
    loads and penetration rate of influencable
    vehicles (via analytical description)
●
    Accounting for spatial spread of lane changes
    (and the voids they create)
●
    Quantification of effect of strategies for various
    loads (via simulation)
11
Motivation
●
Lane changes cause reduction of throughput at
bottlenecks.
●
Consider the spatial distribution of LCs and the
effect of reutilization of voids.
●
Utilize CAVs to strategically influence LCs at
bottlenecks.
●
Consider the effect of compensation by human
driven vehicles (HDVs) in a mixed traffic.12
Voids: Laval and Daganzo
●
Lane changes from lower
speed to higher speed lane
●
Acceleration bounded, leaving
a void in the faster lane
●
This reduces capacity
●
Empirically verified
1Laval, J. A., & Daganzo, C. F. (2006). Lane-changing in traffic streams. Transportation Research Part B:
Methodological, 40(3), 251-264; Picture: Leclercq, L., Knoop, V.L., Marczak, F., and Hoogendoorn, S.P. (2016) Capacity
drops at merges: New analytical investigations, Transportation Research Part C: Emerging Technologies, Volume 62,
January 2016, Pages 171-18113
Potential of CAVs
●
Connected and Automated Vehicles (CAVs)
can be directed towards a specific lane
●
CAVs are 100% compliant
●
Fraction of CAVs can vary (“penetration rate”)
●
Human drivers (HDV) are not directly
influenced
●
Compensation of HDVs due to choice of CAV14
3 zones
●
1: CAV LCs
●
2: HDV compensation zone
●
3: ‘Capacity Impact’ (CI) zone: void-creating LCs and
remaining voids here create irreversible traffic voids.15
Methods
1)Analytical assessment
to find which strategies
work best
2) Microscopic simulation
to quantify their impact
under a wide range of
conditions
Picture: Dong et al, 202016 Results
17

            Diverges: analytical result
            1,2

             1

            0,8                                    All main traffic left
Exit rate

                                                   (and some exit traffic too)
            0,6

            0,4       Complete split
            0,2
                                                                   All exit traffic right
             0                                                     (and some main traffic too)
                  0   0,1   0,2     0,3      0,4     0,5     0,6    0,7     0,8      0,9  1
                                          CAV penetration rate

                                  Lower bound          Upper bound
18
Weaving: analytical result
● Capacity Impact zone in weaving sections
is divided into two parts –
• area upstream of the on-ramp (CIZ-1).
• area between the two ramps plus the
area extending downstream of the
off-ramp (CIZ- 2).
1) Low ramp inflow: organize flow approaching weave section to minimize conflicts
between through and exit traffic (similar to diverge sections). Reduces the
space available in the shoulder lane for the incoming ramp demand [WS1].
2) High ramp inflow: make space in the shoulder lane by moving vehicles to the
inner lanes to accommodate the on-ramp demand and shift the LCs of exit
CAVs downstream of the on-ramp in the weaving segment [WS2].19 Numerical simulations
20

           Simulation setup
●
    Aim: quantify the improvements in throughput
    as a result of implementing these strategies.
●
    Microscopic simulation, based on Chen and
    Ahn (2018)
    –   Longitudinal model: Newell’s car-following model.
    –   LC mechanism: Laval and Daganzo (2006)
●
    Speed reduction instanteneous
21
Simulation setup
●
Three lane motorway with single lane off-ramp
or auxiliary lane (in cases of weaving sections).
●
Different free speeds per lane
●
LC location and times homogeneously spread
over zone
●
LC considered always possible22
Results diverges
●Maximize flow between 1300-2000 m
●Less lane changes with control
●Less voids with control23
Results diverges
●No control reduces
maximum outflow: 1.7%
to 8.3% lower compared
to “no void” case.
●Maximum throughput can
be achieved with control;
minimum penetration
rate depends on exit
flows.
●Compensation has larger
effect for high exit flows.24
Results weaving sections
● WS1: organize exiting traffic.
● WS2 - through CAVs to the
left to make room for
merging traffic
● Improvements in the order
of several percents
● Traffic flow improves with
higher penetration rates
● WS2 works indeed better
with high merge and low
diverge
● In other cases WS1 better
than WS225
Limitations
●
Many simplifications in approach:
– initial distribution of traffic over the lanes
– speeds set exogeneously
– instanteneous LC and speed reduction
– all vehicles are equal
– LC independent on available gap; no
anticipation & relaxation
●
Tested under constant conditions: how about
changing conditions?
●
Big leap to practical application26
Findings (theoretical part)
●
Lane-assignment strategies can significantly
increase flows near diverge or weaving
bottlenecks
●
Analytical expression for best strategy and lane
assignment to choose;
For weaving: two conflicting strategies (exiting
traffic left or right) to choose depending on
traffic loads
●
If the area to perform the LCs is long enough,
these LC will not reduce throughputPractical
implementaions
27Current situation – video
●
28Current situation
●
A4 freeway: delays at diverge
●
Alternative route is not used at capacity
29Current situation
●
A4 freeway: delays at diverge
●
Alternative route is not used at capacity
●
Advise people to take the alternative route, via Flitsmeister
(15% penetration rate)
●
20-25% will follow advice (we know after the experiment)
●
Advice given to 20% of travellers
●
Increase in travel on parallel road reduces demand to main lane
Just operating at capacity – travel time gains.
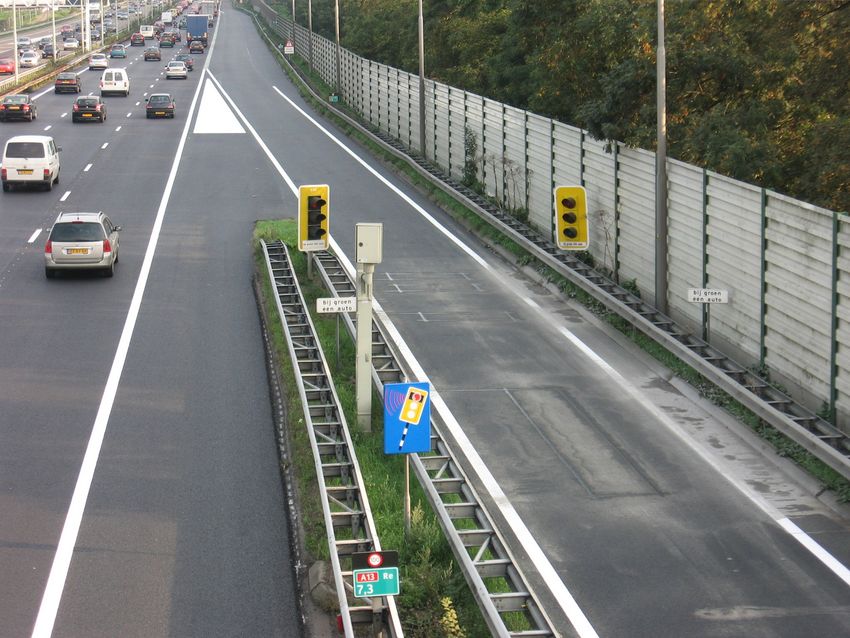
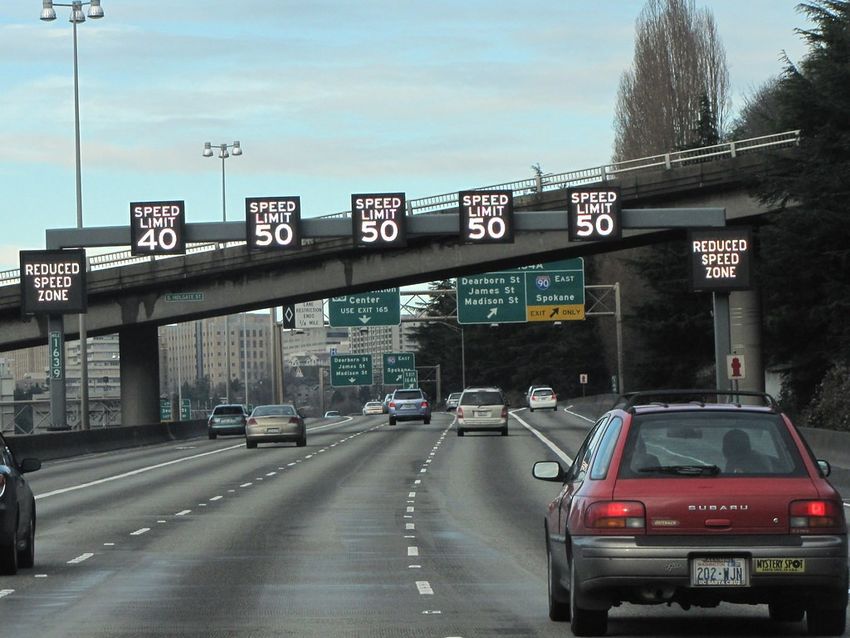
30Ramp metering
●
Limit the inflow onto the freeway
to reduce overall delays
31Relevant measure: flow (veh/h)
●
Consider the area of potential congestion a box
●
Delays are determined by the moment flowing into the box and
flowing out of the box
●
Inflows are fixed, so outflow determines the delay
●
Delays are determined by the headway, ie. the time between two
vehicles
32Effect of ramp metering
●
Somehow, drivers keep a larger distance when exiting the queue then
before (even though they have been waiting on their predecessor)e
●
Ramp metering prevents a queue on the main road, and thus keeps
up the high outflow
●
If the outflow would be the same as with onramp metering, the delays
would have been equal
33Outflow depends on the speed in congestion
●
We relate the outflow out of a queue to the speed in the queue
●
Data: A4 motorway
34Improve ramp metering
●
Current ramp metering involves limiting flows per minute
●
Can we give green to a vehicle to direct him to
a specific gap?
●
Possible with coordination and communcation between vehicles
●
How to do with current equipment?
35Improve ramp metering
●
Measure gaps with loop detectors upstream
●
Give green to the waiting vehicle at the right time
●
Test using traffic simulation
●
Crux: right prediction of acceleration
(simulation program too favorable)
36Measure acceleration
●
Video of road from a overpass near Delft Noord
●
Pixels vs time
●
Calibrate with a known vehicle passing at constant speed
37Method works
●
Implemented at a simulation with realistic behavior
●
Method works in reducing delay
38Overall conclusions
●
Traffic jams occur at multi-lane
roads and not all capacity is
being used
●
Conceptual and theoretical work
shows an increase in capacity
of several percents by
appropriate lane changes if well
executed
●
Field test shows that people do
follow lane (road?) advise
●
Traffic scientists can actually
reduce congestion :)
39References
●
Stefan Klomp (2020) Ramp metering: a microscopic control approach
●
Klomp, S.R., Knoop, V.L., Taale, H., Hoogendoorn, S.P., (2021) Transportation Research Records. Ramp Metering With Microscopic Gap
Detection: Algorithm Design And Empirical Acceleration Verification Matching data can be found here
●
Knoop, V.L., Keyvan-Ekbatani, M., De Baat, M.J., Taale, H, and Hoogendoorn, S.P. (2018) Lane-Change Behavior on Freeways: an On-Line
Survey Using Video Clips. In Journal of Advanced Transportation, vol. 2018, article ID: 9236028, https://doi.org/10.1155/2018/9236028.
●
Nagalur Subraveti, H.H.S., Knoop, V.L. and Van Arem, B. (2020) Improving Traffic Flow Efficiency at Motorway Lane Drops by Influencing
Lateral Flows. Transportation Research Records, Volume 2674 issue 11, pp. 367-378
40You can also read