Munters Q2 report 2021 Klas Forsström, President and CEO Annette Kumlien, GVP and CFO

Page created by Phyllis Miles
 
CONTINUE READING
Munters Q2 report 2021 Klas Forsström, President and CEO Annette Kumlien, GVP and CFO
Munters
Q2 report 2021
Klas Forsström, President and CEO
Annette Kumlien, GVP and CFO
Munters Q2 report 2021 Klas Forsström, President and CEO Annette Kumlien, GVP and CFO
Agenda

    Highlights Q2 2021

    Implementation of strategy

    Q2 2021 financial highlights

    Summary

2
Munters Q2 report 2021 Klas Forsström, President and CEO Annette Kumlien, GVP and CFO
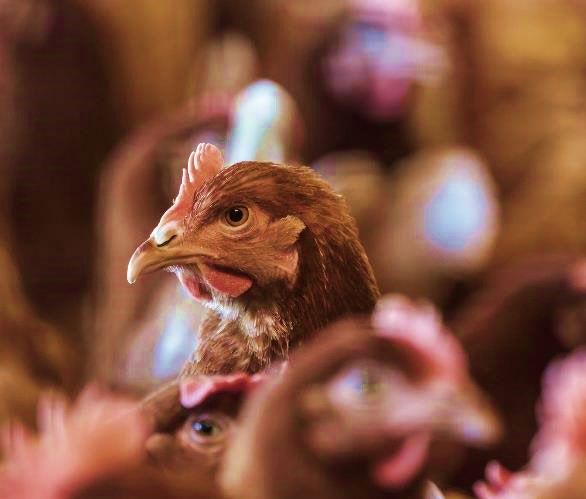
Solid underlying demand in the second quarter
                           Good demand and stable net sales                            Constraints in supply chain            Strategy implementation
 Order intake                     Net sales                Adj. EBITA
 MSEK                             MSEK                     MSEK
             +13%                             +3%                        -1%
 2500                             2000                      300
 2000                                                       250
                                  1500
                                                            200
 1500
         1,870   2,118            1000    1,773   1,822     150    260         259
 1000
                                                            100
  500                             500
                                                             50
     0                              0                         0
         Q2 2020 Q2 2021                 Q2 2020 Q2 2021          Q2 2020 Q2 2021

• Order intake increased FX-adj. by +23% (+1)                                        • Constraints in supply chain        • Execution of our long-term
  - Increase driven by the battery sub-segment in Industrial segment in                increased throughout the quarter     strategy continued
  AirTech; swine segment in the US for FoodTech and growth in                          leading to longer lead times and   Examples of actions taken:
  Services                                                                             sourcing related production
                                                                                                                          • IP acquisition to strengthen
• Net sales increased FX-adj. by +13% (-6)                                             disturbances
                                                                                                                            technology position in core
  - AirTech strong increase in the battery sub-segment in APAC and                   • Costs increased for raw material     business of AirTech
  Americas; good development in the US for FoodTech                                    and freights; majority effect of
                                                                                                                          • FoodTech strategy launched in
• Adj. EBITA at MSEK 259 (260), EBITA-margin of 14.2% (14.7)                           consecutive price increases in
                                                                                                                            the quarter aiming at accelerating
  - Constraints in supply chain, increased costs and changed product                   2022 due to extended lead times
                                                                                                                            the digital journey and strengthen
  mix negative impact on margin                                                      • Constraints in supply chain          the equipment position
                                                                                       expected to remain in 2021
 3
Munters Q2 report 2021 Klas Forsström, President and CEO Annette Kumlien, GVP and CFO
Raw material and supply chain headwind
                                                                           (USD/MT)                     Iron ore price development since 2016
    • Sharp increase in freight costs and raw material and
                                                                          250
      component prices in 2021
     ‒ Example: Price increases of about 100% for freight shipping
       from Europe-Asia and Europe-North America                          200

    • Largest raw material exposures for Munters:
     ‒ Steel, Copper, Zinc/Magnesium, Aluminum                            150

    • Constraints in supply chain led to longer lead times and
      sourcing related production disturbances                            100

                                                                           50
               Consecutive price increases 2021;
    effect over coming quarters with majority next year due
                    to extended lead times                                  0
                                                                          2016-01-04         2017-01-04        2018-01-04       2019-01-04         2020-01-04   2021-01-04

                                                                                                               China Iron Ore       Australia Iron Ore
                                                                     Source: Kairos Commodity Indices

4
Munters Q2 report 2021 Klas Forsström, President and CEO Annette Kumlien, GVP and CFO
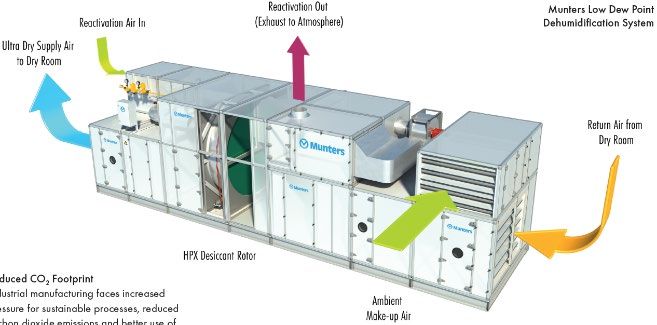
Order intake Q2 – Growth in the US
    Americas                                                                     Regional split                Americas   EMEA     APAC
      • AirTech - growth driven by primarily battery sub-segment in Industrial
        segment, offsetting negative effect from exit of non-core Commercial     Share of total order intake       40%       36%      24%
        segment. Services showed good growth                                     Y/Y change in %*                  17%       10%      12%
      • FoodTech – good growth in broiler, swine, layer and dairy segments
                                                                                 Y/Y FX-adj. change in %           35%       15%      20%

    EMEA
      • AirTech – good development driven by the battery sub-segment
      • FoodTech – growth driven by orders for controllers to the US broiler
        segment
    Asia
      • AirTech – strong growth in APAC driven by the battery sub-segment in
        Industrial segment and Services. Component business grew, partly
        offset by a weak development of Mist Elimination
      • FoodTech – decline in APAC on the back of very strong growth in the
        swine segment in China last year

5    *As reported, not currency adjusted.
Munters Q2 report 2021 Klas Forsström, President and CEO Annette Kumlien, GVP and CFO
Market trends – AirTech
 Customer segment                        % Order intake Current               Market comments
 Customer segment                           H1 2021     trend
                                                           Trends             Market comments
 Industrial                                     48%                           Battery segment good growth; other segments solid development
                                                                              Continued rapid growth driven by APAC, increasing activities across EMEA and Americas
     …whereof Battery                           20%
                                                                              Growth will come in waves as battery producers step up to meet demand

     …whereof Food processing                    7%                           Good underlying market – however weaker during pandemic

     …whereof Other                             21%                           Solid underlying industrial markets with recent boost in Pharma during pandemic

 Data Centers                                   13%                           Continued increasing demand in Hyperscalers and Co-Location operators

 Components*                                    12%                           Main end markets Data Centers and Battery producers strong demand

 Mist Elimination                                6%                           Power segment and Marine relatively weak, positive trajectory in Process

 Commercial                                      4%                           Solid replenishment market for Supermarkets

 Services                                       17%                           Growth of installed base and increasing interest in energy upgrades, etc
* Dehumidification rotors and humidification pads sold through OEM channels

 6
Munters Q2 report 2021 Klas Forsström, President and CEO Annette Kumlien, GVP and CFO
Booming battery industry drives order intake in AirTech
    • Currently, electrification is continuing at a high speed
                                                                     Order Intake, Industrial segment in business area AirTech
    • High expansion of battery factories in need of cooling and
      dehumidification solutions
      – primarily in Asia, but also in Europe and Americas
    • Munters total order backlog has continuously increased
      during the last four quarters, driven by AirTech
    • Battery segment, similar to Data Centers, receives orders
      for larger solutions with longer lead times than the rest of
      Munters operations

      Strong order backlog in Munters driven by AirTech
                and the sub-segment Battery                               H2 2019           H1 2020         H2 2020   H1 2021
                                                                          Rest Industrial       Batteries

7
Munters Q2 report 2021 Klas Forsström, President and CEO Annette Kumlien, GVP and CFO
Dry, cold air needed for lithium battery production
    • Lithium battery production requires strictly controlled
      ultra-low humidity to ensure process consistency,
      storage capacity and maximize quality
    Munters Low Dew Point Dehumidifiers provides:
    • Maximizes operational flexibility through performance
      24/7, during all seasons, all production modes, and
      varying numbers of personnel
    • Precise control of humidity and temperature ensures
      high quality, repeatable products
    • Consistent low dew point improves cycle life, product
      yield and storage capacity in batteries

      Munters product design can save significantly on energy requirements

8
Munters Q2 report 2021 Klas Forsström, President and CEO Annette Kumlien, GVP and CFO
Service major opportunity in battery sub-segment
    • Munters products are installed in most production lines of
      top battery manufacturers in China
    • Evolving opportunities of daily maintenance and after-sale
      service

    • New retrofit PlugFan introduced, achieving reduction of
      operating costs
    • Power consumption in test installation was reduced and
      pay-back of new installation only 2.1 years

            Power consumption reduced by appr. 30%

9
Munters Q2 report 2021 Klas Forsström, President and CEO Annette Kumlien, GVP and CFO
Market trends – FoodTech
                   % Order intake
Customer segment     H1 2021        Trends   Market comments

Broiler               ~45%                   US market showing signs of turning

Swine                 ~30%                   Lower growth in China, stronger sentiment in US

Layer                 ~15%                    Higher global steel prices lower cage-free driven growth

Greenhouse             ~5%                   Growth driven by increased demand

Dairy
Agenda

 Highlights Q2 2021

 Implementation of strategy

 Q2 2021 financial highlights

 Summary

11
Strategic priorities – second quarter 2021

     Strategic priorities:
                                                Focus areas                                             Q2 achievement

                                                                                     Consecutive price increases in 2021, more efficient pricing
            Customers         Improve go-to-market models and pricing strategies
                                                                                           because of improved go-to-market models

                               Focus investments in R&D and product portfolio        Acquisition of IP to strengthen core-business in AirTech,
            Innovation
                                         alignment and adjustment                            product portfolio alignment well on track
                                                                                       Expansion of Services into two new markets, growth in
                                 Growing in prioritized markets and strengthen
              Markets                                                               prioritized areas e.g. Batteries and Services, new FoodTech
                                                     Services
                                                                                                  organization for Connected Farms
                             Continuous improvements, lean activities in complete    Progress of implementation long-term strategic measures
         Excellence in
                               value chain, manufacturing footprint and working           for increased efficiency in AirTech and FoodTech,
       everything we do
                                                   capital                                         continued solid cash generation
                             Leadership and competence development in line with             Change management training on-going,
               People
                                             strategic priorities                         Management Sustainability training launched

12
Delivery on our long-term strategy
 AirTech: Growth in priorities markets & strengthened technology             FoodTech: Taking the next steps

• Acquisition of IP to strengthen technology position in core-business US   • Digital solutions: accelerating growth in IoT and SaaS solutions by
                                                                              leveraging current strong market position
• Expansion of Services business through entry into Norway and Ireland
                                                                            • Climate solutions: focus on increasing valuebased selling,
• Mist Elimination to become Clean Technologies; increase focus on
                                                                              strengthening market position for equipment by continued innovation,
  renewables in both energy generation and fuels
                                                                              product rationalizations and efficiency improvements
• Secured frame agreement with larger data center hyper scaler,
                                                                            • Implementation started in Q2 2021; new organizational structure and
  resulting in increased recurring revenues to this segment
                                                                              Head of Connected Farms appointed
• Decision on delaying some strategy implementation measures into
  2022/23
Climate change major driving force for Munters
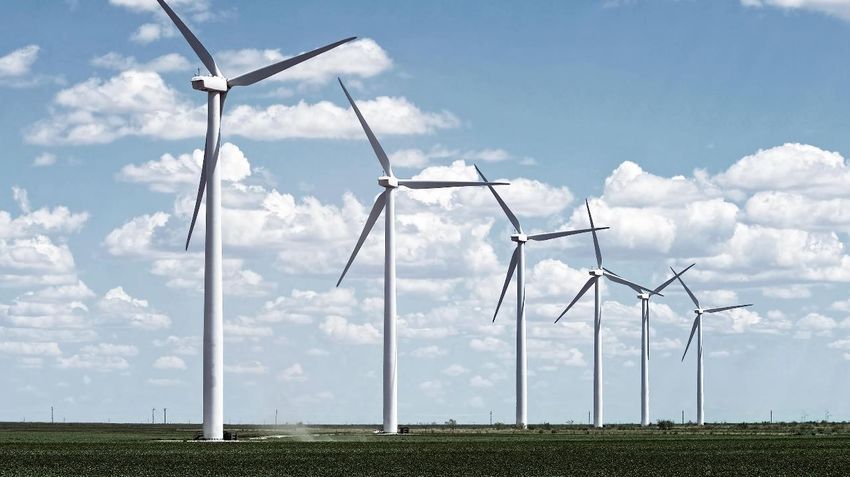
     Progress during second quarter 2021                                                    Munters Lansing now 100% renewable power sources
                                                                                             FoodTech’s production facility in the US (Lansing) is now 100%
                                                                                             powered by renewable sources using the GreenWise Power program
                                                                                             with for example wind and solar power sources
              Quality                 Environment                 Governance

                                                                                                        Munters
             Decision taken                Target set:                    Strategy:
            implementation              We strive for net            Solid governance
            ISO certification         zero emissions from               established
          9001:2015 (quality);         our operations by             Sustainability KPIs
              14001:2015                     2030.                 integrated in strategy
             (environment);                                             framework.
          45001:2018 (safety)
                                         We will reduce
           for all production          Green House Gas
                   sites                                                Sustainability
                                       emissions from our              training for top
                                          operations.*                   managers.

*Scope 1 and Scope 2 according to the Green House Gas (GHG) protocol
14
Agenda

 Highlights Q2 2021

 Implementation of strategy

 Q2 2021 financial highlights

 Summary

15
Q2 and YTD 2021 vs. Mid-term targets and YTD 2020
                                        Mid-term    Q2      Q2     YTD     YTD
     1                                   targets   2020    2021    2020    2021

           Net sales growth
             Org. growth p.a. over a      5%       -6%     13%     -6%     13%
                 business cycle

     2
           Adjusted EBITA-
                                         14%       14.7%   14.2%   11.7%   13.3%
               margin

     3
           Capital structure
                (LTM*)                   1.5x-
                                                    n.a.    n.a.   2.7x    1.9x
           (Leverage: Net debt / adj.    2.5x
                   EBITDA)
         *LTM = Last Twelve Months

16
1           Net sales growth

 Group: Strong order intake and net sales
            Q2 Order intake                       Q2 Net sales                       YTD Order intake and Net sales                     YTD Order backlog
     MSEK                                MSEK                                         MSEK                                     MSEK
                      +13%                                 +3%                                   +11%
                                         2000                                        4000                            +3%         4000
 2000                                                                                3500
                                                                                                                                                              3,018
                                                                                                                                 3500                 +13%
                                         1500                                        3000                                        3000
 1500                                                                                                                                         2,660          FoodTech
                                                                                     2500
             1,870            2.118               1,773           1,822              2000    3,719   4,113             3,434
                                                                                                                                 2500     FoodTech           MSEK 700
                                         1000                                                                3,340               2000     MSEK 656
 1000                                                                                1500
                                                                                     1000                                        1500
                                                                                                                                           AirTech        AirTech
     500                                 500                                          500                                        1000                    MSEK 2,318
                                                                                                                                          MSEK 2,003
                                                                                        0                                         500
       0                                   0                                                 OI YTD OI YTD NS YTD NS YTD            0
            Q2 2020          Q2 2021             Q2 2020         Q2 2021                      2020   2021   2020   2021                   YTD 2020           YTD 2021

Order intake, Q2: +13%, FX-adjusted +23% Book-to-bill 1.2                           Order intake, YTD 2021: +11%, FX-adjusted 22%, Book-to-bill 1.2
• AirTech: Strong growth mainly driven by the battery sub-segment in regions APAC   • AirTech: Strong growth driven mainly by the battery and pharma sub-segment
  and Americas                                                                      • FoodTech: Americas and EMEA good growth, offset by decline in APAC on the
• FoodTech: Decline in APAC on the back of a strong swine segment in China last       back of a strong Swine segment last year
  year. Partly offset by growth in EMEA and Americas
                                                                                    Order backlog, YTD 2021: +13%, FX-adjusted +21%
Net sales, Q2: +3%, FX-adjusted +13%
                                                                                    Net Sales, YTD 2021: +3%, FX-adjusted 13%
• AirTech: Strong growth driven mainly by the battery sub-segment in APAC and
                                                                                    • AirTech: Strong growth driven by an increase in the battery and pharma sub-
  Americas and Components segment. Services grew in all regions
                                                                                      segments and Services
• FoodTech: Growth in Americas and EMEA; decline in APAC
                                                                                    • FoodTech: Growth mainly driven by swine segment in China and the US
• Services represented 15% of NS
                                                                                    • Services represented 14% of NS

17
1           Net sales growth

 AirTech: Growth in battery sub-segment and Services
            Q2 Order intake                       Q2 Net sales                  YTD Order intake and Net sales                        YTD Order backlog
     MSEK                               MSEK                                     MSEK                                        MSEK
                                                                                            +16%
                      +21%                                 +5%
 1600                                   1400                                   3000                            +5%             3000
 1400                                                                                                                                                 +16%
                                        1200                                   2500                                            2500
 1200                                   1000                                   2000
                                                                                                                               2000
 1000        1,231            1,495      800      1,207           1,265                 2,574      2,979             2,460
  800
                                                                               1500                        2,334
                                                                                                                               1500
                                         600                                   1000                                                                           2,318
  600                                                                                                                                         2,003
                                         400                                                                                   1000
  400                                                                           500
  200                                    200                                      0                                                 500
    0                                      0                                            OI YTD OI YTD NS YTD NS YTD                  0
            Q2 2020          Q2 2021             Q2 2020         Q2 2021                 2020   2021   2020   2021                        YTD 2020           YTD 2021

Order intake, Q2: +21%, FX-adjusted +33%, Book-to-bill 1.2                     Order intake, YTD 2021: +16%, FX-adjusted 28%, Book-to-bill 1.2
• Strong growth driven mainly by the battery sub-segment in regions APAC and   • Growth driven mainly by the battery sub-segment in Americas and APAC and
  Americas; good growth for Services in all regions                              pharma sub-segment in the US
                                                                               • Components good growth, Mist Elimination continued weak order intake and
Net sales, Q2: +5%, FX-adjusted +15%                                             Data Centers US flat
• Growth driven mainly by the battery sub-segment in APAC and Americas and
                                                                               Order backlog, YTD 2021: +16%, FX-adjusted +24%
  Components segment
• Data Centers US and Mist Elimination grew slightly.                          Net Sales, YTD 2021: +5%, FX-adjusted 16%
• Services grew in all regions                                                 • Growth driven mainly by the battery sub-segment in APAC and Americas and the
• Services 21% of NS                                                             pharma sub-segment in the US
                                                                               • Services 20% of NS

18
1         Net sales growth

 FoodTech: Good growth in the US offset by decline in China
            Q2 Order intake                        Q2 Net sales            YTD Order intake and Net sales                               YTD Order backlog
     MSEK                                MSEK                               MSEK                                             MSEK                    +7%
                      -3%                                                                  -1%
 700                                     700               -1%             1400                                                700
                                                                                                                 -3%
 600                                     600                               1200                                                600
 500                                     500                               1000                                                500
                             636                   575                      800    1,172
 400         656                         400                       567                           1,156   1,023         992     400
                                                                            600                                                                              700
 300                                     300                                                                                   300            656
                                                                            400
 200                                     200                                200                                                200
 100                                     100                                  0                                                100
      0                                    0                                       OI YTD OI YTD NS YTD NS YTD                      0
            Q2 2020         Q2 2021              Q2 2020         Q2 2021            2020   2021   2020   2021                             YTD 2020         YTD 2021
Order intake, Q2: -3%, FX-adjusted +5%, Book-to-bill 1.0                   Order Intake, YTD: -1% FX-adjusted +8%, Book-to-bill 1.0
• Good growth in broiler, swine, layer and dairy segments in the US        • Americas growth (currency adjusted) mainly driven by US swine, layer and
• EMEA grew driven mainly by increased order for controllers to the US       dairy segments
  broiler segment                                                          • Region EMEA grew as demand for controllers and greenhouse solutions
• APAC declined, on the back of a very strong order intake in the swine      increased, APAC declined on the back of a strong swine segment 2020
  segment in China previous year
                                                                           Order backlog, YTD: +7%, FX-adjusted +12%
Net sales, Q2: -1%, FX-adjusted +7%                                        Net Sales, YTD: -3% FX-adjusted +6%
• Americas had good growth driven by the layer, swine and dairy segments   • Good growth in equipment business in Americas driven by broiler, swine,
• Region EMEA grew because of good development in greenhouse segment         layer and dairy segments. EMEA weaker development and APAC declined
• Sales declined in APAC

19
2 Adjusted EBITA-margin

 Flat adjusted EBITA Q2 and improved YTD 2021
                                     Group                                                            AirTech                                             FoodTech
 MSEK                                                                            MSEK                              +37%                 MSEK
     500                                                +17%               18%   400                 16.2%                      18%     300
                                                                                                                                                 17.1%                                   18%
                                                                                        15.0%                         15.7%
     450    14.7%           14.2%                                          16%   350                                            16%
                                                                                                                                        250
                                                                                                                                                              14.1%   14.6%              16%
     400                                                        13.3%      14%   300                         12.0%              14%                                            12.0%     14%
     350                                       11.7%                                                                            12%     200                                              12%
                                                                           12%   250          +13%
     300             -1%                                                                                                  385   10%                                         -21%         10%
                                                                           10%   200                                                    150            -18%
     250                                                         457             150                         281                8%                                                       8%
     200                                       390                         8%           181          205                        6%      100                                              6%
                                                                           6%    100                                                                                  150          119
            260                                                                                                                 4%                98                                     4%
     150                     259                                                  50                                                        50                80
     100                                                                   4%                                                   2%                                                       2%
      50                                                                   2%      0                                            0%           0                                           0%
       0                                                                   0%            Q2       Q2         YTD      YTD                         Q2           Q2     YTD      YTD
           Q2 2020         Q2 2021           YTD 2020          YTD 2021                 2020     2021        2020     2021                       2020         2021    2020     2021

Adjusted EBITA, Q2: weakened margin                                              AirTech: Improved margin Q2 and YTD
• Increased net sales and high utilization rates offset by constraints in the    • Increased net sales and high utilization rates improved the margin, partly offset
  supply chain, increased freight costs and a changed business mix                  by constraints in the supply chain, increased freight costs and for Q2 a changed
                                                                                    business mix
Adjusted EBITA, YTD: Improved margin
• Improved mainly because of increased net sales, high utilization rates         FoodTech: weakened margin Q2 and YTD
                                                                                                                     199              176
  and continued efficiency improvements                                          • Margin negatively impacted by increased raw material, freights costs and a
                                                                                   changed business mix. 2020 Q2 margin strong mainly because of growth in the
                                                                                   swine market in China

20
Delivering on our strategic journey

                             2020                                                                          2021
         2nd step in strategy implementation              3rd step in strategy implementation
                                                                                                                                     Status Q2 2021
     July: Sharpening measures, mainly AirTech            May: Accelerating the strategy implementation, FoodTech

     New strategy launched in 2020,                       FoodTech strategy presented May 2021                                           AirTech
     shortly after measures                               aiming at creating a unique connected offering
     announced                                            throughout the food production value chain                               • Full implementation
                                        • Savings MSEK                                                                               pushed to end
     • Exit non-core part of the          70 once         •   Accelerate the digital journey                • Full-year positive     2022/early 2023
       commercial business in the US      measures        •   E.g., Shift from 1st to 2nd generation IoT      impact on EBITA        due to Covid-19
     • Expand Data Centers US             realized            offering & scaling software operations          of est. MSEK 70
       manufacturing in Texas                                                                                 in 2023                   FoodTech
     • In the Netherlands, operations   • Total cost:     •   Strengthen footprint and offering
       to be consolidated                 est. MSEK 176   •   E.g. Set-up of distribution hub in Asia,      • Total cost:
                                                                                                                                   • Strategy launch;
     • In addition, several other                             improve production excellence in                est. MSEK 140
                                                                                                                                     implementation
       measures to be taken to                                Americas and Europe as well as                                         started, Head of
       ensure execution of the                                streamlined product offering in Europe                                 Connected Farms
       strategy                                                                                                                      appointed

21
3         Capital structure

 Strong cash flow development
                                 Cash flow development, LTM*                                                                  Cash conversion (LTM OCF**/Adj. EBITA)
     MSEK                                                              Cash flow from operating activities
     1200                                                                                                    120%
                                                                       Cash flow for the period
     1000                                                                                                    100%
      800                                                                                                     80%
      600
                                                                                                              60%
      400
                                                                                                              40%
      200
                                                                                                              20%
        0
     -200                                                                                                      0%
             Apr-Mar   Jul-Jun   Oct-Sep Jan-Dec Apr-Mar   Jul-Jun   Oct-Sep Jan-Dec Apr-Mar      Jul-Jun           Jul-Jun   Oct-Sep Jan-Dec Apr-Mar   Jul-Jun   Oct-Sep Jan-Dec Apr-Mar   Jul-Jun
              2019      2019      2019    2019    2020      2020      2020    2020    2021         2021              2019      2019    2019    2020      2020      2020    2020    2021      2021

 • Cash flow from changes in working capital had a positive impact on                                        • Cash conversion continued to be at a high level, although slightly
   cash flow of MSEK 39 (85) in the second quarter and a negative                                              lower than last quarter, mainly as a result of intense work to improve
   impact of MSEK -99 (28) for the first six months of 2021                                                    cash management and working capital management
 • Positive effect from working capital in 2nd quarter from both
   operational activities and a mix of various other items

     *LTM = Last Twelve Months                                          **Operating cash flow
22    Cash flow development includes discontinued operations
3       Capital structure

 Leverage in line with mid-term financial target range
                                    Development of leverage                                  Development of leverage
     Net debt / adj. EBITDAx, LTM                                                            • Net debt at the end of June amounted to MSEK 2,209 compared
       5                                                                                       to MSEK 2,208 at the end of March 2021
     4,5
       4                                                                                     • The leverage ratio per end of June was 1.9x which is the same
     3,5
       3
                                                                                               ratio as per end of March 2021 and end of December 2020
     2,5                                                                                       despite dividend pay-out and negative FX-rate effect relating to
       2                                                                                       USD/SEK
     1,5
       1
     0,5                                                                                     Re-financing enables long-term strategy execution
       0
           Apr-Mar Jul-Jun Oct-Sep Jan-Dec Apr-Mar Jul-Jun Oct-Sep Jan-Dec Apr-Mar Jul-Jun
                                                                                             •   New primary 5-year financing facilities established
            2019    2019    2019    2019    2020    2020    2020    2020    2021    2021
                                                                                                   •   MEUR 250 Revolving Credit Facility & MUSD 165 Term
                                                                                                       Loan Facility; same total commitment as previous set-up
                                                                                                   •   One financial covenant – Net debt / Adjusted EBITDA
                                                                                             •   Facilities agreement based on LMA* standard, different baskets
                                                                                                 under the agreement has been increased and made more
                                                                                                 dynamic

 * Loan Market Association
23
Agenda

 Highlights Q2 2021

 Implementation of strategy

 Q2 2021 financial highlights

 Summary

24
Continued good demand in the second quarter
 Strong demand                                   Supply chain constraints to remain            Delivery on long-term strategy

• Solid demand in main markets                  • Constraints in supply chain increased;      Execution of long-term strategy continued:
                                                  leading to longer lead times and sourcing   • AirTech: IP acquisition to strengthen
• Strong increase of order intake and sales;
                                                  related production disturbances               technology position; expansion Services
  driven by battery sub-segment in Industrial
  segment in AirTech and swine segment in       • Increased raw material and freights costs   • FoodTech: Launched updated strategy;
  the US for FoodTech                           • Constraints in supply chain expected to       focus on climate solutions and digital
                                                  remain in 2021                                solutions
• Adj EBITA-margin impacted by constraints
  in supply chain and change in business mix

25
Questions & Answers
You can also read