"MY HOME IS AN ASSET CLASS" - THE FINANCIALIZATION OF HOUSING IN EUROPE - Extranet
←
→
Page content transcription
If your browser does not render page correctly, please read the page content below

JANUARY 2022

THE FINANCIALIZATION OF HOUSING IN EUROPE

"MY HOME
 IS AN ASSET
       CLASS"          DANIELA GABOR & SEBASTIAN KOHL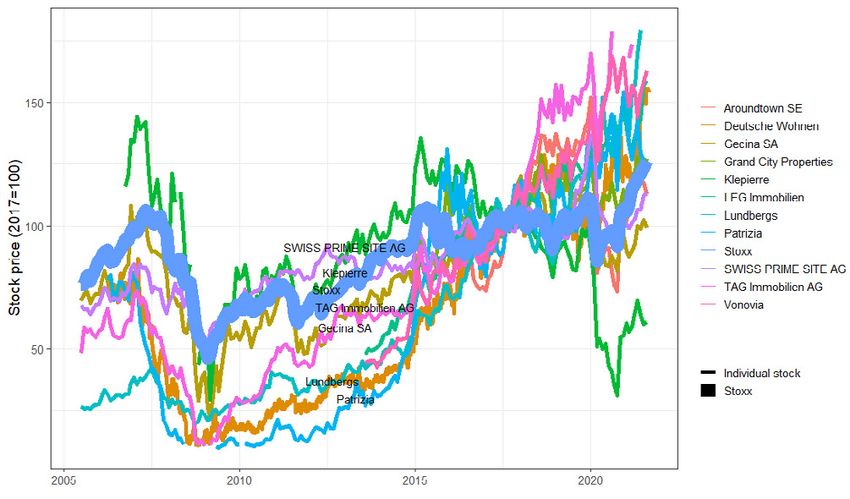
“Multifamily assets in Europe produce more stable income than in the US. But
because of different regulations by country in Europe, direct investment can
be difficult, so we participated in the Patrizia fund”1

SHINHAN ALTERNATIVE INVESTMENT MANAGEMENT INC,
ON BEHALF OF SOUTH KOREAN PENSION FUND

SUMMARY

Over the past decades, institutional landlords – from real estate companies
like the German giant Vonovia to private equity companies like Blackstone,
or pension funds like ABP, the Dutch pension fund for government and edu-
cation employees – have minted EUR 40bn of Berlin’s houses into assets
that they rent out. This is roughly double the combined value of London’s
and Amsterdam's institutionally owned houses and it is a trend that has
accelerated since the COVID19 pandemic. Europe’s residential real estate
has become an attractive asset class for investors worldwide, supported by
a range of government policies that are ostensibly aimed at homeowners:
support for housing markets pushes up house prices and reduces affor-
dability for citizens, whereas income support for rent-paying households
ensures stable returns for investors.

In response, citizens across Europe – from Berlin to Dublin and Madrid – have
mobilized to pressure governments into taking action. From rent controls to
better regulation or even expropriation of institutional landlords, the politi-
cal tide seems to be turning against a decades-old phenomenon known as
the financialization of housing. A mega-trend across housing markets eve-
rywhere, it can be understood as (1) the disproportionate growth of housing
finance relative to the underlying housing economy or (2) the turn to Housing
as an Asset Class (HAC), captured by the increasing for-profit and financial
orientation of actors in housing markets, and encouraged in Europe by a
broad range of European-level financial legislation.

In this report, we explore the growing importance of institutional landlords
such as Blackstone, focusing in particular on the mechanisms through which
European legislation has accommodated their strategies to transform housing
into asset classes. We use data from the private provider Preqin to map the
complex financial ecosystem behind private equity landlords. We then pro-
pose a set of reforms that would de-financialize housing for the public good.

THIS RESEARCH WAS FUNDED BY THE GREENS/EFA

1 https://www.kedglobal.com/newsView/ked202012170019
KEY TAKEAWAYS:

•    This study examines the growing footprint of institutional landlords in European residential
     housing. It identifies three reasons why institutional ownership deserves closer scrutiny, de-
     spite its relatively low share compared with private small landlords/owners: a) the negative
     social impact of institutional ownership; b) the growing structural demand for housing asset
     classes, with private equity/funds being the visible layer of a complex network of institution-
     al landlords that includes banks, pension funds and insurance companies, endowments and
     wealth managers; c) the ability to enlist the state in creating and de-risking housing asset
     classes to meet that structural demand, both via (European level) regulatory regimes and
     macroeconomic policies.
•    Institutional ownership threatens to accelerate the trends unleashed by the financialization
     of housing: deeper financial markets have not substantively increased either aggregate home
     ownership or housing supply, but instead have inflated house prices and pulled down rental
     yields. Housing affordability is a key problem across Europe’s cities, alongside decline or stag-
     nation of urban living space per person, more overcrowding, and higher burdens of housing
     costs, particularly in bigger cities and for lower-income households and for tenants.
•    Opaque structures of institutional ownership: there is little granular detail on institutional
     landlords, whether from either public or private sources. For instance, data from the Europe-
     an Public Real Estate Association shows non-listed (private equity) funds owned 30% of the
     EUR 2.7 trillion real estate assets in the EU282, while EU listed property companies and REITs
     owned 20% in 2020. Insurance companies, pension funds and sovereign wealth funds directly
     owned another 16%, but also invested in private equity funds, public equity and other housing
     asset classes. However, institutional landlords do not separately report the value of the resi-
     dential housing assets they hold.
•    Recent European initiatives under the Capital Markets Union – including the Simple, Transpar-
     ent and Standardized Securitization regime, the Securitization of Non-Performing Exposures
     and revisions to Solvency II capital requirements for insurance companies – will further ease
     the transition of residential housing from private into institutional ownership. This solidifies
     an uneven playing field, penalizing European citizens that cannot mobilize financial resources
     on a similar scale.
•    Without a regulatory framework, the COVID19 pandemic will accentuate four fundamental
     drivers of housing as an asset class:
     o     under cyclical pressures to address COVID19-related increases in public debt, Member
           States might further withdraw from providing affordable housing, beyond the (national
           variations in) Recovery and Resilience Plans’ investments. The revision of the economic
           governance framework should avoid a return to austerity policies and should encourage
           the opposite: increased public investment in social housing.
     o     Member States might again rely on institutional landlords as a countercyclical force to
           clean up burst housing bubbles, as institutional landlords can easily absorb non-perform-
           ing mortgage loans, often with preferential support from the state (e.g. post-2008 Spain,
           Ireland or Greece).
     o     build-to-rent: the growing, often direct, involvement of private investors in the develop-
           ment of new rental housing, replacing housing companies.

2   https://www.inrev.org/system/files/2021-04/INREV-EPRA-Real-Estate-Real-Economy-2020-Report.pdf

                                                             3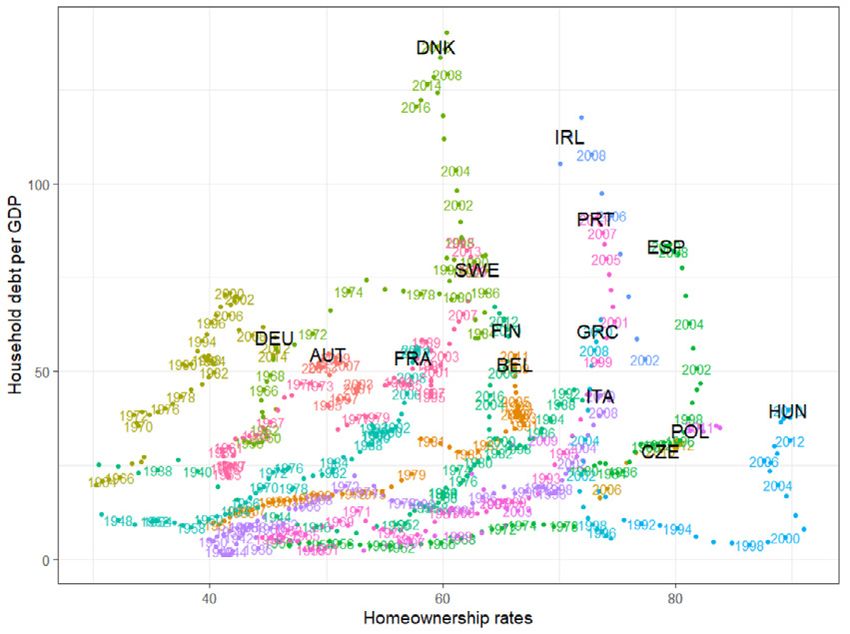
o    macroeconomic (fiscal and monetary policies), regulatory and housing policies that sup-
          port house price inflation and institutional ownership. In particular, when developing a
          new Social Taxonomy, the Commission and co-legislators should ensure that it prevents
          any social washing of housing assets held by institutional investors.

KEY POLICY RECOMMENDATIONS TO REGULATE INSTITUTIONAL LANDLORDS
1.   A Sustainable Institutional Housing framework: a social-washing-proof Social Taxonomy
     to anchor mandatory disclosure and regulation of institutional landlords

     a.   Carve out special provisions for Housing in the Social Taxonomy.

Given the importance of Housing and the precarious state it finds itself in across most Member
States, housing should be treated as a special asset class within the Social Taxonomy plans of the
European Commission. The aim is to both improve transparency across the board and to regulate
institutional landlords, while minimizing social washing. A socially-washed Taxonomy would allow
Blackstone to market its residential funds as eligible under Social Taxonomy, even if its practices
as an institutional landlord worsen living conditions for its tenants. To minimize social washing, we
propose the following two housing pillars:

     -    Apply both the vertical and horizontal dimensions to housing assets. In the Taxonomy
          proposals, the horizontal dimension focuses on the processes and practices of compa-
          nies that issue housing assets, while the vertical dimension defines adequate living stan-
          dards via an Availability, Accessibility, Acceptability and Quality (AAAQ) framework rooted
          in the Universal Declaration of Human Rights and the International Covenant on Econom-
          ic, Social and Cultural Rights. The vertical dimension is critical to minimize social washing.
     -    Create a three-bucket AAAQ approach in the vertical dimension that distinguishes clearly
          between the high, struggling and poor performance of housing assets. To avoid social
          washing, establish a high performing/struggling/poor benchmark for each AAAQ criteria
          and require the simultaneous fulfilment of the four benchmarks within the bucket.

     b.   Develop and implement a mandatory disclosure regime for institutional investors with
          exposure to housing asset classes.

The Social Taxonomy is (thus far) intended for a subset of investors that focus on social impact.
We propose mandatory disclosure for all institutional landlords using the Social Taxonomy in the
approach outlined above. Mandatory disclosure would not be too onerous given the wide use of
asset-level disclosure in the private GRESB ESG standards.

     c.   Develop and implement an escalation-based regulatory regime for institutional investors
          with housing asset classes on their balance sheet.

This aims to increasingly align institutional landlord practices with housing as a human right. Us-
ing the Social Taxonomy framework proposed above, (i) first remove all regulatory privileges con-
ferred in EU legislation for the past decades to all but the highest performing (positive tilt), (ii) set

                                                    4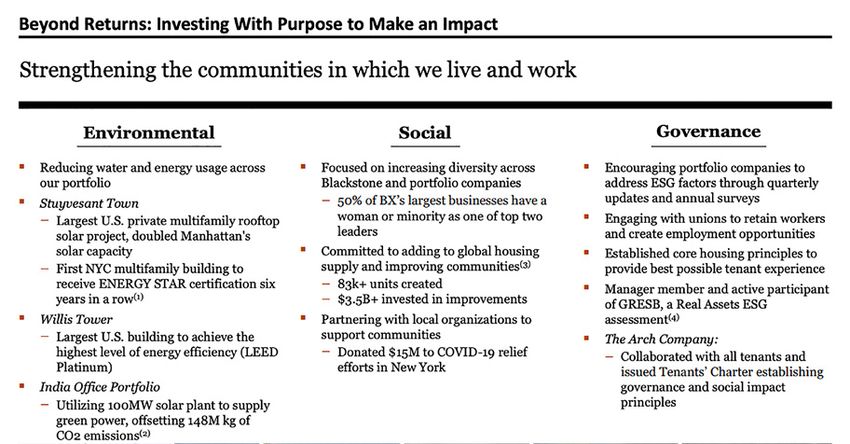
out incentives and a timeline for aligning HAC portfolios with the high-performance benchmark,
including progressively tighter penalties (negative tilt).

2.   A European Housing Fund that works as a:

     •   Countercyclical force to ring-fence the collapse of housing asset bubbles that typically
         result in the transfer of housing units from small private or public ownership into institu-
         tional portfolios. This curtails the erstwhile reliance of Member States on institutional in-
         vestors as a countercyclical mechanism during periods of crisis, and the use of public bad
         banks as a conveyor belt for distressed housing assets passing from commercial banks to
         institutional portfolios.
     •   Structural force, to raise financing for public investment in social housing.

3.   A Housing Red Flag Rule on new European-level regulatory initiatives: this requires the
     constellation of European regulators to ensure that new regulatory initiatives do not inad-
     vertently de-risk housing asset classes for institutional landlords. The Rule would ensure that
     housing asset classes are ring-fenced from any regulatory easing initiatives.

4. An extended macroprudential mandate for European central banks to react to house price
     inflation through the tighter, but socially just, regulation of mortgage lending following exam-
     ples from Sweden and New Zealand.

                                                   5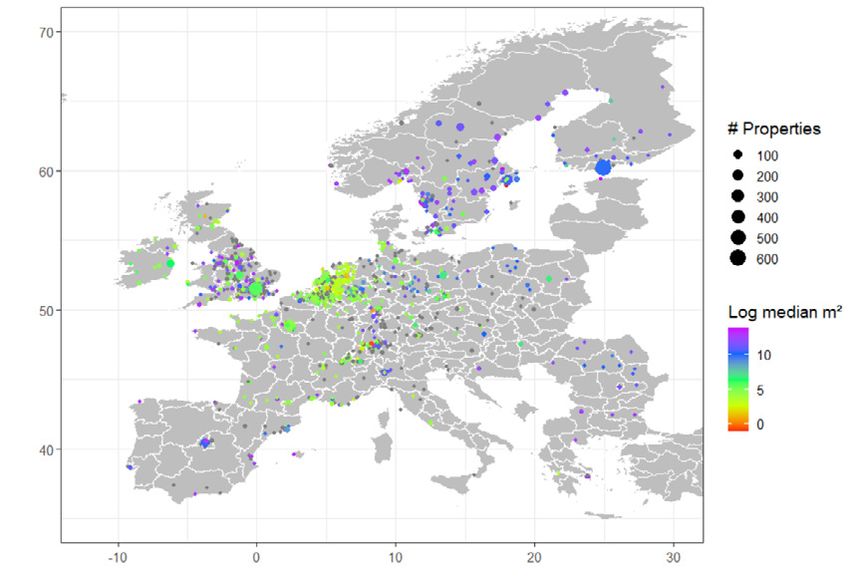
CONTENTS

8    1. HOUSING AS AN ASSET CLASS - THE AGE OF THE INSTITUTIONAL LANDLORD
10   Figure 1.1: Housing as an Asset Class
15   2. HOUSING AND MORTGAGE MARKETS IN EUROPE
     EUROPEAN HOUSING MARKETS – THREE BROAD SEGMENTS
15   Figure 2.1: Historical decline and recent comeback of private rental housing
16   Figure 2.2: Regulation of rent prices, tenancy security and housing rationing by legal origin
17   Figure 2.3: Rise and fall of social housing
19   Figure 2.4: Construction cycle (above) and share of private construction (below), averages
20   Figure 2.5: The rise of home ownership in Europe
20   Figure 2.6: Distribution of the population by tenure status by 2018
21   Figure 2.7: Increase of rental tenure (percentage points) of poor and rich households
21   MORTGAGE FINANCE
22   Figure 2.8: Total household debt per GDP (%) in European economies
23   Figure 2.9: Fiscal expenditures in favor of homeowners

24   Figure 2.10: Homeownership rates and mortgage debt
25   Figure 2.11: Co-evolution of building cycle with mortgage debt
25   Figure 2.12: House price trends in major European cities
26   Figure 2.13: Home ownership rates in European cities
27   Figure 2.14: Rental yields (%) in major European cities
27   Figure 2.15: Housing overburden rates by income quintiles
28   Figure 2.16: Number of rooms per person by market segment
29   Figure 2.17: Overcrowding rate (%) by urbanization
29   MORTGAGE INSTITUTIONS
30   Figure 2.18: Countries by liberal/conservative mortgage regime
30   Figure 2.19: European mortgage debt structure per GDP, averages 2008-2019
31   Figure 2.20: Total residential loans to GDP (index) in different parts of Europe
32   3. THE FINANCIALIZATION OF HOUSING
32   3.1 Housing as an Asset Class (HAC) in Institutional Portfolios
32   Figure 3.1: Housing as an Asset Class
33   Figure 3.2: Institutional investors in European residential real estate (August 2021)
34   Figure 3.3: Location of institutional investors with exposure to European residential funds
     (2021)
34   Figure 3.4: Number and size of yearly real estate deals by market segment
35   Figure 3.5: Number and size of residential real estate deals by countries
35   Figure 3.6: Number of residential deals since 2013 by major city
37   Figure 3.7 Institutional transactions, buy-to-let apartments, Europe
37   Figure 3.8 Distribution of housing assets in institutional portfolios, 2021
37   3.2 Securitization of housing loans
37   Figure 3.9: Total covered bonds outstanding, bn Euro
38   Figure 3.10: Total covered bonds outstanding, bn Euro, and annual change by country
39   Figure 3.11: Stock of Residential Mortgage-Backed Securities, Europe (EUR bn)

                                                   6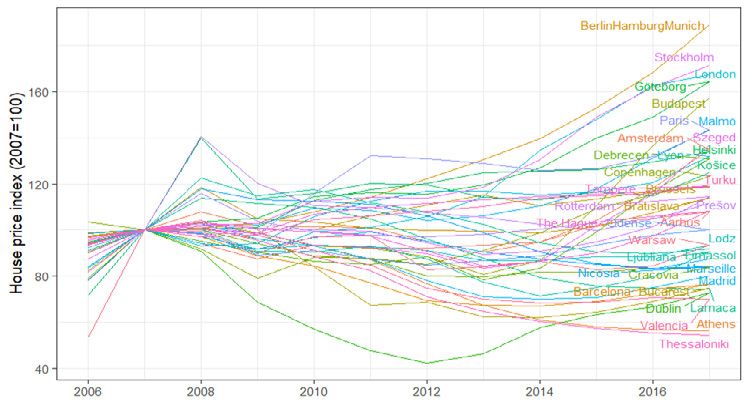
41   Figure 3.12 Top sellers and buyers of non-performing loans, 2015-2017
41   3.3 Private equity real estate (PERE) funds
42   Figure 3.13 Real estate funds: open-ended vs closed-ended, Euro area (assets, million Euro)
43   Figure 3.14 Residential real estate funds by country of origin and vintage year
44   Figure 3.15 Funds targeting Germany’s residential housing, 2021
44   Table 3.1: Private equity real estate funds vs public equity
45   Figure 3.16 PERE deals in Europe by property type

45   Figure 3.17 PERE deals in Europe, 2012-2020
47   BOX 1: Blackstone Property Partners Europe fund
49   Table 3.3 Top 10 PERE funds closed in 2020
50   Table 3.4 Largest Europe-Focused Private Real Estate Funds in Market (July 2020)
50   Figure 3.18 Top 5 investors in PERE funds, by category (2020)
51   Figure 3.19: Fund managers by number of funds and assets under management
51   3.4 Public equity: REITs in Spain and Ireland
52   Figure 3.20: Distribution of REITs’ properties across European cities
53   Figure 3.21 REITs legal regimes in Ireland and Spain
54   Figure 3.22 IRES REIT Ireland – portfolio and average rent
55   Figure 3.23 Real estate assets, SOCIMIs listed in Alternative Markets (EUR bn)
56   3.4 Public equity: Listed Real Estate Companies
56   Figure 3.24 Stock prices of major European real estate companies and the STOXXBox 2
     Patrizia sa European Real Estate Investment Manager
57   3.5 Institutional investors Insurance Companies
58   Figure 3.25 Decomposition of life insurer portfolios over one century
59   Figure 3.26 Insurance investments in property
59   3.6 Pension funds
60   Figure 3.27 Direct and indirect pension fund investments in land and real estate (%)
61   Figure 3.28 Dutch institutional investors’ investments in land and real estate (%)
62   Figure 3.29 Danish mortgage bonds held by different investor types (%)
63   4. THE CONTRIBUTION OF EU POLICIES TO THE FINANCIALIZATION OF HOUSING
63   4.1 Insurance companies
64   Table 4.1 EU regulatory framework for Housing as an Asset Class
66   4.2 Pension Funds
68   4.3 Credit institutions
70   4.4 Residential/RE funds
73   5. RECOMMENDATIONS FOR EU LEGISLATIVE ACTION TO SLOW DOWN AND TACKLE
     FINANCIALIZATION: A EUROPEAN HOUSING FRAMEWORK
74   5.1 A Housing Upgrade in the Social Taxonomy to underpin mandatory
     disclosure and regulation of institutional landlords
75   Figure 5.1 Blackstone BPPEH reporting of ESG issues
75   Figure 5.2 Blackstone BPPE ESG performance, Preqin assessment
79   5.2 The European Housing Fund
81   5.3 A Housing Red Flag Rule on new European-level regulatory initiatives
83   REFERENCES

                                                  7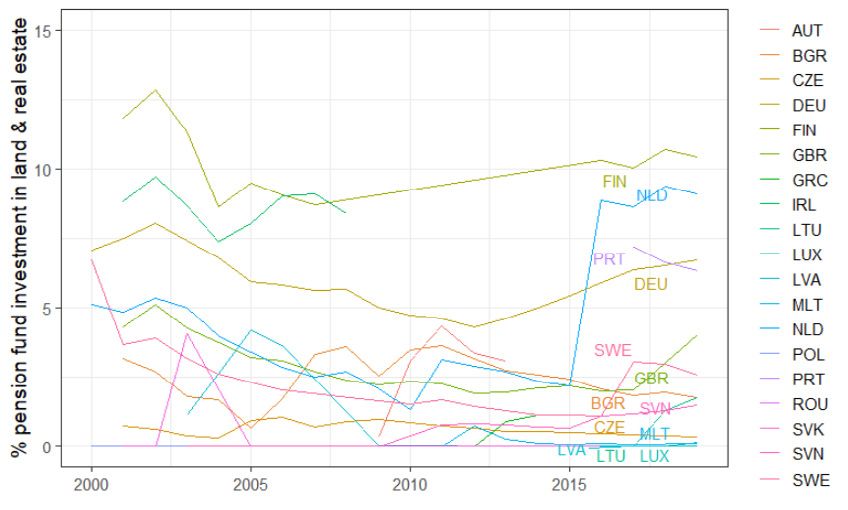
1

HOUSING AS AN ASSET CLASS
THE AGE OF THE INSTITUTIONAL LANDLORD

Institutional ownership of housing has become increasingly contested. Just in 2021, in Europe,
Spain and Ireland introduced restrictions on institutional investors in housing markets (directly
and via higher taxes), while Berlin residents voted to expropriate big landlords such as Vonovia
and Deutsche Wohnen. The Biden Administration plan to increase affordable housing supply de-
nounced large investors for crowding out individual homebuyers. It noted that large investors
had purchased one in six homes in the second quarter of 2021 (and in some cities one in four)
and announced measures to restrict institutional investors’ access to US housing markets.3 Not
incidentally, in October 2021 Blackstone, the world largest institutional landlord, reported the best
ever profits and inflows in its history4.

The growing concern over institutional landlords captures an important trend that has acceler-
ated with the COVID19 pandemic and ongoing low interest rates on safe assets: an institutional
appetite for Housing as an Asset Class. It is on this recent dynamic, the incoming age of the in-
stitutional landlords, that the study zooms in. While we recognize the importance of small-scale
private (rental) ownership, we do not focus on it for two reasons. First, institutional ownership has
a distinctive political economy, which we elaborate below. Second, we are interested in, and map
here, a neglected aspect of institutional ownership: the financial regulation that allows, or in some
cases encourages, investors to mint new housing assets. This is particularly relevant in the Euro-
pean Union. There, in contrast to national-level rules that organize private landlords, European fi-
nancial regulation has accommodated, and (often unwittingly) encouraged, the growing footprint
of institutional investors in residential housing.

FROM FINANCIALIZATION OF PRIVATE HOUSING TO THE RISE OF INSTITUTIONAL LANDLORDS

The financialization of housing is a complex and evolving phenomenon. Originally, the first wave
of financialization literature explored the build-up of private mortgage credit through the rise of
home ownership and the introduction of new securitization techniques (Aalbers 2008; Rolnik
2013), as US subprime credit featured central stage in the run-up to the Global Financial Crisis of
2008 (Schwartz 2009). That research focused predominantly on countries with the most finan-

3 https://www.whitehouse.gov/briefing-room/statements-releases/2021/09/01/fact-sheet-biden-harris-administration-announc-
es-immediate-steps-to-increase-affordable-housing-supply/
An estimated $87bn of institutional money went into America’s rental-home market during the first half of this year, according to Red-
fin, a residential brokerage. Around 16% of single-family homes for sale were bought by investors in the second quarter, up from more
than 9% a year earlier.
https://www.economist.com/finance-and-economics/2021/09/25/beware-the-backlash-as-financiers-muscle-into-rental-property
4 https://www.ft.com/content/10de97da-30e9-4c92-a3a7-5da251706c3e

                                                                   8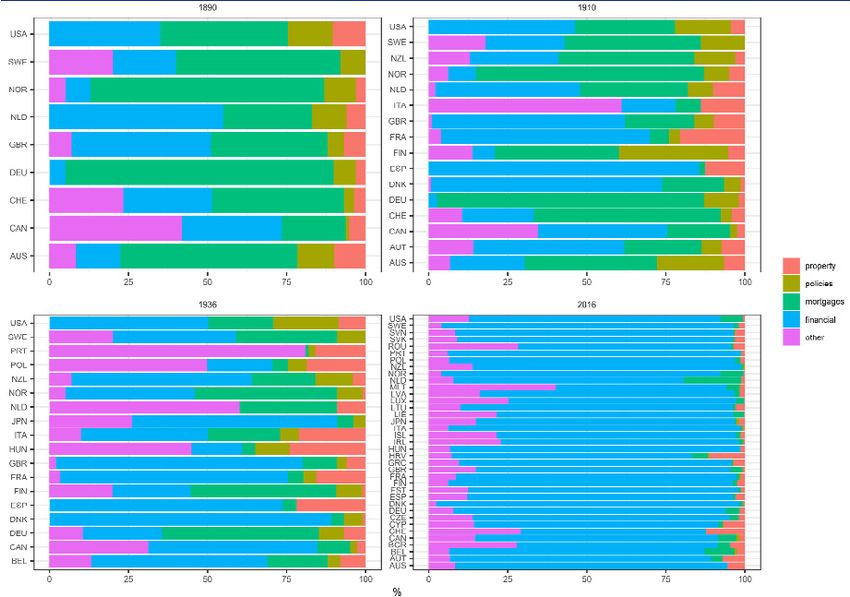
cialized housing systems (Fuller 2019), i.e. the US, the UK, but also the Netherlands (Aalbers et al.
2011; Engelen and Glasmacher 2018), Spain, and the European periphery (Bohle 2018). It also not-
ed that in Scandinavian countries, the income security provided by collective wage negotiations
and generous welfare constituted a route towards higher mortgage debt (Anderson and Kurzer
2019; Johnston et al. 2020; Stamsø and Tranøy 2020).

Overall, financialization has turned into a “variegated” phenomenon with different institutional
and country trajectories (Aalbers 2017), in which private finance enters the housing sphere while
non-financial firms, private households and state housing actors become increasingly dependent
on financial markets and act more and more financialized. This includes private households buying
speculative secondary real estate (Seabrooke 2010) and buy-to-let (Aalbers et al. 2020), short-
term rentals (Clancy 2020; Cocola-Gant and Gago 2019), as well as non-profit housing associa-
tions becoming more profit-oriented such as in the Netherlands (van Loon and Aalbers 2017) or
being privatized outright such as in Germany (Wijburg and Aalbers 2017). “Generation Rent” be-
came a focus for institutional investors across many countries, particularly those with declining
home ownership rates and booming house prices such as Ireland, the UK, Spain and the Nether-
lands (Byrne 2020).

This study explores what the literature describes as Financialization 2.0 – the growing footprint of
institutional investors in housing, such as Blackstone. Wijburg et al (2018) characterize Financial-
ization 2.0 as a switch in institutional business models, from private equity and hedge funds that
use housing for speculative purposes (buying low, selling high, increasing rents without mainte-
nance) to institutional landlords that manage portfolios of residential housing, generating both
rental income and capital gains as the market value of houses in ownership increases (Fields and
Uffer 2014; Wijburg et al. 2018).

But we depart from the distinction between purely speculative and long-term investment to ex-
amine a variety of institutional strategies to construct housing as an asset class (HAC). HAC refers
to residential housing in institutional/corporate – rather than private – ownership. It does not have
a specific temporal dimension in that institutional landlords – be them listed real estate compa-
nies, private equity funds or Real Estate Investment Trusts (REITs) – can acquire and sell housing
assets depending on a series of strategic considerations that include relative yield, regulatory
constraints and individual business models. As we document in Chapter 3, residential portfolios
may often change institutional owners across private equity funds, REITs or listed RE companies,
but essentially, houses remain in institutional ownership.

Housing as an asset class involves residential housing – be it in private ownership, rental owner-
ship or social housing – providing a stream of revenue to institutional investors (see Figure 1.1),
including pension funds, insurance companies, endowments or managers of individual wealth
(high-net worth individuals). Consider an insurance company. It can be exposed to residential
housing via several financial instruments: it can lend directly through residential mortgages, it can
purchase fixed income instruments (bonds or money market instruments) issued by other inves-
tors to finance their portfolio of residential housing, it can purchase shares issued by real estate
companies or REITs, and it can invest in private equity real estate funds5.

5 For both private equity and REITS, commercial real-estate (offices, shopping malls, business properties, etc.) are typically more
important than housing as an asset class, but there are a couple of dozen REITs uniquely devoted to residential real estate.

                                                                   9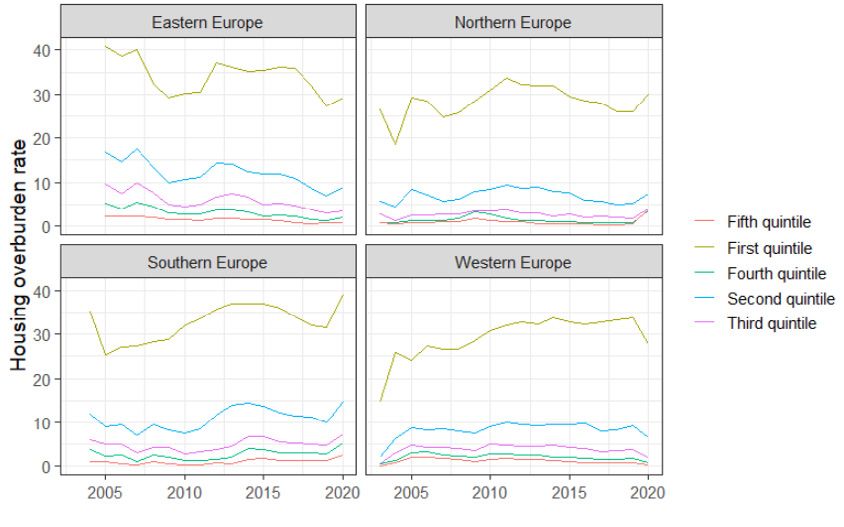
FIGURE 1.1: HOUSING AS AN ASSET CLASS

                                                          SECURITIZATION                                                     ISSUE
                                                              (MBS)                                                       MORTGAGE
                                                                                                                             LOANS
                                            RENT-                                              RECEIVE INTEREST PAYMENT
                                           BACKED
                                          SECURITIES
                                                           BONDS
         PRIVATE      MORTGAGE PAYMENTS
                                                                                           PURCHASE BONDS
        OWNERSHIP                                                 UNSECURED                                                           RECEIVE
                                                COVERED             NOTES                                                             MORTGAGE
                                                 BONDS                                                                                PAYMENTS
NON-PERFORMING
    LOANS
                                                                                                     RECEIVE DIVIDEND     INSTITUTIONAL
                                                                                                                            INVESTORS

         RENTAL         RENT PAYMENTS     HOUSING AS AN ASSET CLASS                                                                    PENSION FUNDS
        OWNERSHIP                                                                                                                INSURANCE COMPANIES
                                                                                                                                          ENDOWMENTS
                                                                                                                                                 SWFs
                                                                                                                                        FAMILY OFFICES
                                                                                                                                      ASSET MANAGERS
                                           LISTED REAL                   RESIDENTIAL
                                              ESTATE                        REITS
                                           COMPANIES       ETFs
           SOCIAL       RENT PAYMENTS
          HOUSING                                          PUBLIC EQUITY

                                                       PRIVATE EQUITY
                                                                                         PURCHASE SHARES

                                                   RESIDENTIAL          RESIDENTIAL/RE
                                                    MORTGAGE                                                 NAV SHARES
                                                                            FUNDS
                                                     FUNDS

           THE POLITICAL ECONOMY OF INSTITUTIONAL LANDLORDS

           There are three distinctive elements of a political economy of institutional landlords:

                 •   Adverse consequences of large institutional landlords for tenants, housing maintenance
                     and neighborhood development.

           While the inflow of large institutional funds into housing can potentially increase the supply of pro-
           fessionally managed rental units (Pawson and Milligan 2013), there is a growing urban geography
           literature that rather points at the potentially adverse consequences for tenants, housing mainte-
           nance and neighborhood development. Even though many of these studies were conducted in US
           cities, they might foreshadow the housing conditions that European cities might soon be facing.
           First, studies across a variety of cities point to the adverse effects of disruptive eviction practices
           (Akers and Seymour 2018; Teresa 2019). Second, studies on both US and European cities identify
           negative consequences for housing affordability (Christophers 2021; Fields and Uffer 2014; Garri-
           ga et al. 2021). The negative impact on housing affordability is also the main finding of the recent
           report of the EU-Commission on financialization in seven European cities (EU-Commission 2020).
           With the displacement of lower-income tenants, who are often from minority groups, including
           as a result of renovation work (Baeten et al. 2016), gentrification changes the character of neigh-
           borhoods and reinforces existing urban inequalities (Aalbers 2019; Chelcea et al. 2015). Another
           adverse consequence arises when institutional investors hold back the supply of urban land, thus
           increasing housing shortages and driving up prices, as documented in relation to Ireland (Waldron
           2019). It is no coincidence that the UN special rapporteur on adequate living conditions expressed

                                                                            10
concerns to the Spanish and Irish governments that the presence of transnational investors such
as Blackstone have been associated with evictions, rental overburdens and housing shortages.6
The increasing presence of institutional investors in urban residential real estate has been asso-
ciated with adverse consequences for basic housing provision by both academic literature and
civil rights institutions.
• Growing structural demand from institutional capital that are chasing new/stable return
asset classes, including residential housing.
Although private equity landlords are typically the focus of political contestations, they are the
visible layer of a complex ecosystem of institutional housing ownership. This includes banks, pri-
vate equity firms and funds, REITs and real estate companies, institutional investors (insurance
companies, pension funds, family offices and endowments, cash-rich multinational corporations,
Sovereign Wealth Funds) and asset managers, which we capture under the umbrella term institu-
tional capital. Banks and other specialized institutions (mortgage banks, building societies, sav-
ings and loans institutions, Bausparkassen, cajas) extend mortgage loans, securitize mortgage
loans to issue Mortgage Backed Securities (MBS) that trade in capital markets, and finance private
equity firms, funds and real estate companies. Insurance companies also provide mortgage loans
and were historically important in primary-mortgage markets, but are now mostly important in
secondary-mortgage markets.
It is by considering the global portfolio glut – the institutional capital chasing yield, including in al-
ternative assets such as real estate – that the scale of institutional appetite for housing becomes
immediately apparent. In a manner similar to the banking glut of the 2000s, the global portfolio
glut captures the rapid accumulation of institutional capital (Gabor 2021), termed by some as the
age of asset management or asset management capitalism (Braun 2021). For instance, BlackRock,
the world’s largest asset manager, manages USD 10 trillion on behalf of institutional investors, a
considerable share of the USD 120 trillion managed by the top 500 asset managers worldwide7.
Asset managers invest in bonds, equity, ETFs and alternative asset classes. Take BlackRock: of
its USD 10 trillion assets under management, it allocated USD 256bn to alternative asset classes,
including real estate (commercial and residential), private equity, hedge funds, natural resources,
infrastructure and private debt.
Since alternative assets are created in private markets, data is scant. In this study, we rely exten-
sively on the Preqin private database, which offers one of the most detailed, albeit incomplete,
overviews of real estate investors, funds and large transactions in Europe. Preqin is a commercial
data analytics company that surveys institutional investors in alternative assets classes, includ-
ing real estate. It provides data on the size of institutional real estate investments outstanding
and the size of most large real estate portfolio deals. Missing data and the focus on large investors
and deals entails that the overall numbers we quote below need to be interpreted as lower-bound-
ary estimates.
6 https://www.ohchr.org/EN/Issues/Housing/Pages/FinancializationHousing.aspx
7 https://www.thinkingaheadinstitute.org/news/article/top-500-managers-see-assets-hit-record-119-5-trillion/
11Thus, in August 2021, Preqin listed more than 4000 institutional investors8, collectively managing
USD 136 trillion, of which USD 3.6 trillion targeting European real estate. Of these, 1325 investors
- with USD 44 trillion AUM - held residential assets in their RE portfolios. The private equity com-
pany Blackstone, the world’s largest institutional landlord, managed around USD 730bn, of which
USD 230bn was allocated to real estate in September 2021. In contrast, BlackRock only managed
10 real estate funds, with total assets around USD 10bn. The portfolio glut is thus increasingly
channeled through private markets: by 2021, pension funds, mutual funds, insurance companies
and other investors together lent around USD 7 trillion to private equity funds so that they could
target alternative asset classes, including residential housing.
The growing portfolio glut reflects several macrofinancial and political choices of the past 30
years (Gabor 2020). On the fiscal side, the weakening capacity of the state to tax multinational
corporations and the wealthy allows these entities to pour their cash into institutional invest-
ment vehicles, while the withdrawal of the welfare state from public health and state pensions
feeds pension funds and insurance companies. On the regulatory side, the substantive efforts to
regulate global banking after the collapse of Lehman Brothers have not been matched by similar
policies to regulate systemic institutional investors, despite initial commitments to the contrary.
This has encouraged reallocations towards institutional capital. On the monetary side, the un-
conventional monetary policies introduced post-Lehman Brothers have encouraged investors to
search for yield outside ‘traditional’ assets like government bonds, and to move into new asset
classes, including housing.
Even if/where the share of institutional landlords is still relatively low compared to small rentier
landlords, it is likely to grow in the future, powered by the portfolio glut.
●
• Ability to profit from housing market crises and to enlist the state in de-risking housing
asset classes.
Institutional investors can acquire residential housing by participating in the privatization of pub-
lic housing stocks, by absorbing non-performing mortgage loans from private lenders or pub-
lic bad banks in the wake of housing crises, by purchasing larger public housing portfolios and
by building new housing stock through build-to-rent schemes (Aalbers et al. 2020; Christophers
2021). As we document below, the share of public housing units has largely been in decline in the
great majority of countries because fewer new public housing units were constructed (in most
European countries), because sitting tenants received a right to buy (such as in the UK or Eastern
European countries), or because institutional investors bought larger housing portfolios (e.g. in
Germany in the 2000s).9 The different providers of social housing units have come under pressure,
either because subsidies have been cut (Aalbers et al. 2017) or because their municipal owners
came under the pressure of austerity (Van Duijne and Ronald 2018). As a result, social housing has
not only been in decline in most countries but has also been targeting narrower parts of the pop-
ulation (Alves and Andersen 2015; Kährik and Kõre 2012; Ogrodowczyk and Marcińczak 2021). This
has even happened in some of the social housing provision regimes (Grander 2017; Hoekstra 2017;
Turner and Whitehead 2002) that were formerly the most universal, a phenomenon also known as
the residualization of social housing (Angel 2021).
8 this figure includes banks with real estate investments
9 See the literature on these topics (Clapham 1996; Hegedüs 2012; Held 2011; Murie 2016)
12Since they have scale and purchasing power that cannot be matched by small private landlords,
institutional investors are uniquely placed to take advantage of collapsing housing bubbles. First,
they can directly purchase portfolios of non-performing mortgages from commercial banks and
recover the housing collateral (Immergluck 2015). In the US, the state sold institutional investors
both government-owned foreclosed homes (Fields 2018) and distressed, government-owned sin-
gle-family home-loans (Greenburg 2017). In Europe, institutional landlords benefitted from the
distinctive political preferences for fiscal austerity that had shaped the set-up and functioning of
bad banks. Under the political pressure of fiscal austerity, governments used institutional inves-
tors as a countercyclical tool to manage the public costs of cleaning up commercial bank balance
sheets. Rather than retaining the housing collateral in public ownership, governments in Greece,
Ireland, Spain or the UK chose to organize bad banks (SAREB or NAMA) as a conveyor belt from pri-
vate distressed ownership to institutional ownership, with the state typically selling housing units
at preferential prices to institutional landlords (Wijburg et al 2018). As we document in Chapter
3, the top 3 buyers of non-performing loans in Europe throughout 2015 to 2017 were the private
equity companies Cerberus, Blackstone and Fortress.
But the state supports the ecosystem of institutional landlords beyond their role as countercy-
clical force in the aftermath of collapsing housing bubbles. In financial capitalism, the state func-
tions under a new imperative: to de-risk new asset classes for institutional investors (Gabor 2021),
including housing (see Christophers 2021). The political narrative is that public resources alone
cannot deliver the required investments in climate, health, education, infrastructure and indeed
housing, so policy makers should instead mobilize private finance for these public goals. Mobili-
zation of private finance requires the state to derisk new asset classes if the risk/return profile
does not match private investors’ preferences or their regulatory requirements. Such public inter-
ventions involve both regulatory de-risking – removing regulatory barriers that prevent investors
from creating and investing in new asset classes (as the European Commission intends to do via
the Social Taxonomy) – and macro de-risking, which redirects fiscal resources or monetary policy
interventions to align the risk/return profile of new asset classes with investor preferences. When
applied to housing assets, we show in this report, regulatory de-risking has involved a wide range
of policies from national-level favorable tax regimes to the European-level weakening of regula-
tory requirements for housing asset classes (notably via the Capital Markets Union). In turn, fiscal
and monetary de-risking encompasses a range of macroeconomic policies supportive of house
price inflation, in what Ryan Collins (2021) terms a finance-housing cycle.
In Europe, the European Commission’s work on the social taxonomy can easily become a regu-
latory de-risking opportunity for institutional investors if it allows them to social wash housing
asset classes. This is particularly important given the public controversies around the adverse
consequences that institutional ownership has for housing as a human right. So far, institutional
landlords have come to rely on the Global Real Estate Sustainability Benchmark to monitor the En-
vironmental, Social and Governance performance of property companies, REITs, and developers.10
But GRESB suffers from a series of problems that broadly characterize private ESG ratings, includ-
ing scope for social washing through a ratings methodology focused on funds rather than assets,
through questionable metrics to assess the environmental impact of the assets and through the
manipulation of ESG scores (with the help of ESG consultants). The Social Taxonomy could be an
10 By 2020, 100 institutional investors with USD 22 trillion AUM were relying on ESG metrics for real estate assets.
13opportunity to provide a public framework for both assessing the social impact of the transforma-
tion of housing into an asset class and putting in place a regulatory regime that aligns institutional
landlords with a human rights perspective.
Institutional landlords have grown a substantive footprint in residential housing with the help of
the de-risking state. The growing turn to ESG ratings, and the negotiations around a Social Tax-
onomy in Europe, may perversely accommodate further social washing (institutional landlords
claiming positive social impact) while enabling resistance to a regulatory regime anchored in
housing as a human right.
142
HOUSING AND MORTGAGE
MARKETS IN EUROPE
EUROPEAN HOUSING MARKETS – THREE BROAD SEGMENTS
Housing markets in Europe can broadly be divided into three distinct market segments: the own-
er-occupier sector, private tenancy and some form of social housing, i.e. households can either
own the main residence they live in, they can rent it from private landlords or they can rent it from
an institution offering below-market rents orchestrated through different ways of government
support.
Up until the post-WWII era, private tenancy was the dominant form of tenure in urbanizing and
industrializing countries. This was followed by a period of significant decline, as Figure 2.1 shows,
which was then reversed in more recent decades, a phenomenon also referred to as “Genera-
tion Rent” (Lund 2013). Mirroring the other two tenures combined, the decline of private rentals
to low levels has not been homogeneous across countries, but particularly pronounced in En-
glish-speaking and Scandinavian countries, while less pronounced in the German-speaking ones.
Figure 4 below shows the residual category that private rental housing otherwise occupies among
the households of the EU, particularly in Eastern European member states.
FIGURE 2.1: HISTORICAL DECLINE AND RECENT COMEBACK OF PRIVATE RENTAL HOUSING
Source: Private rentals are calculated as residuals of previous social-housing and ownership shares (Kholodilin et al. 2022)
15Private tenancy is also accompanied by different regulatory styles across Europe, as Figure 2.2
shows for countries grouped by legal origin (Kholodilin 2020b). It can be regulated along three
dimensions: prices can be free or regulated (rent laws), tenants can be freely evicted or protect-
ed (tenancy security) and rental units can be freely offered on markets or distributed by state
preferences (allocation restrictions such as rationing). A long-run dataset (remain-data.org) has
coded the existence of laws into a standardized index ranging between 0 and 1 along these three
dimensions for almost all countries worldwide (cf. Figure 2.2).
The grouping of European countries by legal origin shows a relatively clear hierarchy of regula-
tion traditions, the early war times excepted: Anglophone countries have the least tenant-friendly
regime, whereas both German and Scandinavian countries intervene much more strongly in the
tenancy contract. Most countries have implemented some sort of security of tenancy and reg-
ulate price increases. In recent times, there has been a comeback of stricter price regulation of
even nominal price levels and certain restrictive allocational measures on the subnational level,
for instance in Germany (Berlin) or in Spain (Catalonia). The introduction of stricter rent controls is
back on the policy agenda in other countries as well. Exceptional Corona-related measures such
as rent moratoria and eviction controls are reminiscent of measures last seen during wars (Kholo-
dilin 2020a).
FIGURE 2.2: REGULATION OF RENT PRICES, TENANCY SECURITY AND HOUSING RATIONING BY
LEGAL ORIGIN
Rent_control
1.0
English
French
0.8
German
Scandinavian
Intensity
Socialist
0.6
0.4
0.2
0.0
1920 1940 1960 1980 2000 2020
Tenure_security
1.0
English
French
0.8
German
Scandinavian
Intensity
Socialist
0.6
0.4
0.2
0.0
1920 1940 1960 1980 2000 2020
Rationing
1.0
English
French
0.8
German
Scandinavian
Intensity
Socialist
0.6
0.4
0.2
0.0
1920 1940 1960 1980 2000 2020
Source: remain-data.org (Kholodilin 2020b); each regulation index is standardized between 0 and 1, where 1 is the strictest and 0 no regulation; the upper panel reports
the intensities of rent price regulation, the middle panel the degree of tenant protection measures and the lower panel restrictive measures of free market allocation (e.g.
rationing)
16Private tenancy was first pushed back by the entry of state-supported rental housing in almost
all European countries in the two post-war periods, when states became major providers of rental
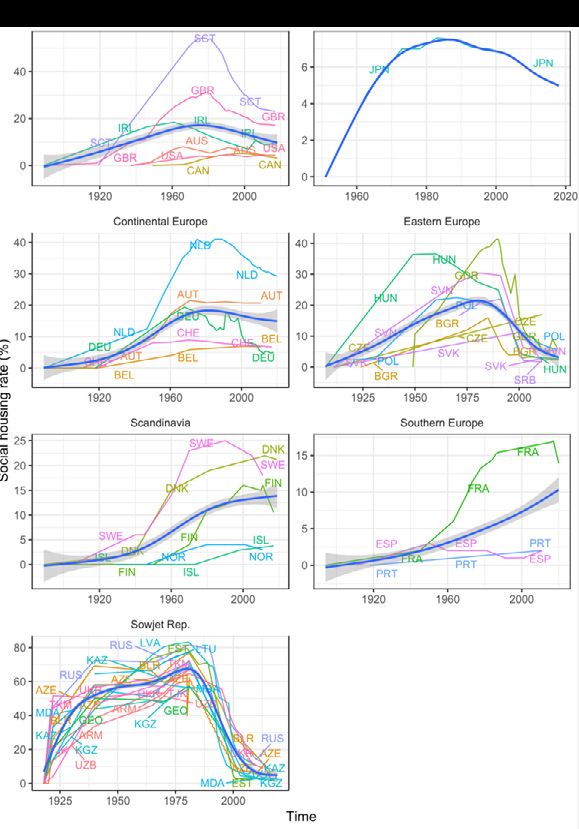
housing themselves or through non-profit associations of different kinds (Harloe 1995). Figure 2.3
shows how central and Northern European states created a social housing stock totaling up to
40% of the entire housing stock during the peak years of the 1970s (Kholodilin et al. 2022). Where-
as the nationalization of much of the urban housing stock led to even higher social housing rates
in Eastern European countries, Southern Europe never developed significant numbers of public
rental units. With the end of the post-war reconstruction boom and strained government budgets
since the 1980s, the overall trend of social housing is one of decline. The large-scale privatization
of Eastern European public housing stock made this a radical decline after 1990 (Stephens et al.
2015), whereas the decline was more continuous elsewhere: in some countries such as Germany,
the social housing stock declined to 4% whereas in other countries such as the Netherlands or
France, 20% or more is still social housing stock.
FIGURE 2.3: RISE AND FALL OF SOCIAL HOUSING11
Source: (Kholodilin and Kohl 2021), see for more visualizations here: https://dataverse.shinyapps.io/socialhousing/
11 Country abbreviation follow the iso3-standard: SCT = Scotland, GBR = Great Britain, IRL = Ireland, AUS = Australia, USA = United
States, CAN = Canada, JPN = Japan, NLD = Netherlands, AUT = Austria, DEU = Germany, CHE = Switzerland, BEL = Belgium, HUN =
Hungary, BGR = Bulgaria, CZE = Czech Republic, SVK = Slovakia, POL = Poland, SRB = Serbia, SVN = Slovenia, SWE = Sweden, DNK =
Denmark, FIN = Finland, NOR = Norway, ISL = Iceland, ESP = Spain, FRA = France, PRT = Portugal
17This overall declining trend in social housing also becomes visible in the new construction of
housing units (Kohl 2020). Their number, relative to the total population, has been decreasing ever
since the height of the construction boom of the 1970s (cf. Figure 2.4). Over the same time period,
the share of private construction has continuously increased at the cost of social housing con-
struction, which could amount to over one third in the post-war era and currently lies around 10%
on average. It is not just that total social housing stock is currently at a low. Extrapolating current
construction trends would also imply a further future decline.
While there are many factors at work behind the overall stagnation or decline of social housing,
one is particularly European and related to EU competition law (Elsinga and Lind 2013). Generally,
social housing and tenancy regulation are still inherently national domains of policy-making in
countries of the European Union with no direct EU competences and no European social housing
model. There is a lack of “positive integration” (Scharpf 1998) of housing policies at the European
level: rather than positive integration, EU competition policies can even have a detrimental effect
on social housing provision in certain country contexts.
The Swedish non-profit housing sector is such an example (Bengtsson 2013). Traditionally,
ever since the post-WWII era, Swedish social housing policy has focused on a growing sector of
non-profit public rental units that are municipally organized. They have proven to be relatively
resilient despite the general retrenchment trends shown in section 2 (Blackwell and Bengtsson
2021). Together with a system of corporate rent-setting that determines rent levels throughout
the housing stock, they make up an important element of housing provision in Sweden.
In 2002, the Swedish real estate association accused the Swedish state of illegal state support
for the social housing associations on the grounds that it distorted free competition on the rental
market, given that all housing providers had to follow the rent-setting regime (Bengtsson 2013:
176). This triggered several rounds of investigations from the EU Commission, followed up by fur-
ther complaints from the real estate sector in Sweden. While rent setting and social housing were
first viewed as a purely domestic issue, it soon became clear that the EU competition laws could
be applied to Swedish social housing providers. In consultation with the Swedish tenant union,
the government reacted by passing a new law on social housing providers which obliged them to
show a stronger commercial orientation, while still following the general rent-setting system. With
this law in place in 2010, the Swedish real estate association withdrew its complaint, while social
housing providers have ever since been more assimilated to a private market actor (Bengtsson
2013). The Dutch social housing provider was under similar EU pressure and subsidy programs
were reduced to target groups below certain income limits (Elsinga and Lind 2013).
18FIGURE 2.4: CONSTRUCTION CYCLE (ABOVE) AND SHARE OF PRIVATE
CONSTRUCTION (BELOW)
Unweighted averages and standard deviation. Source: (Kohl 2020)
The second reason for the decline of private and thus also social tenancy is the almost universal
trend of rising home ownership throughout countries (cf. Figure 2.5), which crowded out the two
other housing segments (Kholodilin and Kohl 2021). The rise is again most dramatic in Eastern Eu-
ropean countries which simply sold existing state or cooperative housing units to sitting tenants
(Turner 1997). This happened to almost the entire housing stock in South-eastern European coun-
tries and was slightly less radical in the Visegrad states, where other tenancy forms have per-
sisted. The rising trend was more gradual elsewhere: Southern-European countries exhibited the
steepest curves since they converted most private rental stock into owner-occupied apartments
(Voigtländer 2009), reaching similarly high home ownership rates to Eastern European countries
(Stephens et al. 2015). The rise was less pronounced in Scandinavian countries and least pro-
nounced in Germany and Austria, which have the lowest home ownership rates in the EU.
19FIGURE 2.5: THE RISE OF HOME OWNERSHIP IN EUROPE
Source: (Kohl 2017), see for more visualizations here: https://sebastiankohl.shinyapps.io/Home ownership/
These historical trajectories leave the European Union with a diversity of housing-tenure types
among its member states, as summarized in Figure 2.6. First, there are the super-home ownership
countries of (south-)eastern Europe with almost no alternative form of tenure other than residual
(Stephens et al. 2015). In stark contrast to their Western European peers, the share of indebted
homeowners is also very limited in these countries (Bohle 2018). Southern European countries
share the high home ownership rates, but have many more indebted homeowners in this group
(Allen 2006). They also offer at least some alternative forms of tenure. North-Western European
countries (Scandinavia and Benelux) have lower home ownership rates, but the highest level of
indebted homeowners. They have broadly realigned with Anglophone countries (Fuller 2019). Fi-
nally, German-speaking countries have the largest remaining private rental sectors with relatively
conservative developments of household indebtedness (Kofner 2014).
FIGURE 2.6: DISTRIBUTION OF THE POPULATION BY TENURE STATUS BY 2018
Source: Eurostat12
12 https://ec.europa.eu/eurostat/statistics-explained/index.php?title=File:Distribution_of_population_by_tenure_status,_2018_
(%25)_SILC20.png
20The most notable change in the recent decade has been the comeback of the private rental ten-
ure, pushed by housing affordability problems in big urban centers (Aalbers et al. 2020), the lack
of social housing and home ownership unaffordability, as well as by investors seeking new forms
of asset classes in times of zero interest rates since house price appreciation and even declin-
ing rental yields are still attractive in comparison to government bonds. Except in a few Eastern
European countries, more households had a private tenancy in 2019 than in 2008 in almost all
European countries (cf. Figure 2.7), a trend anticipated only by the UK in the 2000s (Whitehead et
al. 2012). The increase is particularly visible for poor households below the 60% median income
line: in Ireland almost 19% of poorer households entered the private rental sector, with double dig-
it-figures also in Sweden, Denmark and Belgium. But rental tenure increases were not restricted
to poorer households, as the right-hand side of Figure 2.7 shows: in most (Western-)European
countries they also happened to richer households. In the Netherlands, for instance, homeowner-
ship decreases were mostly centered in urbanized areas where housing affordability was lowest
(Hochstenbach and Arundel 2021).
FIGURE 2.7: INCREASE OF RENTAL TENURE (PERCENTAGE POINTS) OF POOR AND RICH
HOUSEHOLDS
Source: Eurostat (https://appsso.eurostat.ec.europa.eu/nui/show.do?dataset=ilc_lvho02&lang=en)
MORTGAGE FINANCE
The three housing market segments are all tied to different modes of finance, as residential in-
vestment is very capital-heavy. The owner-occupier sector and private landlords are connected
to capital markets, whereas social housing providers are usually connected to some kind of (ad-
ditional) state financing mode. Financialization of housing and mortgage finance refers first of
all to the unprecedented growth of mortgage debt across the European Union within the recent
21decades. In a narrower sense, it refers to the growing importance of finance and financial motive
in each of the three housing market segments (Aalbers 2017).
This overall growth of private housing finance for homeowners and landlords is reflected in what
has been called “the great mortgaging”, i.e. the unprecedented growth of outstanding mortgage
debt to GDP since approximately the 1980s to currently almost 70% of GDP in OECD countries
(Jordà et al. 2016), with the European average slightly lower (cf. Figure 2.8). In other words, in
many European countries the private mortgage debtors in a country would not fulfil the Maas-
tricht criterion of 60% maximum indebtedness to GDP. Private debt exceeds public debt in sev-
eral countries. In another comparison, private mortgage debt, on average, started to exceed the
amount of non-mortgage lending by banks around the year 2000 (Jordà et al. 2016). Commercial
and savings banks have changed their macro-economic role from financing business to financing
household debt, which is largely mortgage debt.
FIGURE 2.8: TOTAL HOUSEHOLD DEBT PER GDP (%) IN EUROPEAN ECONOMIES
DNK
IRL
100
PRT
ESP
SWE
GRC
FIN
DEU
AUT
50 BEL FRA
HUN ITA
POL
CZE
0
1970 1980 1990 2000 2010
Source: Bank of International Settlements (https://www.bis.org/statistics/totcredit.htm)
The average private household indebtedness within the EU is not equally distributed, as Figure
2.8 shows. The highest private debtor countries are either in the North or South – Denmark has
not only had a long tradition of accumulating mortgage debt, but, similar to other countries, has
shown a further debt increase as house prices boomed before the Global Financial Crisis of 2008
(Wood 2019). Furthermore, all Southern European countries outside of Italy follow the high-in-
debted Northern Europeans closely. The relatively indebtedness of Italy – and historically other
Southern European countries – has also been explained by the stronger significance of family sav-
ings and family mortgaging (Allen 2006). Eastern European countries are still the least indebted
relative to the size of their respective economy. This is not to deny, however, that they experienced
22one of the highest growth rates of private indebtedness before the crisis, as part of a process
also described as “mortgaging Europe’s periphery” (Bohle 2018). In between these two extremes,
we find more central continental countries whose debt levels have also not exploded during the
last house price boom. In fact, Germany is the only country that experienced declining debt lev-
els before the crash of 2008, whereas house-price busting countries also saw falls in mortgage
indebtedness.
One important background condition for the rise of mortgage indebtedness is the different ways
of home ownership support across Europe. Homeowners can generally either receive direct trans-
fers – sometimes paid out as incentive for specific housing savings (e.g. in Germany or Austria) –
or tax exemptions. Among the different tax exemptions, there is the non-taxation of imputed rent,
the reduced taxation of capital gains for owner-occupied housing, exemption of new construction
from VAT and the deduction of mortgage interest payments from income taxes. The OECD has
recently estimated foregone tax revenue for these fiscal exemptions for homeowners amounts to
more than one percent of GDP for countries which use them intensively, such as the Netherlands
or Sweden (cf. Figure 2.8). On top of the approximate 0.5-1% of GDP that countries pay in housing
allowances, more than 1% of GDP can be used as indirect fiscal support for homeowners.
FIGURE 2.9: FISCAL EXPENDITURES IN FAVOR OF HOMEOWNERS
Source: OECD. 2020. «Tax Relief for Home Ownership.» OECD Affordable Housing Database http://oe.cd/ahd
This rise of overall mortgage indebtedness went unsurprisingly together with the overall house
price boom and bust (Wood and Stockhammer 2020), but was surprisingly decoupled from two
goals that mortgage debt policies are aiming for: more home ownership and more construction
(Kohl 2018, 2020). We will discuss these three correlates of the “great mortgaging” – home owner-
ship, construction, prices – in turn.
23We saw above that home ownership rates have risen almost everywhere in the EU over time, just
with different trajectories. Part of the motivation behind the liberalization of financial markets in
the 1970s and 1980s was to deepen home ownership expansion by making mortgage credit more
widely available for aspiring homeowners. Yet, if one contrasts the historical “great mortgaging”
with the timing of home ownership expansion, as in Figure 2.10, it becomes clear that historical
periods where more mortgages actually lead to more home ownership are relatively rare. Instead,
Figure 2.10 shows how much of the home ownership extension (horizontal movement of dots to-
wards the right) occurred in years without almost any further mortgage indebtedness. The second
movement that sticks out, is vertical movements, where countries are on a trajectory of rising
debt without any further home ownership rate increases or even decreases, such as in Ireland.
This occurred particularly in countries that had already accumulated large amounts of mortgage
debt. There are few countries and years during which more mortgage indebtedness has indeed
been associated with proportional increases in home ownership. Instead, many countries have
accumulated pillars of debt.
FIGURE 2.10: HOMEOWNERSHIP RATES AND MORTGAGE DEBT
Source: Based on (Kohl 2018)
The deepening of financial markets has thus not necessarily increased home ownership much
further and it has also not necessarily led to major construction booms (Kohl 2018). The explosion
of mortgage debt started around the time when the post-war (re-)construction building cycle
had already passed its peak of the 1970s. Ever since, the overall trend in housing construction in
the European Union has been one of decline, as Figure 2.11 illustrates (without Eastern Europe).
24You can also read