NASDAQ 10'000, We may have reached the top
←
→
Page content transcription
If your browser does not render page correctly, please read the page content below
OUR MODEL PORTFOLIO
                           Mechelany Advisors                                        !

           "

                         ASSET ALLOCATION,   EQUITY MONITOR,   TECHNICAL ANALYSIS

   NASDAQ 10’000, We may have
        reached the top …
                                   JUNE 11, 2020 · MECHELANY ADVISORS

Finally last night the NASDAQ reached the 10’000 level, much faster in fact than most
people thought in a frenzied market and a last batch of strength in the tech mega-
caps.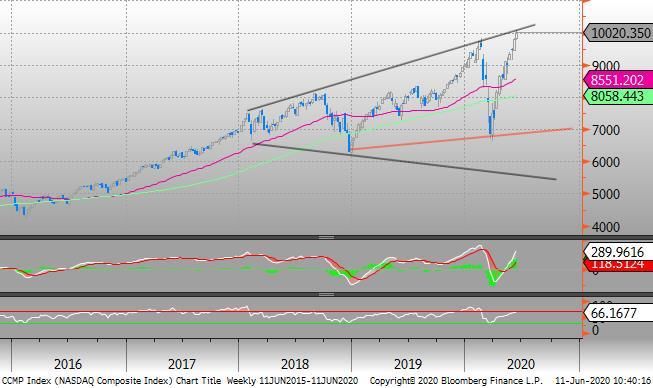
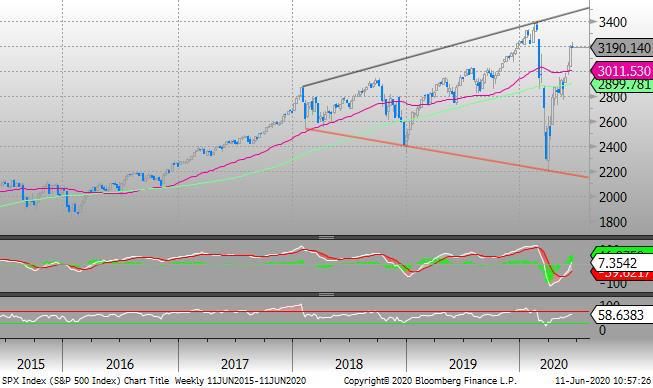
10’000 is clearly an important psychological milestone, but as the chart above shows,
it is a much more important technical level that marked all the important tops since
2018.

Our regular readers know that, way before COVID, in our various articles on the
anatomy of the coming bear markets we published these charts of the loudspeaker
patterns that have been amazingly prescient in marking the tops and bottoms.

As our readers also know, we have been predicting a turning point between the 20th
and the 25th of June with a least a 15 to 20 % correction in July, like most technical
analysts who conclude that we have started a new cyclical bull market.

Obviously, the NASDAQ could go a little bit higher from here as the Logarithmic charts
point to 10’300 by late June, another 3 % above current levels, and to complete the full
pattern the SP500 would have to peak at around 3’600 sometimes over the summer.

But if the NASDAQ really stops here and turns as the first chart
seems to indicate, then the coincident turn on the SP500 would
mark a lower high, and definitely signal that the secular bear
market has started.

Is this time different?
What is truly unusual in the current environment is the EXCEPTIONAL SPEED
and BREADTH of both the fall and the rebound since COVID.

Never have we seen such a fast melt-down in history and the current rebound has
been the fastest and largest since 1952. Maybe this is due to the extreme damage
caused by COVID and by the extreme reactions caused by Central Banks and
Government stimuli.

But frankly, neither one nor the other is actually good news as the economic damage
will be lasting and the liquidity injections may have saved the credit markets but will
create neither jobs nor investments.

If anything, the fundamental background is not rosy, even if we expect the economies
to recover initially, but reach a plateau afterward, while States, Governments,
corporations, and households will be left with additional debt and their deflationary
pressure for long.

What is also truly unusual is the speed at which sentiment has changed.

Back in January of this year, way before COVID, we highlighted that sentiment had
reached extremes that were making the markets dangerous. Within four weeks of that
call, the stock markets peaked, and one of the swiftest bear market declines in history
followed.

Today, market sentiment is looking extreme once again, and at this crucial technical
juncture on top. If anything, the new levels of euphoria make the January action look
sleepy. We are seeing bizarre market patterns, investor behavior that makes no sense,
and even snooty dismissals of top and reputed asset managers such as Warren Bu!ett.

We can begin by noting the euphoria is global.

Jason Goepfert of SentimenTrader observes that, in March 2020, every major world
index his team follows was in a bear market. Now, three months later, fewer than 15%
are still in bear territory, meaning that 85% or more have bounced back. The entire
world, more or less, has gone from bearish to bullish.

That level of global-scale reversal has happened only twice before, in 1988 and 2009.
In one case the 1987 stock market crash came prior; in the other case, it was the 2008
financial crisis.

But there are TWO major di!erences between these two previous occurrences and
today’s situation :

  1. In neither case was there an ongoing pandemic causing the worst recession in
     living memory as highlighted again yesterday by the World Bank
  2. These sharp rebounds took place from cheap valuations at the bottom, while at
     the March 23rd bottom, global equities were still much more expensive than their
     long term averages.

Moving up the chain of unusual, from the time of the March bottom, every single
stock in the S&P 500 has generated a positive return. Not most of them, not the vast
majority, but every single one.

What kind of recovery makes every single large-cap stock go up, and more than 85%
of the major world indexes go up, all together, all simultaneously?

What type of logical rationale is there for seeing the fortunes of every single company
improve? There are actually none. Quite the opposite in fact if one is to judge from the
latest news out of Starbucks, Hertz, Airlines or else.

One could imagine that a breakthrough vaccine for the novel coronavirus might
produce that kind of result — a kind of medical deus ex machina that removed the
pandemic threat entirely.

But in reality, we have the opposite of that situation: COVID-19 cases are accelerating
in some countries, and in America, it seems that ongoing protests have given the virus
a new lease of life across all 50 states. As we are reaching 10’000, Citigroup warns that its “panic/euphoria model” is flashing its most extreme levels since 2002. Citi’s panic/euphoria model “tracks metrics from margin debt to options trading and newsletter bullishness,” and now shows “sentiment at the most extreme level since 2002, when the tech bubble was dissipating.” “We are concerned that thoughtful approaches are being overwhelmed by the need to at least keep pace with price moves,” Citi’s strategists write. “People are ignoring joblessness, trade friction, social unrest, and risks that loom including possible COVID- 19 reinfections, the end of bonus supplemental unemployment checks and the upcoming elections.” A new category of investors have been feeding the latest rise As evidenced by their “top 100” holdings list, millennial traders on the Robinhood stock trading app are bidding up shares in names that have just gone bankrupt. Hertz, the car rental company that filed for Chapter 11 bankruptcy on May 21 finding itself crushed under $19 billion worth of debt. The legendary Carl Icahn, one of the greatest investors ever, threw in the towel and booked a $1.6 billion loss on his Hertz position. And yet Robinhood investors, apparently smarter than Icahn, decided to bid up Hertz shares anyway, creating a 500%-plus return in five trading days. Nor is it just Hertz. There are others like J.C. Penney Co., who filed a $7.2 billion bankruptcy case on May 15 — and whose shares nearly tripled in value a short time after. There are more of these, too — like Whiting Petroleum, wholly bankrupt and up more than 300% in the course of a week or two.
When trading busted stocks, the operating theme seems to be: “Find stocks that are
trading below five dollars — or better yet below 50 cents — and buy them on the
theory they might go up.” Never mind if the company’s equity has already been
pledged to creditors, with a 99.9% chance that all those buying and trading the
common stock will get wiped out. If you can sell to the next guy before the gavel falls,
it’s easy money.

As further evidence, this rally has nothing to do with actual economic recovery
whatsoever, and is just pure liquidity-fueled wackiness at this point, consider that,
along with the FAANGS, companies with garbage balance sheets are rising as if their
prospects were bright.

This makes little sense at all because, were the recovery real, a further steepening of
the yield curve and withdrawal of emergency stimulus, two things that will inevitably
come in recovery, would crush the companies with heavy debt loads and weak balance
sheets, or at least dampen their prospects.

Small traders options have accumulated net long call positions to levels NEVER seen in
the past. At some point, someone will have to buy those stocks for them to make
profits but they have done almost all the buying already recently.

Last but not least, in a sign, this rally is unusual, bulls that cannot find any valid
reasons for stocks to go up apart from the fact that stocks are going up are mocking
the likes of Warren Bu!ett and Stan Druckenmiller.

For all the critics he gets sometimes, Warren Bu!ett has undoubtedly earned his
stripes as the greatest value investor of all time and the warning message of his latest
annual address where he said he could find nothing to buy at the bottom is being
mocked.

Bu!ett was clearly a contrarian indicator in the late 90s dot-com bubble, not just due
to his own skepticism, but also to the ease with which perma-bull analysts claimed
that Bu!ett didn’t “get it.” When it came to dot-coms, Bu!ett “got it” just fine, of
course, and those who dismissed him as out of touch circa 1999-2000 soon
discovered the worst bear market of their lifetimes.
What all the above says is that when stock market euphoria is breaching dot-
com levels, in the middle of a pandemic that is not over, when nearly all large-
cap stocks and world indexes are going vertical in mass levitation, when even
bankrupt names are exploding via a zero-commission smartphone app, and when
time-tested investors’ opinions are bashed, normal investors should really start
to worry.

You play it as you want, but common sense and
cold blood commands that you are better off out
of these markets at current levels than piling in
like the new generation.
There are a few other things that worry us today besides the
upcoming earnings reporting season :

Is the US stock market rigged ?

As our readers know, we do not satisfy ourselves with things that have no rational
explanations and are prepared to explore every hypothesis, even if they are politically
incorrect.

All over this rebound, a strange phenomenon took place that left many commentators
scratching their heads and without a satisfactory answer. Almost every day of the rally
has seen an “invisible hand” intervening in the future markets every night, forcing it to
gap higher in a consistent way while the o"cial trading sessions were rather flat
overall.

In fact, studies made by Sentiment Trader and others showed that 90 % of the
performance of the markets was due to these o!-market gaps driven by the futures
market as if someone was truly manipulating the market higher to take the shorts out
by gapping the daily trade up every day.

It is clearly much easier to push prices higher in thin overnight futures markets than
trying to force it up with the volumes of the normal sessions, but the technical e!ect
is actually exactly the same.
Who has been acting so forcefully and so consistently in the overnight market,
gradually reversing the sentiment from bearish to bullish and forcing major short
covering in the process?

This remains an open question.

More worryingly, as the market was rolling over, Last Friday’s job report from the US
Labor Department announced that the US economy had gained 2.5 million jobs in May
and that the unemployment rate came down from 14.5 5 to 13.7 % that month,
despite economists projecting 9 million job losses for the month and unemployment
rate at 19 %.

The markets shot up on Friday reversing the rolling over of stocks, to end the week
with the best positive performances in weeks.

The very same week, 1.88 million Americans filed for unemployment benefits and the
independent ADP job report counted 2.4 million job LOSSES for May, instead of the US
labor department 2.5 Million job gains.

Very strangely, the market reacted positively on the US Labor Dept report despite
footnotes that could not be more explicit, whereby the department revealed that its
accounting was wrong and had not accounted for 3.4 million job losses in the previous
month and THAT THEY DECIDED NOT TO TO CORRECT THEM because THEY DID NOT
WANT TO INTERFERE WITH THE US PRESIDENTIAL CAMPAIGN. All these elements have
been clearly highlighted in a FORBES article this week.

The US BLS is writing in its footnotes that if people had reported correctly, the
unemployment rate would have been 16.3% instead of 13.3%. To be fair, the BLS also
notes that this same misclassification happened for April and would have pushed up
the previous unemployment rate from 14.7% to 19.7%. In this scenario, unemployment
for May would have dipped by an even larger 3.4% than the reported 1.4% drop. But
the e!ect is the same, o"cially, we have never reached 19.7 % unemployment!
That does have a major political impact….

What this really says is that the US Administration is willingly cooking the numbers to
give the impression that the recovery is underway and stronger than analysts expect,
but that the hard facts are saying the opposite.

Even more worryingly, Jeremy POWELL, the Chairman of the FED nominated by Donald
Trump and who already saved him in December 2018, when stock markets were
collapsing following his trade war with China by reversing the course of US monetary
policy and re-starting quantitative buying, used this factually fake report from the US
Labor Department to tout the US job recovery in the FED communiqué after yesterday’s
monthly meeting.

How can a supposedly independent FED Chairman use a report that he knows and is
publicly admitted to being wrong to send a positive message that is blatantly
erroneous ?

The most commonly shared view in America’s financial circles is that the stock
market will not peak before the election and will then fall into a bear market.

Is there a situation where various tools are being used to prop up the market
until the elections to ensure that a “socialist” wave does not win the US
Presidential elections in November ?

What if the extra-ordinary behavior of equities did in fact truly
reflect the extraordinary macro-economic situation created by
COVID ?

One of the strangest thing in the market today is that there are actually very very few
analysts and commentators predicting a full-fledged bear market in equities while all
the lessons for history are that there cannot be a recession without a sharp decline in
earnings and without a significant bear market.

Our view is, and has been so way before COVID, that the US economy has actually
started its secular bear market in 2018, but that has been prevented to unfold by the
actions of the FED injecting liquidity recklessly, sending all asset classes higher in 2019
and again massively with the occurrence of COVID.

But even unlimited money creation and public debt creation cannot prevent the
earnings recession to take place and these measures are temporary in nature, and
capped by the risks of seeing a major loss of confidence in the currency, something
that may have actually started with the fall in the value of the US dollar in the past
few weeks.

What we are saying in essence, is that if we are truly in a bear
market, the extreme speed and volatility of the first two phases
could indicate that the next move down could be as fast, sharp and
even more devastating than the first ones, as sentiment and flows
turn sharply in reverse with massive losses and liquidations for all
these new-comer investors.

This sharp reversal could come from anything such as a resurgence
of COVID and lockdowns, a heightening of tensions between China
and the US, or even simply from sharply negative guidance by
CEOs for the remainder of the year and next year, or a major
financial institution going belly up as was the case with Lehman in
2008.

In such a scenario, the charts reproduced below give an indication
of how bad the next downdraft could be with targets at 2000 for
the SP500 and 7’000 or 5’000 on the NASDAQ
Ultimately, it is the unfolding of the coming correction that will call
the shots with equity markets either falling by 20 % or more, back
into the bear market territory or holding those levels and
rebounding, signaling that the bear market will only unfold after
the US elections.
Our message to our investors is simple :
       Mechelany
#      Advisors
                         HOME    RESEARCH $   MODEL PORTFOLIO   INVESTMENT IDEAS

At 10’000 on the NASDAQ, the risk-reward of
staying invested in US equities, and even foreign
                  WHO WE ARE MY ACCOUNT             $

markets, is the poorest we have ever seen.

Not taking this massive rebound as an opportunity
to lighten up considerably on equities amounts to
making an irrational decision.

We may probably look back at this crazy period
and wonder how we were blinded enough not to
take this unique opportunity to bail-out of
equities…

    DISCLAIMER

    Mechelany Advisors FZE or www.mechelanyadvisors.com, is not a registered
    investment advisor, nor a capital management firm or broker-dealer and
    does not purport to tell or suggest which securities customers should buy
    or sell for themselves.

    Mechelany Advisors FZE operates as a private advisory and research company
    where we
    provide consulting services to pension funds, investments funds and private clients

    Our analyses and conclusions are ours and they only clarify and highlight
    the investment rationale behind our own investment decisions. The analysts
and employees or affiliates of Company may - and usually do - hold
positions in the stocks or industries discussed here.
The Company, the authors, the publisher, and all affiliates of Company
assume no responsibility or liability for your trading and investment
results. You understand and acknowledge that there is a very high degree
of risk involved in trading securities.
It should not be assumed that the methods, techniques, or indicators
presented in these products will be profitable or that they will not
result in losses. Past results of any individual trader or trading system
published by Company are not indicative of future returns by that trader
or system, and are not indicative of future returns.
The indicators, strategies, columns, articles and all other features of
Company’s products are provided for informational and educational purposes
only and should not be construed as investment advice. Examples presented
on Company’s website are for educational purposes only. Such examples are
not solicitations of any order to buy or sell securities, commodities,
investment products or engage into any kind of trading activities.
Accordingly, you should not rely solely on the Information provided in
making any investment decision. Rather, you should use the Information
provided only as a starting point for doing additional independent
research in order to allow you to form your own opinion regarding
investments. You should always check with your licensed financial advisor
and tax advisor to determine the suitability of any investment.
By navigating on our website or remaining on our subscription lists, you
accept our terms and conditions and discharge us irrevocably form all
responsibility.
! SHARE " TWEET #
Related Topics
#EQUITY MARKETS #NASDAQ #US EQUITIESMechelany Advisors
$
MODEL PORTFOLIO, TRANSACTION UPDATE
Transaction Update 10 Jun
2020
JUNE 10, 2020 · MECHELANY ADVISORS
VIEW POST
%
Subscribe
Subscribe now to our newsletter
Enter your email SUBSCRIBE
BY CHECKING THIS BOX, YOU CONFIRM THAT YOU HAVE READ AND ARE AGREEING TO OUR TERMS OF USE
REGARDING THE STORAGE OF THE DATA SUBMITTED THROUGH THIS FORM.
&0 Comments Sort by Oldest
Add a comment...
Facebook Comments Plugin
LEAVE A REPLY
LOGGED IN AS JACQUES MECHELANY. LOG OUT?
COMMENT *
POST COMMENT
Did you know our Model
Portfolio was up +275 %
since 2014 ?
That's an average of
+23,51 % per annum for+23,51 % per annum for
the past 6.25 years
Subscribe to get all of our investment
ideas, research, analysis and weekly
market reviews, straight out of the oven !
FULL NAME*
Type your name
EMAIL*
Type your email
Submit
HISTORICAL PERFORMANCE MECHELANY
ADVISORS’ MODEL PORTFOLIO
MEMBERSHIPS
Mechelany Advisors Yearly
Membership
$1,299.00 $999.00
Mechelany Advisors 6-Months Membership
$699.00 $499.00
SEARCH FOR:SEARCH FOR: Enter Keyword SEARCH RECENT POSTS ! NASDAQ 10’000, We may have reached the top … June 11, 2020 Transaction Update 10 Jun 2020 June 10, 2020 Invest in 5G June 9, 2020 PULLING OUT OF RECESSION June 8, 2020 Model Portfolio 6 June 2020 June 6, 2020 Transaction Update 3 June 2020 June 3, 2020 MOST DANGEROUS PHASE AHEAD June 2, 2020 LESSONS FROM JAPAN June 1, 2020 Model Portfolio 30 May 2020 +9.12 % Year To Date May 30, 2020 Transaction Update 27 May 2020 May 27, 2020 CATEGORIES Select Category ARCHIVES
JUNE 2020

MAY 2020

APRIL 2020

MARCH 2020

FEBRUARY 2020

JANUARY 2020

DECEMBER 2019

NOVEMBER 2019

OCTOBER 2019

SEPTEMBER 2019

AUGUST 2019

JULY 2019

JUNE 2019

MAY 2019

APRIL 2019

MARCH 2019

FEBRUARY 2019

JANUARY 2019

DECEMBER 2018
NOVEMBER 2018

OCTOBER 2018

SEPTEMBER 2018

AUGUST 2018

JULY 2018

JUNE 2018

MAY 2018

APRIL 2018

MARCH 2018

FEBRUARY 2018

JANUARY 2018

DECEMBER 2017

NOVEMBER 2017

OCTOBER 2017

SEPTEMBER 2017

AUGUST 2017

JULY 2017

JUNE 2017

MAY 2017
APRIL 2017

MARCH 2017

FEBRUARY 2017

JANUARY 2017

DECEMBER 2016

NOVEMBER 2016

SEPTEMBER 2016

JULY 2016

JUNE 2016

APRIL 2016

FEBRUARY 2016

JANUARY 2016

                               Subscribe
                 Subscribe now to our newsletter

                 Enter your email                        SUBSCRIBE

                  BY CHECKING THIS BOX, YOU CONFIRM THAT YOU HAVE READ
                 AND ARE AGREEING TO OUR TERMS OF USE REGARDING THE
                                                             &
                  STORAGE OF THE DATA SUBMITTED THROUGH THIS FORM.
SITEMAP SOCIAL ACCOUNTS MEMBERSHIPS
HOME
! % & " Mechelany
Error Advisors 6-
MODEL PORTFOLIO Months
Membership
INVESTMENT IDEAS $699.00 $499.00
Mechelany
WHO WE ARE
Advisors
Yearly
TERMS & CONDITIONS
Membership
$1,299.00 $999.00
PRIVACY POLICY
MY ACCOUNT
LOG OUT
Mechelany Advisors
Financial Research & Investment IdeasYou can also read