NATURAL GAS PRICE OUTLOOK - August 24, 2021 - SpaceCraft
←
→
Page content transcription
If your browser does not render page correctly, please read the page content below
NATURAL GAS PRICE OUTLOOK

August 24, 2021

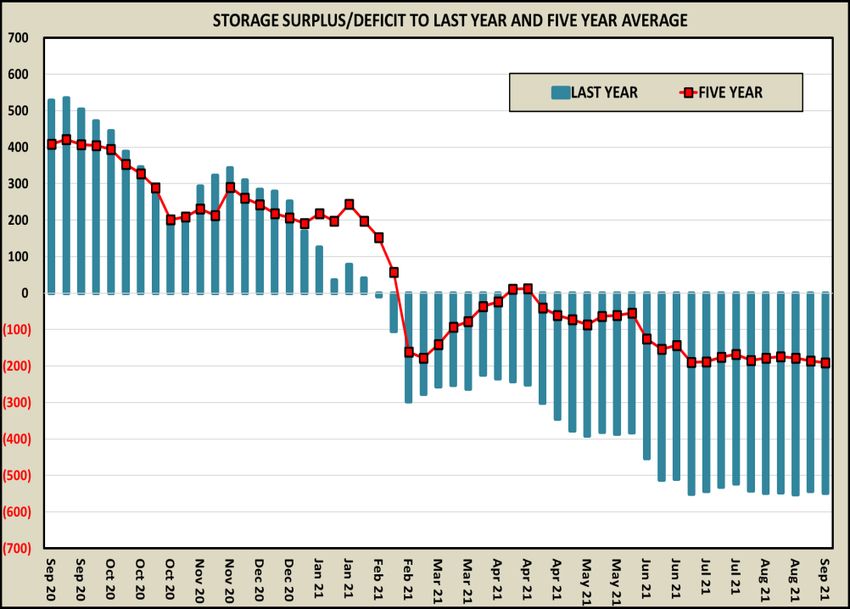
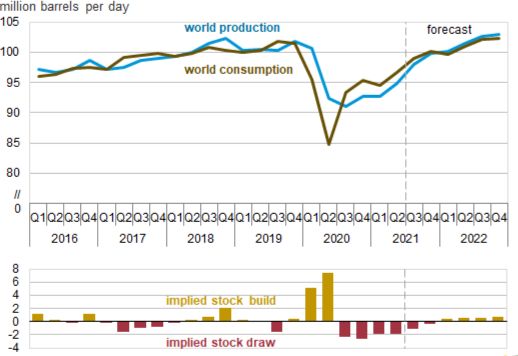
The EIA reported a weekly build of 46 bcf last week - well above
the 32-35 bcf range the market was expecting and such was 1 bcf
above the same week last year. However, 4 bcf of that injection
was a reclassification of base gas to working gas.

This brings total storage levels to 2,822 bcf for the week ended
August 13th and alters the deficits to last year and the five-year
average at 547 abd 174 bcf respectively.

The market is expecting a 40 bcf injection this week. And we
would expect the combined builds over the next three weeks to
total around 145 bcf. If valid, then this puts the respective deficits
at 548 and 191 bcf by the week ended September 3rd.

Note the bottom-right graph; both deficits have not significantly
changed since the end of June. Nonetheless, the market will
clearly enter the withdrawal season with low levels. We expect that
end-of-season levels on October 31st will be at around 3,550 bcf in
ground. This implies respective deficits of 374 and 162 bcf.
A few quick odd-lot data points(clockwise from top right); (i) NGL prices have
surged this year with oil and gas prices - further improving producer wellhead
netbacks, (ii) new well-spuds still lag pre-Covid 2019 levels - but are increasing
steadily, (iii) actual data shows wind construction costs heading lower but still
higher than (pre-tax credit) combined cycle natural gas construction costs at
$920ish/kwh - yet very little gas-fired will be built in the coming years with the
emphasis on “ESG”, (iv) the market still jumps higher on tropical threats to the
Gulf of Mexico - but a reminder that offshore production is now only 2% of total
U.S. production and acute demand destruction at landfall exceeds acute shut-
ins offshore, and (v) EIA is expecting U.S. LNG exports to be average 11.5ish
bcf/d next year - but we project lower by 2 to 3 bcf/d between Covid lockdowns
and Nord Stream 2 coming into Europe from Russia before year’s end.

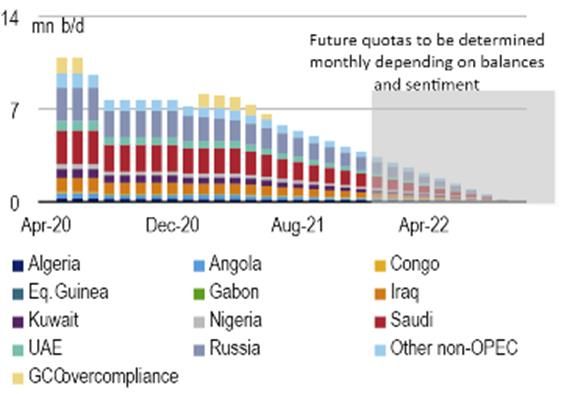
Crude oil is a mixed-bag presently with bullish and bearish fundamental factors offsetting each other and what is likely a lot of confused
traders on future price direction yielding choppy-sideways trade for a while. Bullish is the fact that global and U.S. inventories have fallen
significantly over the last year and that the announced OPEC+ production addition of 400k bbls/d each month through the end of the year
could be called off at any time if demand begins to falter. In that vein, the EIA and some private analysts are projecting a balanced
supply/demand equation as the market gets later into 3Q. And that forecast is not contemplating any additional demand loss via the newly
rising Covid cases globally. Gasoline demand in the U.S. (and global - not shown) has returned to pre-Covid levels the last few months but
U.S. and global jet fuel demand still has not recovered to prior levels. But both could plummet if the current Covid-variants continue to rise
and more lockdowns occur. Chinese fuel demand has already declined significantly in the last month.
Speaking of global energy demand for both oil and natural gas; two potential economic recession factors and commensurate demand-
killers are the high levels of inflation from all of the central-banks’ money printing and the expanding Covid cases and corresponding
limitations on economic activity. And both appear to be getting bad. It is doubtful that the current inflation wave is transitory as the
politicians and the Fed are both espousing. It is certainly not a given that demand begins to more so falter as both issues could be more
benign heading into the end of the year. But we wouldn’t want to bet on that. One thing that traders should always take into account is the
“velocity of acceleration” in any market. A trend is one thing, but charts starting go hyperbolic is seldom a good thing. And as one can see
in the graphs below - both Covid cases and inflation metrics have been and are accelerating rapidly now.
Prompt month WTI oil prices have fallen around $15 (high-to-low and before the bounce up this week) since the $76.98 high
was put in on July 6th. This deep selloff is due to a technical breakdown and renewed fears of demand reduction via the
renewed Covid issue. But it also has to do with the liquidation on long positions by the speculative Large Hedge Funds. The
sector’s net aggregate long position incurred a most recent peak of 526,161 NYMEX Contracts during the third week of June.
Since then, the Funds have reduced their position to 404,313 NYMEX Contracts net aggregate long as of August 17th. This
23% reduction in net length is fairly substantial over the period of those seven weeks. And as one can see from the graph
below, price direction for crude oil will generally always parallel whether the Large Hedge Funds are accumulating or
reducing long positions - more so than even than this speculative sector’s positioning in natural gas. Since the Large Hedge
Funds have been net long seemingly forever, the question is now whether the liquidation of their long positions is complete e
or is there more forced-liquidation to come?
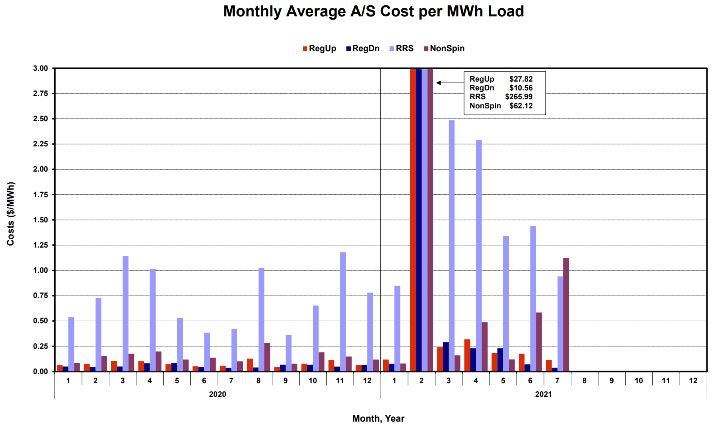
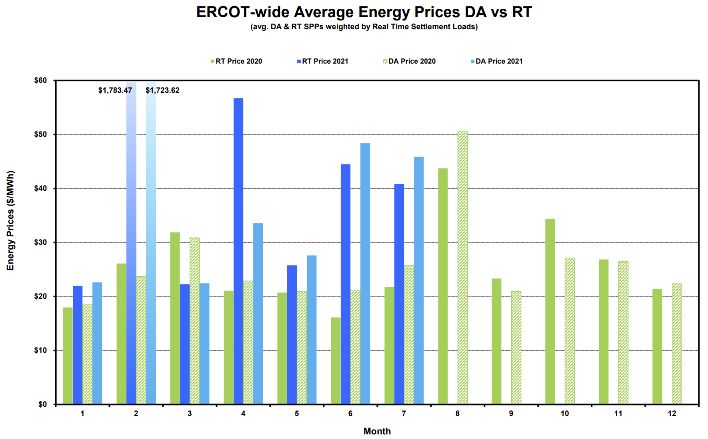
System-wide Real-Time prices averaged $40.82/mw in July and
compared to a Day-Ahead average of $45.88 for a DA-RT spread of
$5.06. This is similar to June when the Real-Time average was
$44.49 or $3.88 lower than the $48.37 Day-Ahead average.

Total ancillary prices in July were at an average of $2.21/mwh with
Non-Spin comprising $1.12 of it and RRS $0.94 - on a cost-to-serve
basis. Excluding the February debacle, total ancillary costs are
averaging $2.31 for 2021 - higher than any recent years. And as of
July 21st, ERCOT is now procuring 2,800ish mw of RRS and 4,000
- 4,500 mw of Non-Spin depending on the hour of the day. So
ancillary cost-to-serve will continue to range higher as a cost
component going forward with expanded procurement volumes.

June and July were overall low demand months with all of the
multi-day rains across the state. But wind-avails plummeted as
well due to the rain-events. The DA-RT prices would have been
much lower if not for the low wind - despite the higher fuel costs
via natural gas’ rally beginning in early June.
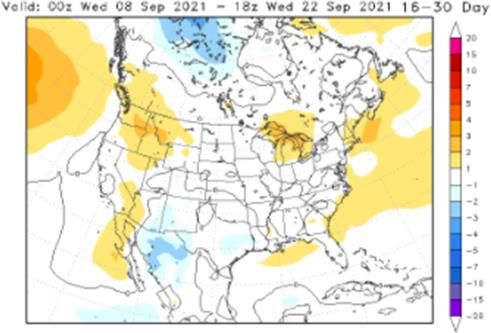
Summer 2021 is winding down with only the residual cooling demand left in the
southern U.S. in September (power-gen demand typically drops 5 bcf/d from
August to September). Total CDD has averaged 1.2 degrees above normal and
0.3 below last year - although the AGA is a week behind reporting CDD. But as
seen below in absolute terms, (not on a population-weighted basis), average
combined June and July temps were the hottest of the last thirty years nationally
(lower CDD because hotter temps were in less-populated western states). The
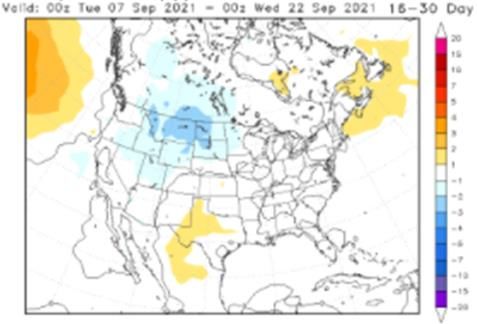
CFS and Euro models respectively below show no extreme above normal threats
through mid-September. CDD NORMAL CDD 2020 CDD 2021
JUN 37 46 37
JUN 43 59 68
JUN 50 37 64
JUN 58 68 59
JUL 65 75 80
JUL 70 90 76
JUL 73 87 79
JUL 75 94 74
JUL 75 91 85
AUG 73 73 64
AUG 70 85 93
AUG 65 71
AUG 57 87
TOTALS 811 963 779
CUM-TO-DATE 689 805 779
CDD DELTA NA 116 90
# OF DAYS NA 77 77
AVERAGE CDD DELTA NA 1.5 1.2
CDD 2021 CDD NORMAL CDD 2020
110
100
90
80
70
60
50
40
30
20
JUN JUN JUN JUN JUL JUL JUL JUL JUL AUG AUG AUG AUGYou can also read