October 2018 - Pendal Group
←
→
Page content transcription
If your browser does not render page correctly, please read the page content below

October 2018

Rates                                                                                 Tim Hext
                                                                                   Portfolio Manager

                The Australian bond market remains bogged down in the current Macro Mire. This is not
                saying things aren’t looking good for the Australian economy. Jobs growth is
                respectable, the unemployment rate is edging lower and inflation is well contained
                around 2%. However for every step forward there is a step back. Commodity prices are
                strong but trade fears dominate. Business investment is picking up but housing is turning
                down. Wages are finally edging higher but inflation is stalling. No wonder the RBA when
                assessing the economy end up deciding its best to do nothing.

                At times like this, two years of no cash rate changes and the market suggesting another
                two years to go, fixed interest managers can be forgiven for pondering why they didn’t
                choose equities all those years ago. However, with plenty going on globally I suspect
                there are far more X factors in play in Australia than markets are considering. With
                volatility at extremely low levels it pays to think about how to express your risk budget to
                limit downside if the market remain stuck in the mire, but reap rich rewards if the X
                factors come into play. After all, I remember attending a presentation in February 2007,
                shortly before the US sub-prime crisis, telling me to sell volatility because markets were
                going nowhere slowly.

Global Issues   We have written extensively in recent monthly newsletters about the increasing tensions
                between China and the US. We view these as structural in nature and highly likely to
                worsen than get better. Two economic superpowers of very different structures have
                emerging conflicting interests, particularly when it comes to being the dominant power in
                the region. For numerous Asian countries like Australia, where we look to China for the
                economy and the US for defence, it brings up interesting questions. As an Australian
                investment manager the primary near term question is what do these recent
                developments mean for our economy?

                Australia has been a massive beneficiary of globalisation. The numbers relating to China
                are well known – one third of our exports go there, 1.5 million Chinese visit here every
                year, 200,000 Chinese are studying here and over 1 million Australians have Chinese
                heritage. Resources and people are the backbone of the relationship.

                However, as the relationship between China and the US breaks down Asian countries
                are being asked to take sides. Of course it is not as blatant as “you are for us or against
                us” but even an acknowledgement of US concerns around China’s behaviours, whether
                military, trade, patents, interference in domestic policy or even cybersecurity, brings a
                response from China. Banning of official visits, exports held up in ports and even student

Page 2
visas delayed have been the warning shots from China across the bow this year. Of
          course they have much bigger guns in their arsenal as South Korea discovered in 2017
          when they banned tourist groups from visiting the country.

          Our central case is that the US will bring in 25% tariffs and China will continue to mildly
          stimulate their economy to offset the impacts. This will help keep commodity prices
          strong but the focus of the stimulus will be broader than just fixed asset investment, so
          the impact on volumes and prices will be significantly less than the 2009 and 2016
          episodes of stimulus. However the tail risks of a larger breakdown between China and
          Australia are rising and keeping both the US and China happy in 2019 will be a much
          harder task, likely to be shouldered by Bill Shorten and Penny Wong after the
          next election.

          There will be a raft of other issues a new government would inherit, issues the RBA will
          also be assessing closely. We have written at length about several of these, including
          inflation and wages in recent newsletters. This quarter we will focus on another area that
          has garnered increased attention more recently – the domestic housing market. More
          specifically we will examine changes currently underway and potential impacts of a
          federal Labor government. We also will look into its ultimate effect on the Australian
          economy.

Housing   The script gaining popularity this year is that Australia’s housing bust is finally coming.
          From 2013 to 2017 foreign buyers and local investors pushed up prices to levels that
          were unaffordable for local owner occupiers but very profitable for developers, spurring
          on supply which only now is hitting the market. Government policy meanwhile has put
          the screws on foreigners and investors meaning there is a long way to fall before new
          buyers step up. Throw in a Labor government ban on negative gearing outside of new
          developments (see discussion in the next section) and we will be back to 2015 prices
          soon, sending new investors into negative equity. Of more concern though price falls will
          make some new building unprofitable, causing a sharp fall in developments.

          This script has a lot going for it. Mind you many people, particularly offshore funds, have
          been calling the death of Australian property since 2009. So we need to look at the
          structure of housing and the data.

          Housing as a consumption good

          There are two ways to look at housing, Firstly, housing as a consumption good - you
          need somewhere to live whether you rent or own. In this regard property yields should be
          treated much like any other fixed income asset. In Sydney the average unit price is
          $720,000 and the average unit rent is $530. Once costs are factored of around $130 a
          week (strata, rates, fees etc), current yields on property are around 2.8%, so about the
          same as a term deposit. However this is below the cost of borrowing. With little change
          in rents likely and new supply now largely meeting new demand, there is little reason to
          see this change for a while. With interest rates near all-time lows house price
          movements are unlikely to be driven from the income side. That is, property yields are
          unlikely to rise because of increased cash flow. Therefore if a yield rise is needed it must
          come via lower prices.

Page 3
Housing as an investment good

                            Most Australians will aspire to become owner occupiers because of the need for
                            somewhere to live. Throw in housing as a tax free store of wealth it is considered 'as
                            safe as houses’. For owner occupiers housing is therefore a consumption good and an
                            investment good. However once you become a property investor you are buying it solely
                            as an investment good. Australia has around 2 million individuals who own around 2.6
                            million investment properties (27% of all housing stock). Significantly over half of all units
                            are owned by investors, with almost 60% in Victoria.

                            Like any investment good the after tax returns need to reflect the cost of capital plus a
                            risk premium. Chart 1 shows the total return index of bonds, equites and housing. They
                            all assume no leverage and reinvestment of all net income, more difficult to achieve in
                            housing than bonds or equities. With housing we look at Australia-wide prices and rents.

                            Property types will argue their asset is less volatile and therefore more attractive, whilst
                            equity types will highlight liquidity, low transaction costs and no maintenance. For
                            simplicity we will ignore these issues.

Chart 1.                    400
Total return index
                            350
comparison (Australia)
                            300

                            250

                            200

                            150

     House TRI              100
     Stock TRI
                             50
     Bond TRI
                              0
Source: Bloomberg, Pendal      2003             2006              2009              2012              2015              2018

                            Starting points always have an impact, but importantly since the GFC housing and
                            equities have moved largely in lockstep. Low interest rates benefitted all asset classes
                            (except cash) but the combination of low interest rates, solid growth and a rising
                            population has been a massive boom for risk assets, with both equity and property
                            having an average total return over the last decade of around 10% pa. The risk free
                            asset, government bonds, returned around 5% over the same period, meaning a risk
                            premium for property and equity of around 5%.

                            Assuming no change to the current tax code and no change to the risk premium,
                            financial theory would suggest the total return on equity and property in the decade
                            ahead would continue at the risk free rate plus 5%. Using current 10 year government
                            bonds, the risk free rate is now closer to 3%, so property total returns should be more
                            like 8% (or 5% price growth and net 3% rental yield).

Page 4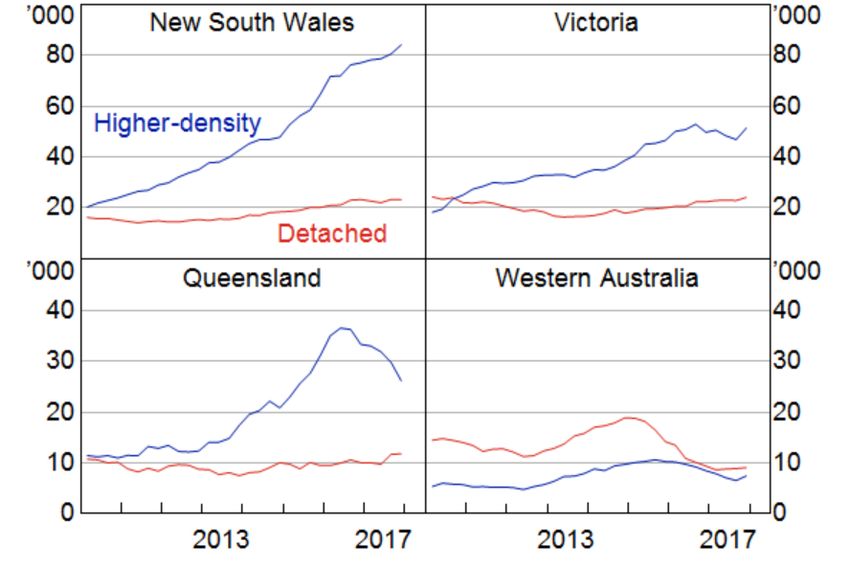
Tax changes                        Over 60% of property investors are negatively geared, claiming a total of $3 billion in tax
                                   losses in recent years. This has fallen over the past decade as interest rates have come
                                   down, after peaking at $8.4 billion in total losses in 2011/12. As Chart 2 (borrowed from
                                   the RBA) shows the proportion of negatively geared investors has declined in recent
                                   years after pushing up through the last decade. In fact if interest rates fell much further
                                   negative gearing could almost disappear without any policy change.

Chart 2.
Property investor
breakdown

*Dot indicates estimate from the
2013/14 data accounting for
likely revisions
Source: RBA, ATO

                                   However, we do need to factor in the impact of the Labor party’s proposed tax changes -
                                   a lower CGT discount and no negative gearing against wage income. These apply to all
                                   investments, including both property and shares, but it is property where there is the
                                   most leverage and current use of negative gearing. Of course existing investors will be
                                   grandfathered, but importantly it is new buyers who set the prices on property. Also,
                                   whilst new builds will still be able to negative gear against wages, buyers will have to
                                   factor in that when they eventually sell, the new purchasers will not be able to negative
                                   gear and hence should pay less.

                                   To examine the potential impact, let’s look at the average 2 bedroom Sydney apartment.
                                   Again we ignore transaction costs as this is a long term analysis, but we will also ignore
                                   depreciation benefits. Also we assume an investment loan of 80% LVR and interest only.
                                   On average after recent APRA changes less than 60% of new investor loans are interest
                                   only. Finally, we ignore the opportunity cost of the 20% equity (deposit). We are largely
                                   concerned with changes to returns.

                                   Price:                               $720,000

                                   Loan (80% LVR)                       $576,000

                                   Rent:                                     $530

                                   After costs:                              $400

                                   Mortgage rate (I/O):                       5%

                                   Interest costs:                           $553

                                   Annual Loss                            -$7,956

                                   Tax benefit (45% marginal)              $3,581

                                   After tax loss                         -$4,375

Page 5
Let’s assume the $4,375 after tax loss is considered as acceptable to new investors (or as
an economist might say, markets are efficient). Therefore if negative gearing is abolished,
to maintain a $4,375 loss (or recoup the $3,581 tax benefit that disappears) one of three
things must happen:
1. The rent goes up by $70 a week
2. The mortgage rate falls to 4.38% (or $70 a week)
3. The purchase price falls to $630,000
New apartment supply means rents are unlikely to have any significant rises for some
time and certainly not a 13.2% rise any time soon. Mortgage rates could fall by 62bp, but
APRA and the RBA at this point in time have shown a reluctance to make investor interest
only finance cheaper. Option 3, a 12.5% fall in apartment values, would therefore need to
happen.
Of course in reality property is not a simple investment yield game, with sentiment,
supply/demand and owner occupiers all hugely important. Labor’s policy changes are
effectively like a 62bp rate hike for investors and prices generally do not move by 12.5%
when those happen. The main factor that would soften house price falls is that owner
occupiers are not affected by the policy change so lower prices would see their share of
purchases rise, particularly amongst first home buyers. However, under Labor if the
negative gearing changes were to pass through parliament (the Senate may prove
recalcitrant) it would definitely escalate the current softening in house prices. Our estimate
is it will be worth around 5% and will impact apartments more than houses. When this
policy was taken to the 2016 election lower prices were seen as good policy, as they were
rising steeply at the time. 2019 will be a very different backdrop, but Labor seems
determined to introduce the changes.
As a sanity check we looked at the RBA paper “Negative Gearing and Welfare: A
Quantitative Study for the Australian Housing Market” November 2017. In a far more
detailed and mathematically elegant model they concluded removing negative gearing
was worth around 2% to home values as 9% of homes move from investors to owner
occupiers, which would also slightly push up rents. Also the supply response would limit
falls which would be around our figure of 5% otherwise. Importantly they showed an
overall increase in welfare of 1.5% for the Australian economy and 76% of households
were better off. So Labor should have the backing of the majority but this is politics 2018
style and the worse off minority, particularly the property industry, has the money and
noise to drown out the majority.
The RBA and The RBA faces two issues around falling house prices – the wealth effect on consumption
housing and confidence, and the more direct impact on construction activity. The first issue is
difficult to quantify but so far the signs are good. Despite the concerns of many,
consumption growth remains around 3% despite house price falls nationally of 3% over
the last year. Perhaps consumers are encouraged by incomes finally showing growth
above 2%. Also household net wealth has increased by almost 7% annually since 2012 so
there is a large buffer.
For construction activity, 2019 will still see healthy levels as the pipeline from strong
higher density approvals the last few years are worked through. However the RBA will
watch approvals closely in 2019. Whilst residential investment is only around 5% of GDP,
construction overall is 9% of GDP and employment, although this includes the booming
Page 6public and non-residential construction sectors. Housing also feeds into a wider range of
sectors with links to housing activity, such as retail and wholesale.
Chart 3 shows that the boom of the last decade has been solely in high density, doubling
from 5,000 a month to 10,000. This is the sector that is taking the largest hit at the
moment. In fact detached homes approvals have been remarkably steady around
10,000 a month for the last 5 years.
Chart 3. 25,000
Australia building
approvals (3m avg.)
20,000
15,000
10,000
Total
5,000
Detached Houses
High-Density Housing
0
Source: ABS 1990 1995 2000 2005 2010 2015
Annual approvals are falling towards 200,000 from above 250,000 at the peak as Sydney
and Melbourne see sharp falls in higher density, similar to what happened in Brisbane.
This will be negative for growth beyond 2019 but approvals of 15,000 are still at
reasonable levels on a long term basis. Remember the population has increased on
average just under 400,000 a year this decade. At 2.5 people per household that means
160,000 new houses a year are needed. Once rebuilds are included we need over
200,000 approvals each year. Of course too many years of underbuilding as the
population keeps growing by 1.5% every year will see the cycle begin all over again.
Chart 4, also borrowed from the RBA, shows that in Sydney and to a lesser extent
Melbourne, high density will become the focus next year. Perth has already been
through their major correction and Brisbane has seen most of its adjustment, although it
may fall a little further. Importantly, given high building costs and falling prices
developers will be reluctant to begin large developments given the background of
uncertainty.
Chart 4.
Residential
dwelling pipeline
*includes dwellings approved but
not yet commenced and private
dwellings under construction
Source: RBA, ABS
Page 7Conclusion Overall we believe there is too much complacency over the impact of housing in 2019
but that the weakness will be offset elsewhere by better wage outcomes and
unemployment dipping below 5%. Housing is likely to be off 10% from the peak by mid-
2019, 5% is already happening and the other 5% is likely if Labor wins government and
gets its changes through. Sydney and Melbourne will see higher falls as other capital
cities stabilise, having already seen these falls. Whilst aggressive investors may be
impacted, overall housing will be a step back in the Australian economy’s “one step
forward, one step back” experience of recent times. Unemployment falling through 5%
will catch the RBA’s attention, but Governor Lowe should be able to rest easy for
another year.
Page 8George Bishay
Portfolio Manager
Credit
In our first quarter update, we discussed our reasons for shifting to a neutral stance on
credit, from a bullish one. We have now returned to a more constructive bias to the asset
class as markets have shown an increasing resilience to macro risk factors such as
geopolitical risks and central bank normalisation in addition to more attractive credit
spread valuations.
Regarding geopolitical risks, we witnessed a number of developments that caused
concern for investors and weighed on credit earlier in the year. An escalation of trade
wars between the US and the rest of the world was one such development. While the
Sino-US trade war continues, there has been recognition that the impact on the broader
Chinese economy is more likely to be felt over the medium term, rather than posing a
near-term risk.
Others cases of geopolitical concerns have included political upsets in Italy and several
emerging markets, which in turn caused a significant spike in their sovereign yields over
the year. Such flare-ups in political risk are difficult to predict, however what is becoming
more apparent is that risk assets have become less sensitive to political news, including
the latest tweets from President Trump.
Investor sentiment has also become more sanguine towards monetary stimulus
withdrawal in recent months. Fears over the impact of Fed hikes and balance sheet
reduction, as well as similar normalisation from its global peers, have subsided to a
degree. This follows growing recognition that policy changes will be gradual and in
response to improving fundamentals. Worries over more aggressive tightening have
also faded as inflation has not increased dramatically.
From a micro standpoint, corporate fundamentals continue to paint a positive picture.
Balance sheets are healthy, earnings growth has been solid and high yield default rates
have been low. Moreover, valuations are more attractive after spreads widened through
the first half of the year.
A more constructive bias has also been reflected in our quantitative credit models as
illustrated in Chart 5 below. This signal is produced by combining a number of economic
and market inputs. The change that occurred recently was triggered by a switch in a
fundamental indicator related to business conditions. Other signals also suggest a more
constructive outlook, particularly near-term seasonality.
Page 9Chart 5. 90 1.0
Our credit models have
Bearish Credit
turned more constructive 85
80
75
iTraxx
Signal
70 0.0
65
60
Total Signal
Bullish Credit
iTraxx 55
50 -1.0
Source: Bloomberg Jan-2018 Mar-2018 Jun-2018 Sep-2018
Overall, we remain cognisant of the macro risk factors in credit markets. Geopolitical
uncertainties may continue to emanate from trade wars as well as emerging markets.
Central banks are also likely to remain on the path towards normalisation. However, at
the same time risk appetite has become much less sensitive to these developments.
Combined with a positive fundamental backdrop, we believe a more constructive near-
term outlook for investment grade credit is warranted.
Page 10Cash Steve Campbell
Portfolio Manager
The market was prepared for more fireworks in the September quarter following the
recent moves in quarter end in BBSW. It was also financial year end for three of the
major banks, which was more likely to pressure BBSW to move higher in yield. Chart 6
shows the monthly move in 6 month BBSW for each March/June/September/December
for the past 5 years.
Chart 6. 0.3
BBSW monthly changes 0.2
at quarter end
0.2
0.1
Chg.
0.1
0.0
-0.1
-0.1
-0.2
Nov-2014
Nov-2013
Nov-2015
Nov-2016
Nov-2017
Aug-2013
Aug-2014
Aug-2015
Aug-2016
Aug-2017
Feb-2013
Feb-2014
Feb-2015
Feb-2016
Feb-2017
Feb-2018
May-2013
May-2014
May-2015
May-2016
May-2017
May-2018
Source: Bloomberg
We can see that with the exception of March 2015 (further monetary policy easing was
expected at the April meeting) 6 month BBSW has increased in the last month of each
quarter. Consequently most in the market were wary of extending further out the yield
curve given the likelihood of higher yields.
The end result? A big fat doughnut and much disappointment is the best way to describe
the moves in the month of September. The net change in 3 and 6 month BBSW from the
end of August to the end of September - zip, zero, zilch, unchanged. BBSW actually fell
during September before increasing slightly towards the end of the month. That is not to
say however that there were not funding stresses within the Australian market. Chart 7
illustrates the repo rate for tenors less than 30 days against 1 month BBSW.
Page 11Chart 7. 2.3 1 month BBSW and
Edwina Matthew
                                                                                                                Head of
ESG                                                                                                      Responsible Investments

                                           During the quarter our ESG portfolios purchased a new sustainability issue from
                                           Macquarie University. The education provider raised $200 million via a 10 year
                                           sustainability bond and became the second tertiary institution to do so in Australia. It
                                           joined Australian Catholic University (ACU), who issued Australia’s first sustainability
                                           bond in July 2017 with the same maturity and for the same amount. The issuance marks
                                           continued strong growth in what we categorise as Environmental, Social and Governance
                                           (ESG) thematic fixed interest assets more broadly. This is reflected in the large increase
                                           in the subset of green bonds as illustrated in Chart 8. In this quarter’s update, we examine
                                           this trend and explain some of the more important concepts and classifications in the area.

Chart 8.                                   3,500
Growth in green bond
issuance in Australia                      3,000
                        Issue Size (A$M)

                                           2,500

                                           2,000

                                           1,500

                                           1,000

                                            500

                                              0
Source: CBI                                        2010      2011     2012     2013      2014     2015     2016      2017     2018

Going “green”                              The strong growth in responsible investment assets (which includes strategies that
                                           invest in ESG thematic fixed interest securities) over the past decade, particularly the
                                           past 5 years, is indicative of increased demand from investors. This has taken place as
                                           they grow increasingly conscious of how their investments impact the environment and
                                           society. It is also occurring at all levels of the investment management chain, including
                                           fund managers, institutional consultants, wholesale advisors and end clients. Last year,
                                           the Responsible Investing Association of Australasia (RIAA) surveyed over 1,000
                                           Australians 18 years or over and found that 63% expect advisors to consider the impact
                                           of their investments on society and the environment. A further 93% expect their super
                                           and other investments to be invested responsibly and ethically.
Page 13
With the area’s growing importance and rising issuance, it is worth delving deeper into
ESG thematic fixed interest assets and distinguishing between different types of
securities. There are several independent organisations that offer clarification on
classifications. One such group is the International Capital Markets Association (ICMA)
that maintains a set of principles that can be used to categorise and ensure qualification
as an ESG bond. These are then used by organisations such as the Climate Bonds
Initiative (CBI) to provide certification to issuers. The classifications are divided into
three broad categories that include; green, social and sustainability. We have
summarised each briefly in Chart 9 below, before discussing each in more detail.
Chart 9.
ESG thematic bond
classifications
Green Sustainability Social
Environmental Improve
benefits Green + Social social issues
Green bonds These are where the issuer uses proceeds from the bond
towards projects, or financing projects, that benefit the
environment. There are four components assessed by the
ICMA in order to determine whether an issue qualifies as a
green bond. These include the use of proceeds, process
for project evaluation, management of proceeds and
reporting. Typical projects include renewable energy,
energy efficiency, pollution prevention, clean transportation
and production technologies among others.
Green bonds have been the predominant type of ESG
thematic fixed interest issuance in Australia with issues
conducted by a variety of organisations, including the
major banks as well as the Victorian and Queensland state
governments. Queensland Treasury Corp detailed the use
of its issuance proceeds in its most recent Sustainability
Report, which include the expansion of bike lanes through
the state, the build-out of the Gold Coast light rail system
and the development of rail to Moreton Bay. These fall
under the transport infrastructure criteria of issuance. Our
Source: Queensland Treasury responsible investment funds have purchased several of
the aforementioned green bonds and combined the
exposure makes up more than 10% of the Sustainable
Australian Fixed Interest Fund.
Page 14Social bonds Social bonds are when the proceeds are used to address social issues or improve a
social outcome for a targeted population. General examples that would qualify include
the provision of affordable basic infrastructure, access to essential services, affordable
housing, food security and as well as improving education. Their issuance in Australia is
less common than their green bond counterpart. Our responsible investment portfolios
have purchased social bond issues from NAB and IFC (the World Bank’s financing arm).
The former was targeted specifically at improving gender quality by financing
organisations classed as preferred equal opportunity workplaces for women.
Sustainability bonds Finally, the sustainability bonds
category includes issues where
proceeds are used for a combination
of both green and social purposes.
This includes the previously
mentioned Macquarie University and
ACU sustainability bonds. Proceeds
for each have been flagged for the
development of highly-rated green
buildings that will be used to advance
education standards. As such, they
tick both the green and social boxes.
More specifically, ACU has outlined its
plans for a new environmentally
friendly 6 Green Star rated building for
education purposes, as pictured
opposite.
Source: ACU
Certification As noted earlier, independent organisations like ICMA and CBI maintain a set of criteria
standards used to evaluate whether a bond qualifies as green, social or sustainability. Importantly,
this typically requires verification of the issue before launch by a third party auditor, as
well as ongoing monitoring and reporting of the use of the proceeds on an annual basis
(at minimum). This monitoring process is critical in ensuring credibility throughout the
process and that the proceeds remain used for ESG purposes. To enhance this
credibility, the CBI offers a certification standard that is noted in the bond’s initial capital
raising details and ongoing reports.
It is also worth noting that ESG thematic bonds and the criteria used by independent
bodies are also typically aligned to the UN’s Sustainable Development Goals (SDG).
These were established in 2015 and include 17 goals as pictured in Chart 10. Several of
the goals can apply to a single green, social or sustainability bond. The Macquarie
University sustainability bond for example cited alignment with quality education, decent
work and economic growth as well as sustainable cities and communities.
Page 15Chart 10.
UN Sustainable
Development Goals
Source: UN
Looking ahead In the next quarter we expect NSW Treasury Corporation to issue its first green bond
bringing it to three states now in this market. With the strong growth in issuance and
increasing demand for ESG thematic bonds, the importance of understanding and
distinguishing between them has also risen. We hope this quarter’s piece has offered
greater clarity for clients on the range of classifications, the criteria used for assessment
and the ongoing monitoring process. As the area continues to evolve we will also
enhance and adapt our analysis of ESG thematic bonds to deliver the best outcomes for
our clients.
For more information call us on 1800 813 886
or visit pendalgroup.com
The information in this brochure is current as at 17 October 2018 and has been prepared by Pendal Institutional Limited ABN 17 126 390 627, AFSL
No 316455 (PIL, Pendal). It is not to be published, or otherwise made available to any person other than the party to whom it is provided. Prior to
May 2018, Pendal Institutional Limited was known as BT Investment Management (Institutional) Limited. This brochure is for general information
purposes only, should not be considered as a comprehensive statement on any matter and should not be relied upon as such. It has been prepared
without taking into account any recipient’s personal objectives, financial situation or needs. Because of this, recipients should, before acting on this
information, consider its appropriateness having regard to their individual objectives, financial situation and needs. This information is not to be
regarded as a securities recommendation.
The information in this brochure contains material provided by third parties, is given in good faith and has been derived from sources believed to be
accurate as at its issue date. While such material is published with necessary permission, and while all reasonable care has been taken to ensure
that the information in this brochure is complete and correct, to the maximum extent permitted by law neither PIL nor any company in the Pendal
group accepts any responsibility or liability for the accuracy or completeness of this information.
Performance figures are calculated in accordance with the Financial Services Council (FSC) standards. Performance data (post-fee) assumes
reinvestment of distributions and is calculated using exit prices, net of management costs. Performance data (pre-fee) is calculated by adding back
management costs to the post-fee performance. Past performance is not a reliable indicator of future performance.
Page 16You can also read