Offshore Wind in Europe - Key trends and statistics 2020 - IG Windkraft
←
→
Page content transcription
If your browser does not render page correctly, please read the page content below
Offshore Wind
     in Europe
 Key trends and statistics 2020
Offshore Wind
  in Europe
Key trends and statistics 2020
      Published in February 2021

        windeurope.org
This report summarises construction and financing activity in
European offshore wind farms from 1 January to 31 December
2020.

WindEurope regularly surveys the industry to determine
the level of installations of foundations and turbines, and
the subsequent dispatch of first power to the grid. The data
includes demonstration sites and factors in decommissioning
where it has occurred. Annual installations are expressed
in gross figures while cumulative capacity represents net
installations per site and country. Rounding of figures is at the
discretion of the author.

DISCLAIMER
This publication contains information collected on a regular
basis throughout the year and then verified with relevant
members of the industry ahead of publication. Neither
WindEurope nor its members, nor their related entities are,
by means of this publication, rendering professional advice
or services. Neither WindEurope nor its members shall be
responsible for any loss whatsoever sustained by any person
who relies on this publication.

TEXT AND ANALYSIS:
Lizet Ramírez, WindEurope
Daniel Fraile, WindEurope
Guy Brindley, WindEurope

EDITOR:
Rory O’Sullivan, WindEurope
DESIGN:
Laia Miró, WindEurope
Lin Van de Velde, Drukvorm
FINANCE DATA:
Clean Energy Pipeline and IJ Global
All currency conversions made at EUR/ GBP 0.8897 and EUR/USD 1.1422.
Figures include estimates for undisclosed values.
PHOTO COVER:
Kriegers Flak substation, Courtesy of Van Oord.
MORE INFORMATION:
policy@windeurope.org
+32 2 213 11 68
EXECUTIVE SUMMARY......................................................................................................6
CONTENTS

           1. OFFSHORE WIND INSTALLATIONS.............................................................................9

                1.1 OVERVIEW.......................................................................................................................9
                1.1 NATIONAL BREAKDOWN OF 2020 INSTALLATIONS..................................11
                1.2 CUMULATIVE INSTALLATIONS...............................................................................14

           2. TRENDS: TURBINE SIZE AND WIND FARM LOCATION.....................................16

                2.1 WIND TURBINE RATED CAPACITY.......................................................................16
                2.2 WIND FARM SIZE..........................................................................................................17
                2.3 WATER DEPTH AND DISTANCE TO SHORE.....................................................19
                2.4 FLOATING WIND............................................................................................................20

           3. INDUSTRY ACTIVITY AND SUPPLY CHAIN..............................................................23

                3.1 WIND TURBINE MANUFACTURERS.....................................................................23
                3.2 WIND FARM OWNERS...............................................................................................25
                3.3 SUBSTRUCTURES AND FOUNDATIONS............................................................26
                3.4 CABLES.............................................................................................................................29
                3.5 VESSELS...........................................................................................................................30

           4. INVESTMENTS AND POLICY DEVELOPMENTS.....................................................32

                4.1 FINANCING ACTIVITY.................................................................................................32
                4.2 OFFSHORE PPAs..........................................................................................................34
                4.3 AUCTION RESULTS......................................................................................................34
                4.4 	POLICY DEVELOPMENTS AND OUTLOOK........................................................35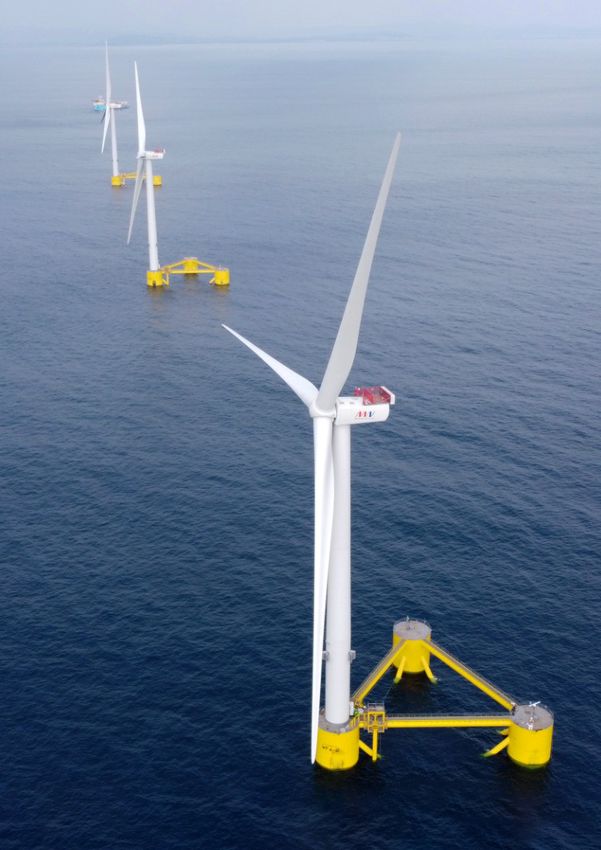
EXECUTIVE
    SUMMARY
    Europe added 2.9 GW of offshore capacity during 2020.                            Europe now has a total installed offshore wind capacity of
    That’s 356 new offshore wind turbines connected to the                           25 GW. That corresponds to 5,402 grid-connected wind tur-
    grid, across nine wind farms.                                                    bines across 12 countries.

    FIGURE A
    Annual offshore wind installations by country (left axis) and cumulative capacity (right axis) (GW)

                                     5.0                                                                                              30

                                                                                                                                           Cumulative Installed Capacity (GW)
    Annual Installed Capacity (GW)

                                     4.5
                                                                                                                                      25
                                     4.0
                                     3.5
                                                                                                                                      20
                                     3.0
                                     2.5                                                                                              15
                                     2.0
                                                                                                                                      10
                                     1.5
                                     1.0
                                                                                                                                      5
                                     0.5
                                      0                                                                                               0
                                           2010   2011   2012   2013     2014    2015    2016     2017     2018     2019     2020

                                            UK           Germany        Denmark         Belgium          Netherlands          Sweden
                                            Finland      Portugal       Spain           Ireland          France
                                                                       Cumulative installed capacity
                                                                                                                          Source: WindEurope

    Eight new offshore wind projects reached Final Decision                          ments in new assets accounted for €26.3bn in order to
    Investment (FID) in four different countries during 2020,                        finance 7.1 GW of additional capacity.
    with construction due to start in the coming years. Invest-

6   Offshore Wind in Europe - Key trends and statistics 2020
    WindEurope
Executive Summary
Installations in 2020 Trends: turbine and wind farm size, depth, distance
from shore, auctions
• Europe added 2,918 MW of new capacity. The
Netherlands (1,493 MW), Belgium (706 MW), the UK • The average rated capacity of turbines installed in
(483 MW), Germany (219 MW) and Portugal (17 MW) 2020 was 8.2 MW, with two-thirds of the wind farms
supplied this new capacity to the grid. with offshore works in 2020 using turbines larger
than this.
• The European grid saw 356 offshore wind turbines
connected across nine wind farms in 2020. • The average size of wind farms was 788 MW, 26%
larger than last year.
• Europe saw nine new wind farms completed (grid-
connected). One has partial grid connection and will • The average distance to shore was 52 km and the
be fully commissioned in 2021. Construction work water depth 44 m.
started on six other wind farms where no turbines
have yet been grid-connected. • The Hollandse Kust Noord V was the only auction this
year – a consortium of Shell New Energies and Eneco
• Siemens Gamesa Renewable Energy connected 63% won.
of new turbines to the grid. Vestas Wind Systems
connected 34%, while the remaining 3% were • GE Renewable Energy received the largest order for
Senvion turbines. wind turbines, from SSE and Equinor for the Dogger
Bank (A and B) in the UK. The project will feature
190 GE Haliade-X 13 MW turbines.
Financing highlights
• Europe saw a financing record of €26.3bn for new Cumulative installations
projects - 7.1 GW of new capacity in France, the
Netherlands, Germany and the UK. • There are 5,402 turbines connected to the grid,
totalling 25,014 MW.
• The two largest wind farms - Hollandse Kust Zuid
1-4 (1.5 GW) and Dogger Bank A and B (2.4 GW) - • There are now 116 offshore wind farms in 12
together raised over €15bn in capital. European countries (including one site with partial
grid- connected turbines).
• Overall, the UK and Germany have attracted the most
investments over the past ten years. • The UK has the largest offshore wind capacity in
Europe, with 42% of all installations. Germany is
• Corporates signed six offshore Power Purchase second with 31%, followed by the Netherlands (10%),
Agreements in 2020 in Germany, Belgium, and the UK. Belgium (9%) and Denmark (7%).
• Ørsted (17%), RWE Renewables (10%), Vattenfall (6%)
and Macquarie Capital (6%) are the largest owners of
offshore wind farms.
Offshore Wind in Europe - Key trends and statistics 2020 7
WindEuropeOffshore wind farms in Europe
2.9 GW
NEW CAPACITY
INSTALLED IN 2020
25 GW
TOTAL CAPACITY
NOW INSTALLED
Moray East
Kincardine
Triton Knoll
Hornsea Two
East Anglia One Kriegers Flak
EnBW Albatros
Trianel Windpark Borkum 2
Fryslan
Borssele 3&4 Wind farm status
Borssele 5 Online
Partially online
Borssele 1&2 Under construction
Northwester 2 Wind farms with ac�vity in 2020
Seamade BELGIUM
(Mermaid & Seastar)
Northwester 2
Seamade (see p.31)
(Mermaid & Seastar)
DENMARK
Kriegers Flak (see p.12)
GERMANY
Trianel Windpark Borkum 2
NETHERLANDS:
Windfloat Atlantic Borssele 1&2 (see p.15)
Borssele 5
Borssele 3&4
Fryslan
PORTUGAL
Windfloat Atlantic (see p.22)
UK
East Anglia One
EnBW Albatros
Hornsea Two
Kincardine
Moray East (see p.22)
Triton Knoll
Source: WindEurope1.
OFFSHORE WIND
INSTALLATIONS
1.1 OVERVIEW
Europe connected 2,918 MW of offshore wind power Portugal finalised the installation of Windfloat Atlantic.
capacity in 2020, a 20% decrease on 2019, but in line with Denmark completed the monopiles installation at the
our pre-COVID-19 forecast, a sign of the commitment of Kriegers Flak wind farm, the first offshore hybrid project
the wind industry to deliver on their installation plans. The connected simultaneously to Denmark and Germany.
Netherlands (1,493 MW), Belgium (706 MW), the UK (483
MW), Germany (219 MW) and Portugal (17 MW) supplied The publication of the Offshore Renewables Energy Strat-
this new capacity to the grid. egy (ORES) sets out the EU’s ambition to build 300 GW
of offshore wind by 2050. European installation rates are
The Netherlands connected almost half of all the capac- still far less than what the sector will need to deliver this
ity to the grid with the connection of most turbines at and the 2030 National Energy and Climate Plans, as pre-
Borssele 1-5 sites. Belgium also set a national installation sented in chapter 4.
record and Seamade became its largest operational wind
farm (487 MW). The UK connected fewer turbines to the Europe has a total of 25,014 MW installed at the end of
grid but installed foundations at three wind farms, in 2020. In total, there are 116 wind farms including sites
preparation for a wave of GW-scale wind farms, following with partial grid connection across 12 European coun-
the commissioning of Hornsea One in 2019. tries. 5,402 turbines are connected to the grid.
Germany completed the grid-connection of EnBW Alba-
tros and Trianel Windpark Borkum 2 at the beginning of
the year.
Offshore Wind in Europe - Key trends and statistics 2020 9
WindEuropeOffshore Wind Installations
FIGURE 1
Annual offshore wind installations by country (left axis) and cumulative capacity (right axis)
5.0 30
Cumulative Installed Capacity (GW)
Annual Installed Capacity (GW)
4.5
25
4.0
3.5
20
3.0
2.5 15
2.0
10
1.5
1.0
5
0.5
0 0
2010 2011 2012 2013 2014 2015 2016 2017 2018 2019 2020
UK Germany Denmark Belgium Netherlands Sweden
Finland Portugal Spain Ireland France
Cumulative installed capacity
Source: WindEurope
TABLE 1
Overview of grid-connected offshore wind power projects at the end of 2020
NUMBER OF
NUMBER OF CUMULATIVE NUMBER OF CAPACITY
TURBINES
COUNTRY WIND FARMS CAPACITY TURBINES CONNECTED
CONNECTED
CONNECTED1 (MW) CONNECTED IN 2020 (MW)
IN 2020
UK 40 10,428 2,294 483 69
Germany 29 7,689 1,501 219 32
Netherlands 9 2,611 537 1,493 172
Belgium 11 2,261 399 706 81
Denmark 14 1,703 559 0 0
Sweden 5 192 80 0 0
Finland 3 71 19 0 0
Ireland 1 25 7 0 0
Portugal 1 25 3 17 2
Spain 1 5 1 0 0
Norway 1 2 1 0 0
France 1 2 1 0 0
Total 116 25,014 5,402 2,918 356
Source: WindEurope
1. It includes 14 demonstrators (single turbine or announced as demonstrator by developer).
10 Offshore Wind in Europe - Key trends and statistics 2020
WindEuropeOffshore Wind Installations
1.1 NATIONAL BREAKDOWN OF 2020 INSTALLATIONS
The Netherlands connected 1,493 MW, over half (51.1%) 2016 with only one wind farm connecting turbines to the
of the capacity brought online in Europe in 2020 complet- grid. East Anglia One (714 MW) became fully operational
ing the installation of all turbines at the Borssele Wind during the first half of the year. But offshore works started
Farm Zone. The zone consists of three wind farms Bors- at Kincardine (50 MW), Triton Knoll (857 MW), Moray East
sele 1&2 (752 MW), Borssele 3&4 (732 MW) and Bors- (950 MW) and Hornsea Two (1,386 MW). The four pro-
sele 5 (19 MW), all of them awarded in 2016 and 2017 jects together will supply an additional 3 GW over the
auctions to different consortia. The Dutch TSO Tennet was next three years.
responsible for the grid connection and installed the Bors-
sele Alpha & Beta platforms ahead of schedule. Borssele Germany connected 219 MW (7.5%), its lowest level in
1&2 are fully operational while Borssele 3&4 will connect almost 10 years. EnBW Albatros (112 MW) became the
the last turbine this year. Within the Borssele 5 innovation most distant operating wind farm, located 105km off the
site, Van Oord is currently testing the slip joint between German North Sea coast. Trianel Windpark Borkum 2
foundation and transition piece. (203 MW) was also fully commissioned in the first half of
the year installing the last Senvion machines in Europe.
Belgium connected 706 MW (24.2%), almost doubling its
installations compared to last year’s record. Northwester Portugal connected 17 MW (0.6%), completing the instal-
2 (218 MW) and Seamade2 (487 MW) are now fully opera- lation of two V164-8.4 MW turbines, the largest oper-
tional, the latter becoming the largest offshore wind farm ational floating wind turbines in the world. Windfloat
in Belgium. Atlantic (25 MW) uses semi-submersible technology and
is located 30 km off the coast of Viana do Castelo with
The UK connected 483 MW (16.6%), its lowest level since water depths reaching 100 m.
FIGURE 2
Annual gross offshore wind capacity installations per country in 2020 (MW)
Netherlands 1,493 MW; 51%
Belgium 706 MW; 24%
UK 483 MW; 17%
Germany 219 MW; 8%
Portugal 17 MW;Chapter name
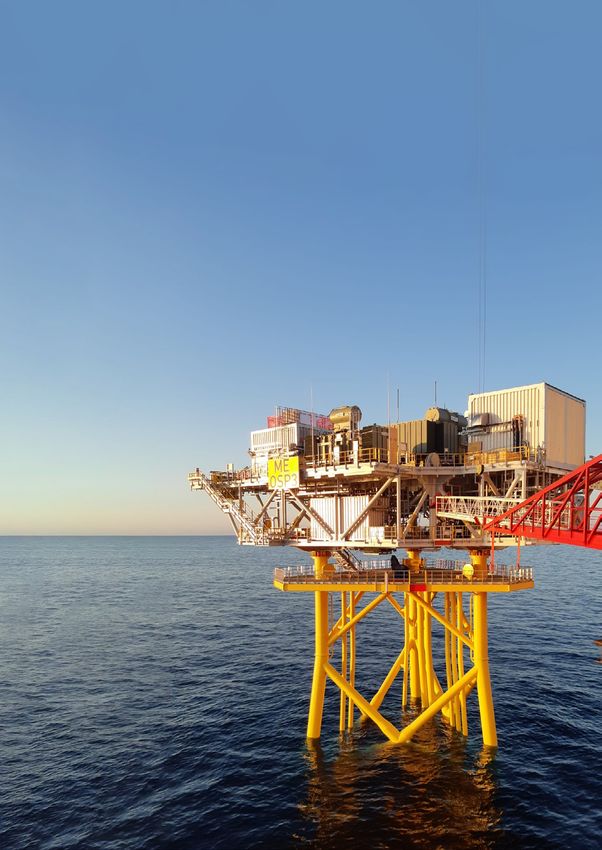
KRIEGERS
FLAK
Denmark
First offshore hybrid* project and
largest wind farm in Denmark.
Status:
Under construction
Capacity:
605 MW
No. of turbines:
72
Owners:
Vattenfall (100%)
Turbine model:
SG 8.4-167 DD (SGRE)
Inter-array cable:
JDR Cable Systems
Export cable:
NKT Group
Foundation type:
Monopiles
Foundation supplier:
EEW
* Offshore hybrid projects allow offshore
wind to be used in more than one coun-
try combining an interconnector and a
power generation asset.
© Courtesy of Van Oord
12 Offshore Wind in Europe - Key trends and statistics 2020
WindEuropeOffshore Wind Installations
In total, 16 offshore wind farms across six countries saw Last year, all installations took place in the North Sea
work take place last year. except for Windfloat Atlantic which connected two float-
ing turbines in the Atlantic Ocean.
Nine wind farms connected turbines to the grid (see table
2). Six wind farms installed foundations but did not con-
nect any turbine to the grid (see table 3).
TABLE 2
The new offshore wind installations with grid connection in 2020
CAPACITY
NUMBER OF
CONNECTED TURBINE TYPE OF
COUNTRY WIND FARM TURBINES STATUS3
IN 2020 MODEL FOUNDATION
CONNECTED
(MW)
Borssele 1&2 752 94 SG 8.0-167 DD Monopile
Netherlands Borssele 3&4 722 60 V164-9.5 MW Monopile
Borssele 5 19 2 V164-9.5 MW Monopile
Seamade 487 58 SG 8.4-167 DD Monopile
Belgium
Northwester 2 219 23 V164-9.5 MW Monopile
East Anglia One 483 69 SWT-7.0-154 3-Legs Jacket
EnBW Albatros 112 16 SWT-7.0-154 Monopile
UK
Trianel Wind- Senvion
101 16 Monopile
park Borkum 2 6.2M152
Windfloat
Portugal 17 2 V164-8.4 MW Semi-Sub
Atlantic
Source: WindEurope
TABLE 3
Wind farms under construction in 2020 but not yet grid-connected
FOUNDATIONS TOTAL
TURBINE TYPE OF
COUNTRY WIND FARM INSTALLED NUMBER OF
MODEL FOUNDATION
IN 2020 FOUNDATIONS
Netherlands Fryslan 89 89 SWT-DD-130 4.4 MW Monopile
Hornsea Two 29 165 SG-8.0-167 DD Monopile
UK Moray East 100 100 V164-9.5 MW Jacket
Kincardine 1 5 V164-9.6 MW Semi-Sub
Germany Triton Knoll 90 90 V164-9.5 MW Monopile
Denmark Kriegers Flak 72 72 SG 8.4-167 DD Monopile
Source: WindEurope
3. One barOffshore Wind Installations
1.2 CUMULATIVE INSTALLATIONS
Today there are 25,014 MW of installed capacity across Other countries include, in descending order, Sweden,
Europe. This includes a total of 5,402 turbines connected Finland, Ireland, Portugal, Spain, Norway and France.
to the grid across 12 countries. Five countries – the UK, Together these seven countries provide 1% of the installed
Germany, Denmark, Belgium and the Netherlands – still capacity with 112 turbines. In terms of cumulative instal-
represent 99% of this capacity. lations the North Sea remains the most established sea
basin in Europe with almost 20 GW (79%) of all offshore
Although the UK saw few installations in 2020, it contin- wind capacity in Europe. The Irish Sea (12%), the Baltic
ues to have the largest offshore wind capacity in Europe Sea (9%) and the Atlantic Ocean (Chapter name
BORSSELE
1&2
The Netherlands
Ørsted’s first wind farm in the
Netherlands
Status:
Fully Commissioned
Capacity:
752 MW
No. of turbines:
94
Owners:
Ørsted (100%)
Turbine model:
SG 8.0-167 DD (SGRE)
Inter-array cable:
Nexans
Export cable:
NKT Group
Foundation type:
Monopiles
Foundation supplier:
EEW (50%) & Sif (50%)
© Courtesy of Ørsted
Offshore Wind in Europe and
- KeySky Pictures
trends and statistics 2020 15
WindEurope2.
TRENDS:
TURBINE SIZE
AND WIND FARM
LOCATION
2.1 WIND TURBINE RATED CAPACITY
Offshore wind turbines are continuing to grow in power. 1&2 and Seamade. Hornsea Two will feature 165 turbines
Since 2015 turbines have grown at a constant 16% rate. of the same model and is set to become the largest wind
In 2020 the average rated capacity of turbines installed farm in the world by 2022. The V164-9.5 MW (Vestas
was 8.2 MW, which represents only 5% more compared to Wind Systems) was the second most connected model,
last year. But turbine orders in 2020 already show a trend featuring at Borssele 3&4, Borssele 5 and Northwester 2.
towards the next generation in size, with turbines ranging Other projects under construction with this model include
10 to 13 MW for projects coming online after 20224. Moray East, Triton Knoll and Kincardine wind farms, all in
the UK.
The turbine most connected to the grid in 2020 was
SG 8.0-167 DD ranging between 8 to 8.4 MW at Borssele
4. Wind Turbine Order Monitoring report – members only.
16 Offshore Wind in Europe - Key trends and statistics 2020
WindEuropeTrends: Turbine Size and Wind Farm Location
FIGURE 5
Average turbine rated capacity and number of turbines at wind farms under construction in 2020
200
Number of Turbines per Wind Farm
180
160
140
120
100
80
60
40
20
0
0 1 2 3 4 5 6 7 8 9 10
Turbine Rated Capacity (MW)
Netherlands Belgium UK Germany Portugal Denmark
Average wind turbine in 2020
Source: WindEurope
10 out of the 15 wind farms with offshore works in 2020 turbines mostly represent projects that began construc-
are using wind turbines above the average (8.2 MW), indi- tion one or two years earlier but underwent grid connec-
cated by the red line in Figure 7. Hornsea Two will hold tion this year. The exception is Fryslan, a wind farm being
the record of having installed the most turbines in a single built in a Dutch lake.
wind farm, with 165 in total. Projects with below-average
FIGURE 6
Yearly average of newly installed offshore wind turbine rated capacity (MW)
9
Turbine Capacity (MW)
8
7
6
5
4
3
2
1
0
2010 2011 2012 2013 2014 2015 2016 2017 2018 2019 2020
Average turbine capacity
Source: WindEurope
Offshore Wind in Europe - Key trends and statistics 2020 17
WindEuropeTrends: Turbine Size and Wind Farm Location
2.2 WIND FARM SIZE
Offshore wind farms have grown steadily for the past sioning of Hornsea One in 2019, enabling scale and lower
five years. The average wind farm was 788 MW – 26% costs. In 2020, Borssele 1&2 and East Anglia One were the
more than last year. And there is an upcoming wave of two largest wind farms fully commissioned, all with over
GW-scale wind farms in the UK, following the commis- 700 MW capacity.
FIGURE 7
Average size of commercial offshore wind farm projects in the year (MW)
900
Wind Farm Size (MW)
800
700
600
500
400
300
200
100
0
2010 2011 2012 2013 2014 2015 2016 2017 2018 2019 2020
Average wind farm size (MW)
Source: WindEurope
18 Offshore Wind in Europe - Key trends and statistics 2020
WindEuropeTrends: Turbine Size and Wind Farm Location
2.3 WATER DEPTH AND DISTANCE TO SHORE
Moving further offshore enables larger sea areas with on the coastline. But transmission costs are higher, and
more stable wind conditions, reduces impact on other construction and operation are both more expensive.
economic activities and minimises potential visual impact
FIGURE 8
Average water depth and distance to shore of offshore wind farms under construction during 2020. The size of the bubble
indicates the capacity of the site
120
100
80
Water Depth (m)
60
40
20
0
0 20 40 60 80 100 120
Distance to Shore (km)
Netherlands Belgium UK Portugal Denmark Germany
Source: WindEurope
The average water depth of offshore wind farms under The average distance to shore of offshore wind farms
construction in 2020 was 36 m, a slight increase on last under construction in 2020 was 44 km, a decrease com-
year (34 m). Two floating projects, Kincardine (UK) and pared to last year (52 km). The average is lower because
Windfloat Atlantic (Portugal), stand out with depths last year there were four projects under construction at
of 67 and 100 m respectively. Moray East (UK) is the distances greater than 90 km, while this year only Horn-
bottom-fixed project with the deepest waters (45 m) and sea Two (UK) and EnBW Albatros (Germany) are located
uses jackets. Most of the projects in shallower waters use that far out.
monopiles.
Offshore Wind in Europe - Key trends and statistics 2020 19
WindEuropeTrends: Turbine Size and Wind Farm Location
FIGURE 9
Average water depth and distance to shore of all offshore wind farms in Europe. The size of the bubble indicates
the overall capacity of the site.
120
100
80
Water Depth (m)
60
40
20
0
0 20 40 60 80 100 120 140 160 180 200
Distance to Shore (km)
Online Under construction With permits
Source: WindEurope
Both German and Belgian transmission system operators The industry has already built wind farms up to 100 km
(TSO) find clustering wind farms into a single offshore offshore and deeper than 100 m using bottom-fixed and
substation the most efficient way to bring electricity to floating technologies (figure 9 – online wind farms). And
shore. EnBW’s Albatros shares BorWin2 with three other it is preparing for a new generation of wind farms, much
German wind farms. And Elia, the Belgian TSO, connected further out HVDC technology will be commonly used for
three wind farms including Seamade and Northwester 2 wind farms located far offshore
to the first Modular Offshore Grid (MOG).
2.4 FLOATING WIND
Europe’s floating wind fleet stood at a total of 62 MW by and Spain with innovative foundation designs. EnBW
the end of 2020, and now makes up 83% of the global tested the Nezzy 2 floating offshore platform (1:10) in the
floating wind capacity. It grew over the course of the year Bay of Greifswald in the Baltic Sea. The model combines
with the commissioning of Windfloat Atlantic (25 MW) in two tilted turbines in a single platform and will test a full-
Portugal. Kincardine (50 MW) is now under construction scale prototype in 2021/22. SAITEC Offshore Technologies
off the coast of Aberdeen, and when operational, it will tested the BlueSATH (1:6) off the coast of Santander. The
become the largest project with five V164-9.5 MW tur- SATH (Swinging Around Twin Hull) concept is designed to
bines. Hywind Tampen (88 MW) reached Financial Invest- align itself around a Single Mooring Point following the
ment Decision in 2019 and is in pre-construction phase. direction of wind and waves. RWE Renewables signed
The project aims to reduce the cost by 40% compared a cooperation agreement to test a full-scale prototype
to Hywind Scotland, the first spar-buoy demonstrator. (DemoSATH) in 2022.
Two scale prototypes were tested this year in Germany
20 Offshore Wind in Europe - Key trends and statistics 2020
WindEuropeTrends: Turbine Size and Wind Farm Location
Europe’s pipeline of floating projects for the next decade high. This is timely because the Crown Estate amend-
is over 7 GW. France, Norway, and the UK are the most ments to the UK’s Contracts for Difference include a sep-
ambitious. But other countries, including Portugal, Ire- arate pot for emerging technologies – with floating wind
land, Spain, Italy, and Greece will also be involved. France and bottom-fixed not directly competing for the same
will auction the first of three 250 MW sites, and Norway auction volumes.
will open two areas (4.5 GW in total) for development in
2021 with one suitable for floating. Scotland is currently Table 4 gives an overview of the largest projects coming
hosting the largest seabed lease (ScotWind) and is expect- online in the next three years.
ing applications for floating projects as water depths are
TABLE 4
Floating wind farms coming online in the next three years
EXPECTED
CAPACITY FLOATER NUMBER OF TURBINE
COUNTRY WIND FARM COMMISSIONING
(MW) TYPE TURBINES MODEL
DATE
Éoliennes
Flottantes de 28.5 Semi-sub 3 V164-9.5 MW 2022
Groix
France EFGL 30 Semi-sub 3 V164-10.0 MW 2023
EolMed 30 barge 3 V164-10.0 MW 2023
Provence
25 TLP 3 SWT-8.4-154 DD 2023
Grand Large
Hywind
Norway 88 Spar 11 SWT 8.0-154 DD 2022
Tampen
UK Kincardine 50 Semi-sub 5 V164-9.6 MW 2021
Source: WindEurope
Offshore Wind in Europe - Key trends and statistics 2020 21
WindEuropeChapter name
MORAY
EAST
UK
DEME Offshore developed a
special underwater drilling tool to
cope with hard and rocky layers
Status:
Under construction
Capacity:
950 MW
No. of turbines:
100
Owners:
Ocean Winds (56.6%), Diamond
Green Limited (33.4%) & China
Three Georges (10%)
Turbine model:
V164-9.5MW
(Vestas Wind Systems)
Inter-array cable:
JDR Cable Systems (66 kV)
Export cable:
NKT Group
Type of foundation:
Jackets
Foundation supplier:
Smulders (55%) & Lamprell (45%)
© Courtesy of Moray East Project
22 Offshore Wind in Europe - Key trends and statistics 2020
WindEurope3.
INDUSTRY
ACTIVITY AND
SUPPLY CHAIN
3.1 WIND TURBINE MANUFACTURERS
Siemens Gamesa Renewable Energy (SGRE) connected at Kincardine’s floating project. The same turbines, but
63% of all turbines in 2020. They connected 237 turbines with increased rated power (V164-10.0 MW model) will
(1,840 MW) across four countries – the Netherlands, Bel- be installed in two out of four French demonstration pro-
gium, Germany and the UK. Their largest project in 2020 jects, EFGL (30 MW) and EolMed (30 MW).
was Borssele 1&2, with the installation of 94 turbines
(SG 8.0-167 DD model) completed in only eight months Senvion turbines were connected, representing 3% of all
despite COVID-19 restrictions on the movement of work- turbines in 2020.
ers and goods. This was also SGRE’s most used model in
2020, with capacity ranging between 8 to 8.4 MW. In May GE Renewable Energy did not connect any turbines in
2020, SGRE launched a 14 MW turbine with a 222m rotor 2020 but received the largest wind turbine order from
that can be boosted up to 15 MW, equipped with the new SSE and Equinor. Dogger Bank (A and B) will feature 190
Siemens Gamesa B108 blades. GE Haliade-X 13 MW; the installation is expected to begin
in 2022. For the third phase of the project (phase C) an
Vestas Wind Systems connected 33% of all turbines in upscaled 14 MW version of the same model will be used.
2020 with 103 turbines (976 MW) across three countries
– the Netherlands, Belgium and Portugal. Vestas Wind Sys-
tems installed the largest turbines in 2020 (V164-9.5 MW
model) at Borssele 3&4, Borssele 5 and Northwester 2.
Five units of the same model will be installed this year
Offshore Wind in Europe - Key trends and statistics 2020 23
WindEuropeIndustry Activity and Supply Chain
FIGURE 10
In cumulative terms, Siemens Gamesa Renewable Energy
Wind turbine manufacturers’ share of the 2020 new
remains the largest supplier with 68% of the total Euro- installations (MW) and number of turbines connected
pean installed capacity (figure 11). Vestas Wind Systems is to the grid
the second largest, with a 23.9% market share. These two Senvion
manufacturers represent 92% of the total offshore capac- 101 MW connected
ity connected in Europe by the end of 2020. 16 Turbines
Vestas Wind
Systems Siemens Gamesa
976 MW connected Renewable Energy
103 Turbines 1,840 MW connected
237 Turbines
Source: WindEurope
FIGURE 11
Wind turbine manufacturers’ share at the end of 2020
Siemens Gamesa Renewables Energy 68% 16.9 MW / 3,674 Turbines
Vestas Wind Systems 23.9% 5.7 MW / 1,290 Turbines
Senvion 4.4% 1.4 MW / 238 Turbines
Bard Engineering 1.5% 0.4 MW / 80 Turbines
GE Renewable Energy 1.4% 0.4 MW / 74 Turbines
Others 0.8% 0.07 MW / 46 Turbines
TOP 2 REPRESENT
92%
OF ALL CAPACITY
CONNECTED
Source: WindEurope
24 Offshore Wind in Europe - Key trends and statistics 2020
WindEuropeIndustry Activity and Supply Chain
3.2 WIND FARM OWNERS
Ørsted (26%), Partners Group (11%) and Iberdrola Reno- Anglia One respectively. Other owners include develop-
vables (10%) together own almost half of all the capac- ers, electricity suppliers, investment trusts and maritime
ity connected to the grid in 20205. These represent the contractors.
connection of the Borssele 1&2, Borssele 3&4 and East
FIGURE 12
Owners’ share of 2020 new installations (MW)
Ørsted 26%
Partners Group 11%
Iberdrola Renovables 10%
Parkwind 5%
Shell 5%
Eneco 5%
Diamond Generating
Europe Limited 4%
Ocean Winds 3%
Macquarie Capital 3%
Van Oord 3%
The Renewables
Infrastructure Group (TRIG) 2%
Summit Tailwind 2%
EnBW 2%
Others (below 50 MW) 19%
0 100 200 300 400 500 600 700 800
Source: WindEurope
Ørsted has the largest share of offshore wind power in Capital (6%) were the next largest. Along with Iberdrola
Europe (17%) by the end of 2020 (figure 13). Despite not Renovables, Global Infrastructure Partners and Northland
connecting turbines in 2020, RWE Renewables remains Power, these seven companies together own 51% of the
the second largest (10%). Vattenfall (6%) and Macquarie installed capacity in Europe by the end of 2020.
5. Grid-connected market shares are indicative only. Projects owned or developed by several companies have been split according to
their respective shared. Where the shares are not known, they have been split in equal parts between the partners.
Offshore Wind in Europe - Key trends and statistics 2020 25
WindEuropeIndustry Activity and Supply Chain
FIGURE 13
Owners’ share of total cumulative installed capacity at the end of 2020 (MW)
Ørsted 17%
RWE Renewables 10%
Vattenfall 6%
Macquarie Capital 6%
Iberdrola Renovables 4%
Global Infrastructure Partners 4%
Northland Power 4%
SSE 2%
Stadwerke München 2%
Siemens 2%
Partners Group 2%
EnBW 2%
Equinor 2%
Eneco 2%
PKA 1%
Copenhagen Infrastructure Partners 1%
Parkwind 1%
Trianel 1%
Masdar 1%
Elicio 1%
Enbridge 1%
Others 26%
0 1,000 2,000 3,000 4,000 5,000 6,000 7,000
Source: WindEurope
3.3 SUBSTRUCTURES AND FOUNDATIONS
Monopiles remain the preferred choice of developers Three semi-subs structures were installed at Windfloat
with over two-thirds of all installations in 2020 (80.5%). Atlantic and Kincardine. Navantia-Windar Consortium
EEW and Sif together provided 423 monopiles across continues to be in most cases the preferred supplier for
three countries. floating projects – including spar-buoys.
Jackets were second (19%) with the installation of 100
foundations. Lamprell and Smulders supplied all jackets
for Moray East (UK).
26 Offshore Wind in Europe - Key trends and statistics 2020
WindEuropeIndustry Activity and Supply Chain
FIGURE 14
Foundations and substructures installed in 2020 by manufacturing company6
EEW
Sif
Units Installed
Smulders
Lamprell
Navantia-Windar
Consortium
0 50 100 150 200 250
Monopile Jacket Semi-Sub
Source: WindEurope
Monopiles increase to a cumulative 4,681 units and pod (2.2%), and tripile (1.4%) also featured but saw their
remain the most used type of foundation (81.2%). Jack- cumulative share reduced because none were installed in
ets are second and increase their share (9.9%), because of 2020. Together all floating foundations – spar, semi-sub
installations at Moray East this year. Gravity base (5%), tri- and barge – represent a cumulative 0.2%.
FIGURE 15
Cumulative number of foundations installed by substructure type7
Tripile; 80 Spar; 6
Tripod; 126 Semi-Sub; 5
Gravity base; 289 Barge; 1
Jacket; 568 Others; 8
Monopile; 4,681
Source: WindEurope
6. Shares are calculated according to the actual number of individual foundations installed in 2020. Where the project developers
contracted more than one company to manufacture, and where the respective shares (in case of consortia/joint venture) were not
specified, foundations installed were split in equal part between the partners.
7. This includes all foundations installed with and without grid connection by the end of 2020.
Offshore Wind in Europe - Key trends and statistics 2020 27
WindEuropeChapter name
WINDFLOAT
ATLANTIC
Portugal
Largest floating turbines opera-
tional in the world.
Status:
Fully commissioned
Capacity:
25 MW
No. of turbines:
3
Owners:
Ocean Winds (79.4%), Repsol
(19.4%) & Principle Power (1.2%)
Turbine model:
V164-8.4 MW
(Vestas Wind Systems)
Inter-array cable:
JDR Cable systems
Export cable:
Hengtong
Foundation type:
Semi-sub
Foundation supplier:
ASM Industries (66%) &
Navantia-Windrar Consortium (34%)
28
© Courtesy of Wind
Offshore EDPRin Europe - Key trends and statistics 2020
WindEuropeIndustry Activity and Supply Chain
3.4 CABLES
FIGURE 16
Share of inter-array cable suppliers for energised cables in Inter-array cables (i.e. the cables used to connect turbines
20209
with each other and with the main substations at the
wind farm) were supplied in 2020 by four companies. TFK-
NSW Group8 continues to be the primary supplier of inter-array
Technology cables (41%) with 145 cables across Germany, Portugal,
39 Belgium, and the UK. Nexans was second (27%) with the
connection of turbines at Borssele 1&2. Prysmian was
third (21%) with the connection of turbines at Borssele
PRYSMIAN TFKGroup 3&4. And NSW Technology was fourth (11%). One-third
Powerlink 145 of the wind farms used 66kV inter-array cables over 33kV.
76
Nexans
94
Source: WindEurope
FIGURE 17
Share of export cable suppliers for energised cables in NKT Group (33%) and Nexans (33%) represent together
202010
more than half of the export cables energised in 2020.
This includes wind farms in the Netherlands, Belgium, and
the UK. These were followed by Hellenic Cables (22%) and
PRYSMIAN Prysmian (11%).
Powerlink
1
NKT Group
3
Hellenic Cables
2
Nexans
3
Source: WindEurope
8. Represents cables supplied by JDR Cable Systems and TFKable.
9. Number of inter-array cables is estimated with the number of turbines connected in the year.
10. Shares are calculated considering the number of cables once wind farms are fully completed (see table 2).
Offshore Wind in Europe - Key trends and statistics 2020 29
WindEuropeIndustry Activity and Supply Chain
3.5 VESSELS
In 2020 at least nine different vessel providers were active DEME Offshore, Van Oord and NKT Cables Group under-
in the installation of foundations, turbines, inter-array, took the installation and grid connection of Borssele 1&2
export cables and substations . The heavy-lift jack-up ves- (92 turbines) in just eight months during the COVID-19
sels Aeolus (Van Oord) and Seaway Strashnov (Seaway 7) pandemic. Van Oord, Seaway 7 and Boskalis finalised
were the most used vessels for these activities. installations at Borssele 3&4.
Van Oord started the installation of export cables at Bourbon Subsea Services towed the last two turbines and
Hollandse Kust Zuid 1&2 (760 MW) and led the foun- cables at Windfloat Atlantic in 2020, but this achievement
dations installation at Fryslan (383 MW), both coming required a previous installation of anchors and pre-lay
online in the next two years. Seaway 7 installed substa- operation before hook-up. Boskalis oversaw the instal-
tions weighing up to 3,700 tonnes at three wind farms. lation of anchors, mooring lines, and the transport to
assembly site for the first floating foundations at Kincar-
dine, due to be operation in 2021.
TABLE 5
Wind farms serviced by vessel provider that were installing turbines, foundations, inter-array cables, export cables,
and substations in 2020
INSTALLATION OF
VESSEL
PROVIDER INTER-ARRAY EXPORT
TURBINES FOUNDATION SUBSTATION
CABLE CABLE
Moray East Borssele 3&4
Boskalis Subsea Triton Knoll Triton Knoll
Kincardine Kincardine
Bourbon Subsea Windfloat Windfloat
Windfloat Atlantic
Services Atlantic Atlantic
Seamade
Borssele 1&2 Borssele 1&2 Moray East
(Mermaid & Seastar)
DEME Offshore East Anglia One Hornsea Two
Seamade
Moray East
(Mermaid & Seastar)
Fred Olsen Trianel Windpark
Moray East
Windcarrier Borkum 2
Global Offshore Kriegers Flak
Jan de Nul Northwester 2
NKT Cables Borssele 1&2
Group Moray East
Triton Knoll Borssele 1&2
Seaway 7 Borssele 3&4
Triton Knoll
Hollandse
Borssele 3&4 Borssele 3&4 Borssele 1&2
Kust Zuid 1&2
Van Oord Borssele 5 Borssele 5 Borssele 3&4
Fryslan Borssele 5
Kriegers Flak
Source: WindEurope
11. Vessels used for pre-construction, other installation services and support are not highlighted in this analysis.
30 Offshore Wind in Europe - Key trends and statistics 2020
WindEuropeChapter name
SEAMADE
(Seastar &
Mermaid)
Belgium
Largest Belgian offshore wind farm.
Status:
Fully commissioned
Capacity:
487 MW
No. of turbines:
58
Owners:
Otary* (70%), Ocean Winds
(17.5%) & Eneco (12.5%)
Turbine model:
SG 8.4-167 DD(SGRE)
Inter-array cable:
JDR Cable systems
Export cable:
Hellenic Cables
Foundation type:
Monopiles
Foundation supplier:
Sif (100%)
*Otary is a partnership of eight Belgian
companies (Aspiravi, DEME NV, Elicio,
Power at Sea, Rent a Port, Socofe, SRIW
& Z-Krach). Ownership’s share has been
equally divided between partners.
© Courtesy of Otary
© Courtesy of Ørsted and Sky Pictures Offshore Wind in Europe - Key trends and statistics 2020 31
WindEurope4.
INVESTMENTS
AND POLICY
DEVELOPMENTS
4.1 FINANCING ACTIVITY
Despite COVID-19, 2020 was a record year for offshore The 7.1 GW of new capacity was financed at an average
wind financing in Europe with €26.3bn raised for the capital expenditure (CAPEX) per MW of €3.6m. There is
financing of new offshore wind farms. It was also a record however a large spread of capex across projects. The two
for new capacity financed with 7.1 GW, indicating an French wind farms, Fécamp and Saint-Brieuc, come at
important shift of speed and volume in the European off- higher-than-average costs due to long permitting delays
shore wind sector. Notably 2020 saw the final investment and the fact that the tender under which they were
decisions taken on two mammoth offshore wind farms, selected (in 2011) required that the turbine selected to
the 1.5 GW Hollandse Kust Zuid (1-4) wind farm in the be built on French territory. The Dogger Bank (A and B)
Netherlands and the first two phases of Dogger Bank wind also comes at higher-than-average CAPEX as it includes
farm in the UK, Dogger Bank A and B, with a combined transmission costs and it is located very far out, at 130km
capacity of 2.4 GW. The capital raised for these two alone off the east coast of Yorkshire in England. Finally, the
was over €15.5bn which, on their own, would have been pre-commercial Kincardine floating offshore wind farm
the second highest annual amount on record in Europe. was financed at €8.3m/MW.
32 Offshore Wind in Europe - Key trends and statistics 2020
WindEuropeInvestments and Policy Developments
FIGURE 18
New offshore wind investments and capacity financed: 2010 – 2020 (€bn)
30 30
25 25
20 20
GW
€bn
15 15
10 10
5 5
0 0
2010 2011 2012 2013 2014 2015 2016 2017 2018 2019 2020
Total investments (€bn) New capacity financed (GW)
2010 2011 2012 2013 2014 2015 2016 2017 2018 2019 2020
Total investments (€bn) 8.4 6.1 5 7.2 8.8 13.1 18.2 7.5 10.3 6 26.3
New capacity financed
2.2 1.5 1.3 1.6 2.1 3 5 2.3 4.2 1.4 7.1
(GW)
Source: WindEurope
In total, eight projects reached Final Investment Decision (FID) in 2020, in the UK, the Netherlands, France and Germany.
TABLE 6
Investment in European offshore wind farms in 202012
EXPECTED
CAPACITY INVESTMENT COST
COUNTRY WIND FARM COMMISSIONING
(MW) (€bn) (€m/MW)
DATE
Fecamp 497 2.4 4.9 2023
France
Saint-Brieuc 496 2.3 4.6 2023
Germany Kaskasi 342 0.7 1.9 2022
Hollandse Kust Noord 759 1.6 2.0 2023
Netherlands Hollandse Kust
1,500 3.4 2.3 2022/23
Zuid 1-4
Kincardine 50 0.4 8.3 2021
Dogger Bank
UK 2,400 12.2 5.1 2024/25
(A and B)
Seagreen 1,075 3.3 3.1 2023
Source: WindEurope
Since 2010 the UK has attracted more than half of all new last ten years. Germany was the next largest with 25% or
investments, worth €59bn, making it the biggest offshore €28bn in investments over the same period.
wind market for capital spending commitments over the
12. Figures include estimates where transaction values are unavailable.
Offshore Wind in Europe - Key trends and statistics 2020 33
WindEuropeInvestments and Policy Developments
4.2 OFFSHORE PPAs
The first offshore corporate Power Purchase Agreement corporates looking to source large volumes of renewa-
(PPA) was signed in 2018 by the pharmaceutical firms ble electricity. Offshore wind farm developers are looking
Novozymes and Novo Nordisk for approximately 120 MW at corporate PPAs as a way to guarantee their revenue
of the output of Kriegers Flak in Denmark. By the end of in the long-term. This is particularly important where
2019, five more corporates had signed PPAs with offshore zero-subsidy bids are being placed and developers are
wind farms. Another six PPAs were signed by corporates fully exposed to the wholesale market price.
in 2020 in Germany, Belgium and the UK, demonstrating
that offshore wind PPAs are now a valuable option for
TABLE 7
Investment in European offshore wind farms in 2020
COUNTRY CORPORATE CAPACITY (MW) WIND FARM
Ineos 56 Northwester 2
Belgium Ineos 84 Norther
Borealis 235 Mermaid
Deutsche Bahn 66 Amrumbank West
Germany
Amazon 250 Borkum Riffgrund 3
UK Nestlé 31 Race Bank
Source: WindEurope
4.3 AUCTION RESULTS
In 2020 there was only one offshore wind auction. In July, panies have taken financial investment decisions regard-
The Dutch Enterprise Agency RVO announced the results ing the project. The project is the fifth area of the Dutch
of the Hollandse Kust Noord tender. The site has a total roadmap to reach 4.5 GW of offshore wind capacity by
759 MW (125km2) and is expected be commissioned in 2023. The area is located next to the existing wind farms
2023. Egmond and Zee (108 MW) and Prinses Amalia (120 MW),
both operational since 2007/08.
The development rights were awarded to Crosswind N.V.,
a consortium of Shell New Energies and Eneco. Both com-
TABLE 8
Investment in European offshore wind farms in 2020
STRIKE EXPECTED
WIND CAPACITY TYPE OF
COUNTRY PRICE WINNER COMMISSIONING
FARM (MW) SUPPORT
(€/MWh) DATE
Shell New
Hollandse Zero-subsidy
Netherlands 760 - Energies & 2023
Kust Noord V bid
Eneco
Source: WindEurope
34 Offshore Wind in Europe - Key trends and statistics 2020
WindEuropeInvestments and Policy Developments
The project will feature 69 SGRE turbines (SG 11.0-200 The Hollandse Kust Noord will combine five technology
DD model) with 200 m rotor diameters and 11 MW rated demonstrations: a floating solar park, a short-term battery
power. The Dutch TSO TenneT will be responsible for con- storage, tuned to the wake effects on neighbouring ones
structing the offshore substation to export electricity. Jan and renewable hydrogen production with electrolysers,
de Nul and LS Cable & System won the contract to car- supporting the transition to a renewables-based energy
ry-on the design, manufacture and execute the high volt- system.
age cables (220 kV) for the project.
4.4 POLICY DEVELOPMENTS AND OUTLOOK
The initial restrictions on the free movement of workers tal to deliver on all these. Delivering these big offshore
at the height of the COVID-19 pandemic affected con- wind volumes by 2050 will require development such
struction and maintenance activities across offshore wind as offshore hybrids, energy islands, offshore renewable
farms in Europe. But Governments lifted these restric- hydrogen production, and multi-terminal HVDC systems
tions in a timely fashion and annual capacity connected to which will require adjustments to EU legislation, notably
the grid in 2020 was largely unaffected. on Market Design.
Europe’s long-term energy and climate policies are At national level, policy developments remain focused on
broadly favourable to offshore wind. And in December, 2030. The UK pledged to building 40 GW of offshore wind
the EU is enshrining in legislation its ambition to become by 2030 and Denmark has identified areas up to 12.4 GW
climate neutral by 2050. And EU Heads of State commit- of offshore capacity to be auctioned in the coming dec-
ted 2020 to increase the EU-wide 2030 climate target to ade. Positively, wind is becoming a pan-European story.
at least 55%, up from the current 40%. In June 2021 the There were crucial pieces of legislation tabled or adopted
European Commission is expected to table a higher 2030 in Poland, Lithuania, Ireland, and Spain. And Governments
renewable energy target, from today’s 32%. from Greece, Turkey and Romania are in the process of
drawing up their frameworks for developing offshore
The EU Green Deal, the economic strategy for meeting wind.
both climate neutrality and economic recovery, included
an Offshore Renewable Energy Strategy. Published at But policy has not been favourable to offshore wind
the end of 2020, this strategy proposes legislative and everywhere. Challenges remained in Germany, which
non-legislative actions for the deployment of 300 GW of passed the Offshore Wind Bill (WindSeeG) after thorny
offshore wind in the EU-27 by 2050. Adding up the ambi- discussions. The Government’s initial proposal was to
tions of the UK and Norway, Europe would have 400 GW make developers pay for the right to build offshore wind
by 2050. The offshore renewable energy strategy focuses farms. In the end, the legislation left the auction system
on six key areas to make this happen: maritime spatial unchanged for two years, with a future re-evaluation.
planning, grid infrastructure, an EU regulatory framework Sweden remains closed for offshore wind and Portugal
for offshore grids, private-public investment, research and does not offer any government support for deployment.
innovation, and supply and value chain.
In total, Government offshore wind commitments across
In the coming 2-3 years the implementation of the off- Europe add up to 111 GW of offshore wind by 2030. To
shore strategy will determine whether the EU sets the meet these volumes, Governments need to ramp up
right framework to meet the 25-fold increase of capac- build-out from the current 3 GW/year to 11 GW/year by
ity expected by 2050. In the short-term up to 2030, large 2026 and sustain this installation pace And they should
uncertainties remain on the ability of Governments to provide a clear pipeline of auctions for contracts for dif-
expedite permitting, including the coordination of their ference, which are the most cost-effective instrument for
maritime spatial plans, and on the pace of grid build-out developing offshore wind.
on- and offshore. Regional cooperation will be instrumen-
Offshore Wind in Europe - Key trends and statistics 2020 35
WindEuropeInvestments and Policy Developments
FIGURE 19
European Offshore Wind Outlook to 203013
12
5-year average
10 UK
Germany
Denmark
8 Netherlands
Belgium
Annual Installations (GW)
France
Poland
6 Ireland
Italy
Sweden
4 Finland
Norway
Spain
Portugal
2 Lithuania
Latvia
Estonia
0
2021 2022 2023 2024 2025 2026 2027 2028 2029 2030
Source: WindEurope
TABLE 9
European Offshore Wind Installation Forecast to 2030 (GW)
2026-2030
2021 2022 2023 2024 2025
AVERAGE
Europe 3.9 5.4 4.9 6.5 9.2 11.2
Source: WindEurope
13. Pipeline of projects including tenders and government commitments established by law. The installations for the period 2026-2030
are a yearly average distributed to countries across a five-year period. For a detailed breakdown visit: www.windeurope.org/2030plans
36 Offshore Wind in Europe - Key trends and statistics 2020
WindEuropeWindEurope is the voice of the wind industry, actively promoting wind power in Europe and worldwide. It has over 400 members with headquarters in more than 35 countries, including the leading wind turbine manufacturers, component suppliers, research insti- tutes, national wind energy associations, developers, contractors, electricity providers, financial institutions, insurance companies and consultants. This combined strength makes WindEurope Europe’s largest and most powerful wind energy network. Rue Belliard 40, 1040 Brussels, Belgium T +32 2 213 1811 · F +32 2 213 1890 windeurope.org
You can also read


