On the Brink: 2021 Outlook for the Intercity Bus Industry in the United States - BY JOSEPH SCHWIETERMAN, BRIAN ANTOLIN & CRYSTAL BELL ...
←
→
Page content transcription
If your browser does not render page correctly, please read the page content below

On the Brink:
          2021 Outlook for the Intercity
         Bus Industry in the United States

               BY JOSEPH SCHWIETERMAN, BRIAN ANTOLIN & CRYSTAL BELL
                                  JANUARY 30, 2021

CHADDICK INSTITUTE FOR METROPOLITAN DEVELOPMENT AT DEPAUL UNIVERSITY | POLICY SERIES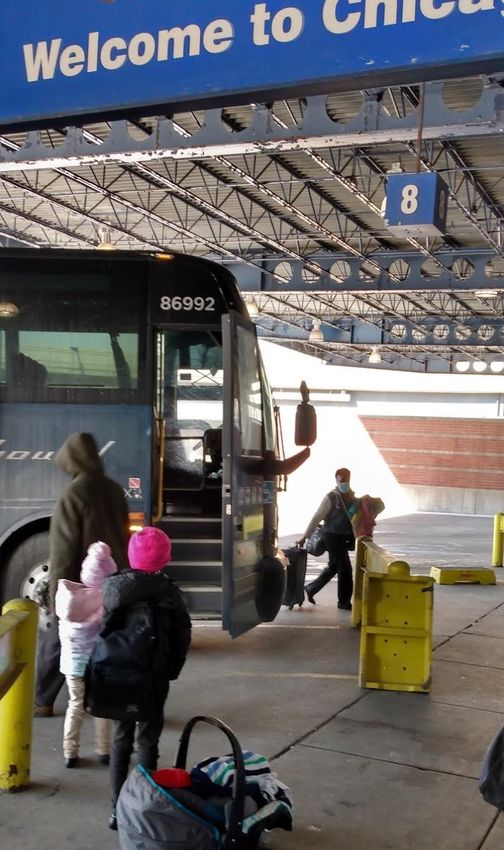
THE STUDY TEAM

AUTHORS           BRIAN ANTOLIN, JOSEPH P. SCHWIETERMAN AND CRYSTAL BELL

CARTOGRAPHY       ALL TOGETHER STUDIO
AND GRAPHICS

ASSISTING         MICHAEL R. WEINMAN AND PATRICIA CHEMKA SPERANZA OF PTSI TRANSPORTATION
CONTRIBUTORS

DATA              KIMBERLY FAIR AND MITCH HIRST
TEAM

COVER             BOTTOM CENTER: ANNA SHVETS; BOTTOM LEFT: SEE CAPTION ON PAGE 1;
PHOTOGRAPHY       TOP AND BOTTOM RIGHT: CHADDICK INSTITUTE

                               The Chaddick Institute does not receive funding from intercity bus lines or suppliers of bus
                               operators. This report was paid for using general operating funds. For further information,
                               author bios, disclaimers, and cover image captions, see page 20.

                    JOIN THE STUDY TEAM FOR A WEBINAR ON THIS STUDY:
                     Friday, February 19, 2021 from noon to 1 pm CT (10 am PT) | Free
                         Email chaddick@depaul.edu to register or for more info

 CHADDICK INSTITUTE FOR METROPOLITAN DEVELOPMENT AT DEPAUL UNIVERSITY
  CONTACT: JOSEPH SCHWIETERMAN, PH.D. | PHONE: 312.362.5732 | EMAIL: chaddick@depaul.edu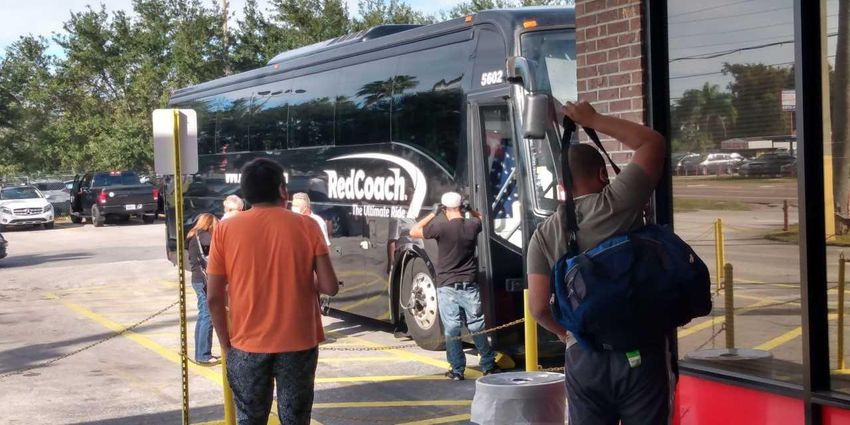
INTRODUCTION
The prognosis for the intercity bus industry remains uncertain due to the weakened financial condition of most
scheduled operators and the unanswerable questions about the pace of a post-pandemic recovery. This year’s
Outlook for the Intercity Bus Industry report draws attention to some of the industry’s changing fundamentals
while also looking at notable developments anticipated this year and beyond.

Our analysis evaluates the industry in six areas: i) The status of bus travel booking through January 2021; ii)
Notable marketing and service developments of 2020; iii) The decline of the national bus network ticket options
sold on greyhound.com that is relied upon by travelers on thousands of routes across the U.S. Mainland; iv) Trends
in bus fares versus those for air and rail travel; v) Legislative trends and service innovations; and vi) Conclusions
and predictions about near-term developments likely to affect the industry.

Our seven principal findings presented below show that despite the challenges, signs of optimism are emerging
that the intercity bus industry will move from “the brink” onto a more solid financial footing in post-pandemic
times.

A Greyhound buses pauses at the Binghamton Transportation Center in Upstate New York on January 19, 2019.
Nightfall: Binghamton NY by Can Pac Swire licensed by CC BY-NC 2.0

                                                                 1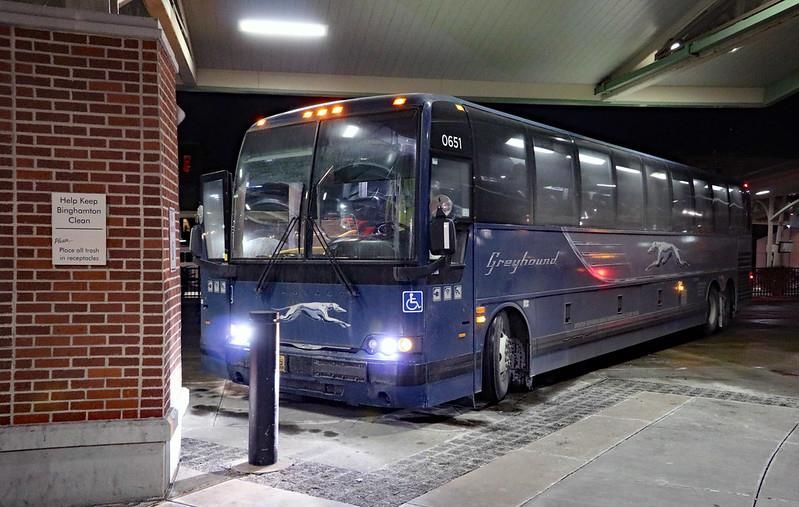
FINDING 1.                                                               Booking information provided to us by Transcor Data
Bookings for bus travel ended 2020 at                                    Services (TDS) shows the steep decline in bus ticket
                                                                         purchases throughout most of the United States in
around 16% of the previous year in the
                                                                         2020 compared to 2019 (Figure 1). The gray lines
Northeast and at 24 – 35% of the previous                                represent 2019 sales, while the orange lines track
year in other parts of the country. Cash                                 2020 sales (Figure 1). This information was compiled
shortfalls will make the next five or six                                and aggregated from TDS’s clients, who operate in
months a tumultuous time for scheduled bus                               most areas of the country, but not all. Bookings are
lines, particularly those with asset-intensive                           around 22 – 25% of 2019 levels in December 2020
                                                                         for the country as a whole. The up-and-down cycle
business models. Optimism is nonetheless
                                                                         evident in the charts over successive dates reflects
growing that a recovery will gather                                      the tendency of bookings to be much lower during
momentum by mid-summer.                                                  midweek (Tuesday, Wednesday and Thursday) than
                                                                         during the Friday - Monday period. The softness of
                                                                         demand in December is particularly evident.

FIGURE 1: Total Bookings for Bus Travel, Comparison versus Previous Year
 Daily Bookings

                  Jan   Feb   March    April May         June     July    August Sept          Oct     Nov      Dec

This chart shows year-over-year changes in bookings observed by Transcor Data Service. This information was compiled and aggregated
from TDS’s clients, who operate in most areas of the country, but not all. The chart shows December 2020 bookings are in the 20-25%
range of those in the previous year, although much lower in the Northeast and higher in rest of the country. Credit: Terry Cordell, CEO,
Transcor Data Services (TDS) via email on January 18, 2021. Please refer to Page 20 to see regional trends.

                                                                   2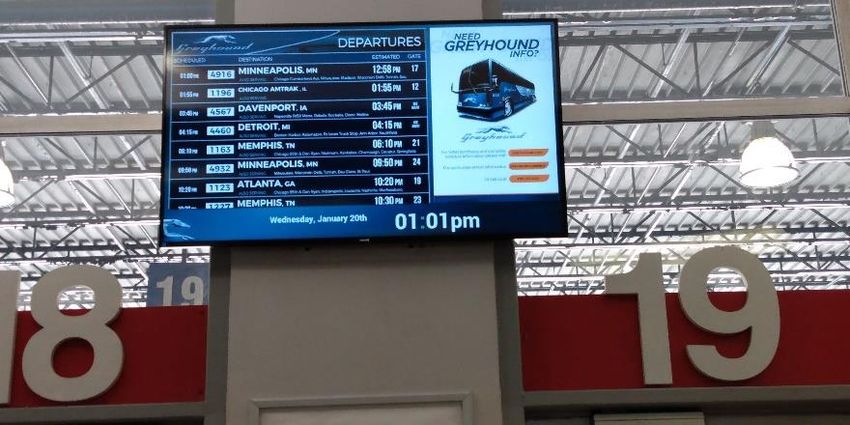
Not all regions have performed the same. The                 bookings fell by 11.4 and 9.2 percentage points,
Northeast and West regions, for example, have                respectively, after September. By December,
underperformed the rest of the country by a                  bookings in the Northeast had fallen to just 15.5% of
considerable margin, in part due to continuing public        those from the previous year. Bookings were only
health mandates and restrictions in those areas.             marginally better, at 24.1%, in the West. (See month
Bookings in those two regions rose steadily from             charts for each region on page 20).
April to September, but they only reached roughly
26.9% and 33.3% of 2019 levels respectively in               We believe that January 2021 brought a modest
September 2020 (Table 1). In the Midwest,                    rebound over December 2020 levels, and that traffic
Southeast, and Southwest, bookings rose more                 will gradually build through mid-summer, when a
impressively, rising to around 36 - 38% of 2019 levels       more robust recovery will occur. Summer will bring
in September 2020.                                           more seasonal demand, and vaccines are likely to be
                                                             more widely administered to all age groups by that
After September, however, bookings fell                      time (see our Conclusions and Predictions on Page
precipitously. The severity of the decline was               18).
particularly stark in the Northeast and West, where

TABLE 1: 2020 Bookings as a Share of 2019 Levels
                      SEPTEMBER 2020       DECEMBER 2020            PCT. POINT CHANGE SEPT. – DEC
 Midwest                    36.9%               33.9%                            -3.0 pts.
 Southeast                  38.8%               34.0%                             -4.8
 Southwest                  38.5%               34.9%                            - 3.6
 West                       33.3%               24.1%                             -9.2
 Northeast                  26.9%               15.5%                            11.4

FINDING 2.                                                   proportion of their operators, mechanics, station
Although the pace of route development                       personnel, and management were stricken with
                                                             COVID-19. Despite such problems, numerous bus
dramatically dropped due to the pandemic,
                                                             lines rolled out notable initiatives.
intercity bus lines made a variety of
strategic moves last year, including                         1. M A J O R P LA N S A N N O U N CED F OR THE P O RT
                                                             A UTH O RI T Y B U S TE R MI NA L.
experimentation with new booking platforms
                                                             The Port Authority of New York and New Jersey
and service enhancements. These                              announced this month that it will reconstruct and
innovations will likely accelerate as demand                 expand the Port Authority Bus Terminal in
gradually rebounds.                                          Manhattan over the next ten years. The ambitious
                                                             plan includes room to handle 30% more buses,
Many carriers continue to operate dramatically               including electric buses and potentially automated
reduced schedules and are only gradually adding              buses. The plan also incorporates a terminal to be
back schedules as conditions improve, a process we           built west of the main terminal for intercity buses
will cover in future reports. Over the past 10               and ramps that connect to the Lincoln tunnel. The
months, some have struggled to maintain continuity           expansion will provide expanded capacity that
in operations and planning in 2020 after a sizeable          reduces the number of intercity buses picking up and

                                                         3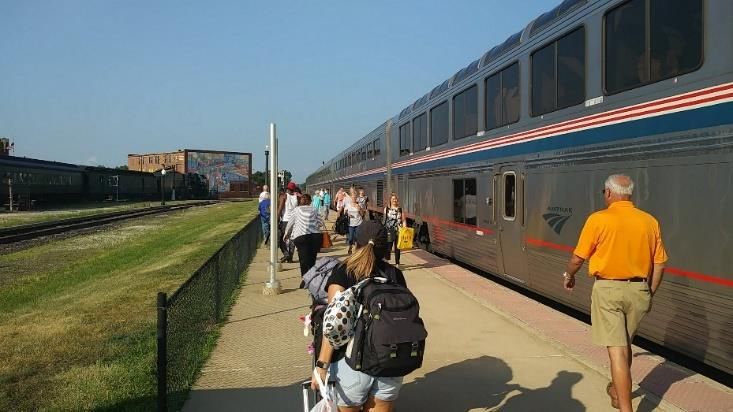
dropping off curbside. The project still needs to                      ShortLine Bus operated a variety of intrastate New
      undergo an environmental review and will likely not                    York routes on the platform from August to
      be complete until 2030 or later. The new terminal                      November, primarily during college breaks and
      will be financed by agency funds, private investment,                  holiday periods. The routes included New York to
      and yet to be approved federal funds.                                  Alfred and Morrisville (both home to SUNY
                                                                             campuses) and Hamilton (Colgate University).
      2. M O RE C OA C H US A R O UT E S A RE BE I N G S O L D               ShortLine also operated limited New York -
      O N T HE ME GA B U S. C OM P L ATF O RM.
                                                                             Binghamton - Ithaca schedules during breaks and
      Megabus.com added several regional Coach USA-                          holidays, filling a gap created by the suspension of its
      operated routes to its Megabus booking platform.                       daily operations on that route.
      Moving these services to this online reservation
      platform helps support capacity control required by                    3 . E N HA N CEM E NT S T O H A MP T O N JI T NE Y .
      COVID-19 safety precautions and service planning.                      Notwithstanding the abrupt decline of leisure and
                                                                             commuter traffic to and from New York City,
      Kerrville Bus operated several intrastate Texas                        Hampton Jitney partnered with a niche travel
      routes sold on the Megabus.com platform on                             provider, Rove, to launch a co-branded Hampton
      weekends and holiday periods starting in                               Ambassador service between Manhattan and the
      September, including trips from Houston to College                     Hamptons in August. The luxury service operated
      Station and Prairie View (both home Texas A&M                          from new stops on the far West Side of Manhattan
      campuses) and San Marcos (Texas State). Kerrville                      near Hudson Yards, and features enhanced onboard
      also ran trips from Dallas to Austin (Texas), Waco                     services, including a curated beverage menu and
      (Baylor), College Station, and San Marcos.                             other amenities. Hampton Ambassador operated a
                                                                             weekly Friday eastbound and Sunday westbound trip
                                                                             until the service was suspended due to COVID-19. 1
                                                                             Hampton Jitney also enhanced its Ambassador
                                                                             service in October by allowing passengers to pre-
                                                                             order bagels and delicacies from local purveyor Ess-
                                                                             A-Bagel to enjoy onboard or carry with them upon
                                                                             arrival. This represents a “win-win” for both
                                                                             companies, as it provides a new revenue source
                                                                             during trying times.

                                                                             In June the company added a new stop in
                                                                             Farmingville, NY along one of its existing North Fork
                                                                             Long Island-Manhattan routes. Aimed at
                                                                             commuters, this service provides passengers
                                                                             multiple departure options to and from Manhattan’s
                                                                             East Side daily. Hampton Jitney has been aggressive
                                                                             in online marketing. Part of its success has been
                                                                             attributed to customer reticence to use its
                                                                             competitor, the Long Island Rail Road (LIRR). LIRR
                                                                             has reduced service since the pandemic and is
                                                                             regarded by some as too crowded to be safe,
Partial list of bus lines making notable moves after start of pandemic
                                                                             especially on the three hour journey from New York

                                                                         4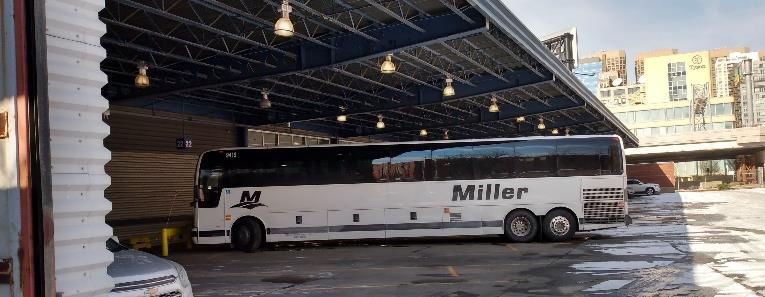
City to the Hamptons, Montauk, and the North                   OurBus added these services to its booking platform,
Fork.2                                                         none of which are branded as Ourbus:
                                                                        Select BestBus/DC Trails schedules for New
4 . C OL O R AD O’ S B U ST A NG FIL L S A GA P.                        York-Washington, DC and New York-Vienna,
Colorado Department of Transportation initiated a                       VA (began in March)
new Bustang route between Craig, CO and Denver,                         MJM Travel Group/Silver Star
CO in June, taking the place of a discontinued                          Transportation schedules between New
Greyhound Salt Lake City, UT - Denver, CO route.                        York and Woodbury Commons Mall (began
The daily round trip service makes a variety of stops,                  in October, operates select days)
including Steamboat Springs, Hot Sulphur Springs,                       Daytrip excursions by Superior Tours
Granby, Winter Park, Idaho Springs, and the Denver                      between metropolitan Baltimore and
Federal Center. This state subsidized service is                        Atlantic City Casinos (offered in November)
temporarily operated by Greyhound until a full
transition to a local operator occurs later in 2021.3          FlixBus added these services to its booking platform,
Refer to our 2020 Outlook for more on Bustang.                 none branded as Flixbus:
                                                                        National Park Express service between the
5. ST. G E OR GE E X P RE S S R E B RA N DE D A S S A LT                Las Vegas Strip and the Grand Canyon
LA KE E X P RE S S.
                                                                        (select days, sold with through connections
St. George Express, based in St. George, UT, was                        to Los Angeles and Phoenix)
officially rebranded as Salt Lake Express, its sister                   Wenatchee Valley Shuttle service from
company, in September. The move unifies the                             Seattle (Sea-Tac Airport) - Wenatachee
company’s network under the Salt Lake City Express                      Station, WA, with intermediate stops in
name, stretching from Arizona to Montana, with                          Bellevue, North Bend, and Peshatin)
extensive service as well in Idaho, Nevada, Utah, and                   Wanda Coach service from New York –
Wyoming. In January 2021, Salt Lake Express also                        Atlanta, with intermediate stops in Durham,
launched a new daily round trip between Jackson,                        Greensboro, Charlotte, NC , and Greenville,
WY and Salt Lake City, UT, eliminating the need to                      SC (daily service)
transfer in Idaho Falls, ID. Stops on that route                        OvRride service from New York – Mountain
include Alpine Junction, WY, Evanston, WY and Park                      Creek Ski Resort, NJ, with multiple pick-up
City, UT.                                                               locations in Brooklyn and Manhattan
                                                                        (operated select days).
6. F LIX B U S A N D O UR B U S FO R GE
PA RT N E R S HI P S T O E X P A N D B O O KI N G
P LAT F O RM S.                                                7. R OX C RE ATE S —A N D T H EN PA U SE S — NEW
                                                               VIR GI NI A B US SE RVI CE.
Companies are finding new ways to fill empty seats
                                                               Rapid Overland Express, “ROX”, launched a luxury
amid the devastating effects of the pandemic.
                                                               coach service in July between Virginia Beach, VA and
Flixbus and OurBus, for example, are hosting other
                                                               the Washington, DC area, with a stop at Pentagon
service providers on their booking platforms while
                                                               City, VA near Reagan National Airport. The new
allowing these providers to retain their own
                                                               service, the brainchild of former Virginia State
branding and control over pricing, scheduling, and
                                                               Senator and local businessman Jeff McWaters, was
customer service. The booking platforms act purely
                                                               facilitated by a grant from the Virginia Beach
as new sales channels and generate a commission
                                                               Development Authority. Complete with an onboard
for the hosts on each ticket sold.
                                                               attendant, hot meals, and 2x1 seating, this service
                                                               was patterned on premium services across the

                                                           5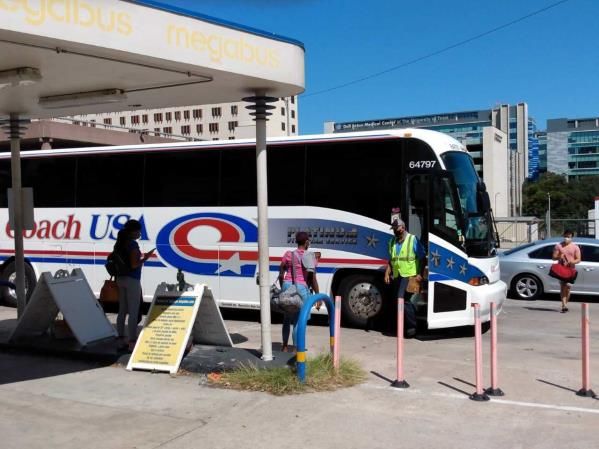
country, such as Vonlane. The two daily roundtrips              FINDING 3.
provide a viable alternative to driving or flying from          The national network of intercity bus
the coast. In August, ROX realigned its intra-state
                                                                schedules that is sold on Greyhound’s
Virginia route network, launching service connecting
Charlottesville to Virginia Beach and Washington,
                                                                computer reservation system and website,
DC. Due to the pandemic, however, the company                   which is supported by extensive interline
paused all regular line service in September and is             and terminal-sharing arrangements, has
currently only offering charter runs with its luxury            markedly diminished in the past few years.
vehicles. Please refer to our 2019 Outlook report for           The network’s problems predate the
a summary of the many premium services operated
                                                                pandemic but are being magnified by tepid
throughout the county.
                                                                demand during the public health emergency.
8. C &J B U S LI N E S NE W TE RMI N A L .                      If the network further erodes, it could leave
In November, C&J Bus Lines opened a new state-of-               thousands of city pairs without any
the-art facility in Seabrook, NH on the site of a               scheduled intercity transportation service.
former Sam’s Club. This facility replaces the
company’s former terminal in Newburyport, MA.                   The national intercity bus network offers travelers
The property boasts an attractive terminal building             attractive connections over a coordinated network
and parking space for up to 800 vehicles. Passengers            of routes encompassing a wide variety of connecting
enjoy express service to Boston South Station and               hubs. That network has been sustained by
Logan Airport as well as direct service to New York             collaborations between independent bus lines. Each
City.                                                           independent bus line apportions revenues based on
                                                                interline agreements and sells tickets through a
9 . R O CK Y M O U N TAI NE E R A N N O U NC E D T R AI N       computer reservation system (CRS) managed by
R O UTE W IT H M OT O R C OA C H C O N NE CT I O NS             Greyhound Lines. This CRS is used by ticket agents
Rocky Mountaineer, the Canadian Vancouver based                 at the carrier’s stations and those of partner lines as
tour train service is launching a U.S. service in August        well as by the websites of these carriers. The
2021. It will operate twice weekly on a two day                 platform uses algorithms that build itineraries using
schedule from Denver, CO to Moab, UT by rail, with              the schedules of more than 20 carriers. These
direct connecting (fare-inclusive) buses to Salt Lake           “interlined” carriers use a common terminal at
City UT and Las Vegas, NV. Other bus connections                nearly all points at which passenger transfers are
may be operated, and single tickets are available at            made.
super-premium fares and include meals and a night
in a hotel in Glenwood Springs each way. The service            Examples of small and mid-size bus lines that are
will operate through October and resume again in                part of this national network are Barons Bus,
Spring 2022.                                                    Burlington Trailways, Greyhound, Indian Trails,
                                                                Jefferson Lines, Martz Trailways, Miller
                                                                Transportation, New York Trailways, and Peter Pan.
                                                                The network allows passengers to make bus trips,
                                                                for example, from Columbus, Ohio to Des Moines,
                                                                Iowa with a single ticket. This trip may involve
                                                                travelling by Greyhound to Chicago and then using
                                                                Burlington Trailways for the rest of the journey.
                                                                Passengers have a guaranteed connection, meaning

                                                            6
that the bus lines involved have an obligation to re-                   The network must offer customers a variety of
accommodate them if they are unable to make the                         choices involving well timed connections to be truly
transfer due to a late arriving or cancelled bus, much                  effective. However, before the pandemic traffic had
as airlines do for their passengers.4                                   already become too thin to support service on many
                                                                        routes. The weakening of demand was due to a
The importance of having the network became                             variety of factors, including:
evident during 2018 and 2019, when tens of
thousands of immigrants purchased tickets (or had                               Low gasoline pricing and rising car
tickets purchased for them) at Greyhound stations                               ownership, which reduced demand on
for travel between the Texas/Mexico border areas                                many local routes.
and interior points throughout the country.5 In                                 Perceptions that bus travel was
other cases, social service organizations bought                                undesirable or unsafe, an image that in
tickets for immigrants using the greyhound.com                                  some instance was due to problems in
website. These travelers made trips from El Paso,                               neighborhoods in which bus stations are
TX, Phoenix, AZ, and other cities near the border to                            located. This has been magnified by
places throughout the country, many requiring two                               concern among some travelers over a lack
or three transfers. The network allowed them to                                 of customer service staff at terminals,
reach family and friends living in almost any city with                         particularly during a pandemic.
more than a few thousand residents on the U.S.                                  The high costs of operating terminals in
Mainland. (For analysis, see our 2020 Outlook                                   cities, which, in contrast to airports and
report)                                                                         train stations, often require bus lines to pay
                                                                                property taxes and incur other expenses
                                                                                not borne by these other modes.
                                                                                Loss of traffic to express city-to-city
                                                                                operators, such as Flixbus, Megabus,
                                                                                OurBus, and RedCoach, which are not sold
                                                                                on the greyhound.com platform. These
                                                                                carriers generally focus on point-to-point
                                                                                trips rather than those involving
                                                                                connections through centralized hubs.
                                                                                Lack of state or federal policies--and lack of
                                                                                financial support—to assure a healthy mix
                                                                                of ground travel options between
                                                                                metropolitan areas. Whereas explicit
A Megabus coach at the carrier’s San Jacinto Boulevard stop in
Austin, TX prepares for its afternoon run to Houston in September               federal policies for the development of rail
2020                                                                            corridors and airports exist, no substantive
                                                                                policies are in place for the creation of a
                                                                                balanced transportation system of bus and
                                                                                rail service (or specifically for bus services)
                                                                                between major cities—a problem explored
                                                                                in a recent Transportation Research Board
                                                                                publication.6

                                                                    7
An example of how service degradation can affect                      since it is not possible to measure the number of
the network occurred recently when Greyhound                          “extra sections” the carrier operates, which can be
discontinued express service on the Chicago –                         considerable during the holidays. Nevertheless,
Cincinnati, OH route. This resulted in sharply                        these results leave little doubt that the system was
increased travel time for nearly all passengers                       diminishing even before the pandemic. This trend is
booking travel on greyhound.com from Cincinnati to                    illustrated by the diminishing size of the Russell’s
the Illinois hub and points beyond. Slower trips and                  Guide, a compilation of timetables comprised
longer wait times when making transfers push away                     heavily of bus lines with interline agreements.
“riders of choice” who have other mobility options
at their disposal, further weakening the network.                     The pandemic has brought much more severe cuts,
                                                                      with some carries having cut schedules by 40% or
To illustrate these effects, we estimated the degree                  more since the start of the crisis. As schedule
to which bus lines encompassing the national                          flexibility falls, the risk grows that the network loses
network sold on the Greyhound CRS reduced                             its critical mass, denying Greyhound and its interline
schedules from early 2016 to February 2020, just                      partners the traffic densities they need to sustain
before the pandemic. (A schedule is usually                           both local and express service on many routes. This
associated with a distinct schedule number and                        could be driving more traffic away, as noted in
often involves multiple stops, akin to a numbered                     Finding 5.
airline flight).
                                                                      FINDING 4.
FIGURE 2: Reduction in Daily Schedules                                The duration of trips on the intercity bus
2015 – early 2020                                                     network has lengthened markedly over the
Changes in daily bus operations in the five years                     past several years as a result of schedule
leading up to the pandemic                                            cuts before and during the pandemic. On
                                                                      186 routes we evaluated in which the
                                                                      network is critical due to the lack of direct
                                                                      express coach or Amtrak service, the length
                                                                      of the average trip increased by more than
                                                                      an hour between 2016 to 2021. On more
                                                                      than a quarter (26%) of these routes, the
                                                                      trip is now two hours longer due to the need
                                                                      to make more stops and accept longer wait
This chart shows the reduction in schedules from 2015 to 2020,
immediately prior to the pandemic on Greyhound and smaller and
                                                                      times at transfer points.
mid-size bus lines sold on Greyhound.com. A schedule is defined
as a unique bus operation assigned a schedule number.                 We measured how much the duration of trips
                                                                      changed on 186 routes over the past five years to
The number of daily Greyhound operations                              assess the effects of the schedule cuts on travel
(schedules) fell by approximately 16%, whereas the                    times. Our sample consists of routes in which the
mid-size and smaller carriers we evaluated reduced                    national intercity bus network offers the only
schedules by about 4% (Figure 4). A wide variation                    scheduled ground travel option available that does
exists among the smaller carriers. Caution should                     not require “mixing modes” (such as transferring
be exercised in interpreting the Greyhound number                     from trains to buses). We recorded the fastest trip

                                                                  8
option available on greyhound.com departing Our analyses show that the mean (average) travel
between 7 a.m. and 8 p.m. on a Friday in May 2016 time rose on these routes from about 6 hours 14
and Friday, January 29, 2021. minutes (433.5 minutes) to 7 hours 26 minutes
(506.2 minutes), an increase of 72.7 minutes. That
Each of the 186 routes in our sample: represents a 16.8% increase over the less than five
Links two metropolitan regions, each having year period (Table 2). The median travel time rose
populations greater than 500,000. by almost an hour (55 minutes, or 12.8%). The
Involves a trip 150 – 400 miles based on increases were partially due to an increasing number
highway miles. of stops, which (when transfer points are included)
Lacks other scheduled ground travel rose from an average of 4.9 to 5.5 (12.6%), as well as
alternatives, such as direct express coach the need to make more transfers.
(e.g., Megabus) or Amtrak service. (Some of
the routes have Amtrak Thruway service, These changes have made bus travel too slow or
which combines bus and train travel). tedious to be considered a workable option for many
travelers. The number of routes with more than six
All of the routes in the sample can be comfortably stops rose from 47 to 55 (17.0%). The number of
driven between three and eight hours, including routes in which travel time exceeded ten hours more
allowances for brief stops. Examples of routes in the than doubled from 21 to 50 (a 138% increase). The
sample are Cleveland, OH – Scranton, PA; Kansas number of routes requiring more than 15 hours of
City, MO – Wichita, KS; and Las Vegas, NV – travel—a length nearly all passengers with other
Bakersfield, CA. options would consider unacceptable—rose from
two to 10.
TABLE 2: Degradation of Intercity Bus Service on 186 Routes without Daily Express Coach or Amtrak Service
Schedule Comparisons 2016 versus 2021, Routes 150 - 400 miles
2016 2020 CHANGE % CHANGE
Mean travel time (minutes) 433.5 506.2 72.7 17%
Median travel time (minutes) 430 485 55 13%
Average number of stops 4.9 5.5 0.6 13%
Number of routes > 10 hours 21 50 29 138%
Number of routes > 6 stops 47 55 8 17%
The frequency of routes with different travel time more significant on roughly four in ten routes
changes appears in Figure 3. About one in six routes (40.8%), in which travel times grew by an hour or
(14.5%) had a travel time improvement of 15 more. On a quarter of routes (25.3%), travel time
minutes or more. Unfortunately, more than four increased by two hours or more. 35 routes (19%)
times as many (56.9%) had travel time degradation experienced travel time increases of three hours or
in this range. The deterioration of service is even more (Table 3). The largest increase occurred in the
9Jacksonville – Ft. Myers, FL route. Travel time on Moreover, none of the routes in the sample are
this route grew from 10 hours 20 minutes to more major corridors. Most major corridors continue to
than 22 hours due to the lack of viable connections.7 have (or will have after the pandemic) high quality
Raleigh, NC – Knoxville, TN saw travel time increase bus service. Nevertheless, these results show why
from 8 hours 20 minutes to more than 18 hours. passengers who are traveling on secondary routes
Among the routes that had travel time may now think twice before going by bus.
improvements were Raleigh, NC – Charleston, WV
and Nashville, TN – Little Rock, AK. In both cases, Such schedule deterioration is detrimental to the
travel times dropped by two hours and 55 minutes. traveler experience and could delay the pace of
Regrettably, such success stories are comparatively recovery for the intercity bus industry. If bus lines
few in number. add back schedules in response to strengthening
demand as the pandemic eases, some of these
Some of the results may reflect the peculiarities of degradations could be reversed. The likelihood of
schedules on the particular days we evaluated. this, however, is unclear.
A RedCoach departure to Tallahassee, operated with a business class coach, is in the final stages of boarding in Orlando, FL
10Figure 3: Travel Time Change from 2016 to 2021
186 secondary routes in the 100 – 525 mile range, These results illustrate the need for governmental
pandemic schedules assistance to address the network’s precarious
condition. The risk is acute that bus lines that are
Service Service degradation part of the network could dramatically downsize (or
improved occurred on 57% of routes,
most requiring at least an even shut down entirely), which would hurt
extra hour of travel marginalized populations, the elderly, those living in
smaller towns and cities, and those who cannot (or
30% 28.5%
choose not to) drive.
25.3%
25% The Greyhound CRS is the only booking platform
with built-in capability to connect thousands of
20% points across the United States by bus involving
16.1% 15.6% itineraries supported by comprehensive interline
14.5%
15% agreements. Many booking sites, including
wanderu.com and busbud.com, rely on interfaces
10% with greyhound.com to support many of their
customer offerings. These sites have been critical to
5% making bus travel more attractive and convenient,
but neither they, nor Amtrak.com, megabus.com, or
0% any other existing booking site could fill the void if
Decreased No Increased Increased Increased the wide array of routes sold on the Greyhound
> 15 significant 15 - 59 1 to 2 > 2 hours
reservation system sharply diminished (Table 4).
minutes change minutes hours
The departure board at the Chicago Greyhound Station shows departures to a variety of Midwestern and Southern U.S. points in January 2021
11TABLE 3: Notable Routes in which Travel Times have Increased 3 hours or more
2016 to 2021, Pandemic Schedules
INCREASE IN
RANK ORIGIN DESTINATION MILES 2016 TIME 2021 TIME MINUTES
1 Jacksonville, FL Fort Myers, FL 317 10h 20m 22h 30m 730
2 Raleigh, NC Knoxville, TN 365 8h 20m 18h 45m 625
3 Birmingham, AL Little Rock, AR 374 9h 20m 16h 50m 450
4 Saint Louis, MO Madison, WI 360 10h 0m 17h 15m 435
5 Pittsburgh, PA Buffalo, NY 215 5h 45m 12h 40m 415
Youngstown,
6 Louisville, KY 388 9h 20m 15h 40m 380
OH
7 San Jose, CA Fresno, CA 152 3h 20m 9h 25m 365
8 Pittsburgh, PA Rochester, NY 284 8h 40m 14h 25m 345
Youngstown,
9 Philadelphia, PA 365 8h 40m 14h 20m 340
OH
10 Buffalo, NY Dayton, OH 397 9h 45m 15h 10m 325
11 Orlando, FL Fort Myers, FL 163 6h 5m 11h 30m 325
12 Nashville, TN Greenville, SC 347 7h 50m 13h 5m 315
13 Indianapolis, IN Knoxville, TN 361 9h 0m 14h 5m 305
14 Indianapolis, IN Akron, OH 299 7h 0m 11h 55m 295
15 Buffalo, NY Allentown, PA 355 9h 25m 14h 10m 285
16 Las Vegas, NV Oxnard, CA 325 7h 25m 12h 5m 280
17 Rochester, NY Allentown, PA 290 7h 45m 12h 25m 280
18 Cleveland, OH Scranton, PA 377 10h 55m 15h 30m 275
Youngstown,
19 Indianapolis, IN 347 8h 15m 12h 40m 265
OH
20 Kansas City, MO Wichita, KS 200 4h 10m 8h 15m 245
21 Philadelphia, PA Worcester, MA 273 7h 25m 11h 30m 245
22 Sacramento, CA Oxnard, CA 391 10h 0m 14h 5m 245
23 Birmingham, AL Columbia, SC 360 7h 0m 10h 55m 235
24 Nashville, TN Augusta, GA 400 8h 0m 11h 55m 235
25 San Jose, CA Bakersfield, CA 243 7h 0m 10h 45m 225
26 Las Vegas, NV Bakersfield, CA 286 5h 55m 9h 35m 220
27 Louisville, KY Charleston, WV 248 11h 45m 15h 20m 215
28 Cincinnati, OH Charleston, WV 207 9h 5m 12h 35m 210
29 Birmingham, AL Augusta, GA 294 5h 35m 9h 0m 205
30 Boston, MA Allentown, PA 332 7h 45m 11h 10m 205
31 Kansas City, MO Tulsa, OK 276 4h 15m 7h 40m 205
32 Norfolk, VA Columbia, SC 385 11h 40m 15h 5m 205
33 Milwaukee, WI Cincinnati, OH 391 10h 55m 14h 10m 195
34 Indianapolis, IN Cleveland, OH 318 6h 40m 9h 45m 185
35 Pittsburgh, PA Syracuse, NY 360 10h 20m 13h 25m 185
12FINDING 5:
Intercity buses remain the least expensive
travel option on the vast majority of the
country’s major routes. The budget
stretching benefits of bus travel are greatest
for those buying tickets only a few days
before departure, particularly during holiday
periods. Persistently low air and rail fares,
however, have posed an increasing threat on
mid-distance and longer-haul routes.
The importance of intercity bus service in providing
affordable transportation options to those with
limited economic resources (as well as the value it
provides to other types of travelers) is evident in our
newly collected data for the cost of travel in late
November and early January 2021 (Figure 4). This
analysis identified the lowest fares available for air,
bus, and rail travel for trips departing during daytime
hours (8:30 a.m. – 4 p.m.) in a stratified sample of 20
heavily traveled routes ranging from 100 - 525 miles
(via highway) in length. See the inset box for details
of our sampling process.
Bus fares for tickets bought three days in advance
Several families collect their baggage at the Greyhound Bus
were consistently below those for Amtrak and Terminal in Chicago on January 13, 2021. The wearing of
almost always well below airline travel, although the facemasks was strictly enforced at the station.
gap between bus and the other modes has narrowed
since November. Prices of tickets bought only a few
days before departure are particularly important for
bus travelers, as the vast majority book at most a
few days before their trip.
Average bus fares remained relatively stable in the
$38 - $42 range over the five periods we observed.
Average train (Amtrak) fares fluctuated to a higher
degree, but never cumulatively fell below bus fare.
13Figure 4: Average Fares with a Three-Day Advance Purchase by Mode
20 Prominent Routes in 100 – 525 mile range
$140
$136.13 $131
$120 $127.94 $126.17 $124.15 $125.69
$100
$80
$59
$60 $52
$43 $41 $43 $42
$40 $39
$43
$39 $39 $39 $36
$20
$0
Nov. 10 Nov. 24 Dec. 8 Dec. 22 Jan. 5 Jan. 19
3 DAY AP Bus 3 DAY AP Rail 3 DAY AP Air
This chart shows the average fare on 20 routes over the past three months by booking date. Intercity bus fares were lowest in all periods
evaluated. Amtrak fares rose appreciably for booking during holiday periods, which is shown with shading. Airfares, while much higher, have
gradually come down in recent weeks.
The monetary savings from bus travel are greatest observed as more than $75, and in many
during holiday periods, when Amtrak tends to cases more than $120.
engage in premium pricing more aggressively than
bus lines.
Our analysis shows that bus fares:
During the Christmas holiday averaged $13
(25%) less than train tickets for three day
advance purchases and $7 (14.6%) less for
10-day advance purchases.
Over all five periods, averaged $6 (16.1%)
less than train tickets for three day advance
purchases and $5 (12.2%) less for 10-day
advance purchases. Passengers board and alight the westbound California Zephyr at
the Galesburg, IL station, a multimodal hub also served by
Are only a small fraction of air fares, with Burlington Trailways, which offers Amtrak Thruway connections to
one-way savings during each time period Bloomington-Normal, IL and other points
14B U SE S, P LA NE S , A ND T R AI N S: H OW W E C O MP A RE D FA RE S
The analysis considered the lowest fare bus or train option between 8:30am and 4:00pm (local time for the departure city).
The options considered were limited to those no more than 90 minutes longer than the shortest trip duration anytime
during the day. Both 3- and 10-day advance purchase scenarios were considered. Bus fares were collected by viewing all
options on megabus.com and Wandru.com, and included applicable booking fees imposed by carriers. Airfares were based
on all options on Orbitz.com and Southwest.com. Carriers with “unbundled” pricing such as Frontier are excluded due to
their add-on costs to basic tickets.
Routes: Fare were collected on 20 routes: Atlanta, GA – Nashville, TN*; Boston, MA - New York, NY; Chicago, IL – Detroit,
MI; Chicago, IL - St. Louis, MO; Dallas/Ft. Worth, TX - San Antonio, TX; Dallas/Ft Worth, TX* - Houston, TX; Denver, CO - Salt
Lake City, UT; New York, NY– Washington, DC; Buffalo, NY- New York, NY; New York, NY– Pittsburgh, PA; New York, NY-
Providence, RI^; Miami, FL – Orlando, FL; Milwaukee, WI - Minneapolis/St. Paul, MN; Los Angeles, CA - San Francisco, CA+;
Los Angeles, CA – Phoenix, AZ; Portland, OR – Seattle, WA; Seattle, WA – Spokane, WA; Memphis, TN - New Orleans, LA;
Philadelphia, PA - Washington, DC^
Symbols:
* no Amtrak; + Used Oakland, CA for Amtrak fares; ^Air fares not included due to short travel distance
The upper bound on bus fares tends to be relatively discount airfares less rare. Fewer travelers whose
low. The most expensive “lowest fare” observed preferred option is flying are now likely to default to
during any of the five periods evaluated was a $91 buses due to issues of affordability.
Greyhound ticket booked three days in advance for
travel on Saturday, November 28, during the FINDING 6:
Thanksgiving holiday. That fare was for the Denver, Amtrak is proving to be a particularly
CO to Salt Lake City route, a 510 mile trip, making it
vigorous competitor to bus lines during early
the longest route in the sample. Although
Greyhound had no direct bus or rail transportation
2021. Those booking trips 10 days in
competition on the day we observed (as Amtrak is advance will find fares on the passenger
tri-weekly), it still charged less than 18 cents per railroad below those for bus travel on about
mile, which is below the variable cost of driving a a third (35%) of the routes evaluated. This
medium sedan (gas, tire wear and other operating vigorous discounting is partially in response
costs).
to Amtrak’s diminished schedule frequency
The growing tendency for discounted airfares
in many corridors.
available for last minute buyers is less favorable for
The Boston – New York route illustrates the intensity
bus travel. This tendency is made evident by the
of competition provided by Amtrak. On this 215
downward trend in three day advance purchase
mile corridor, the lowest Amtrak fare for a passenger
airfares shown in Figure 4. As recently as 2017, it
buying a ticket on January 4, 2021 for a trip three
was rare for “walkup” airfares to be priced
days later was $58. That fare made travel by train
comparatively to fares for bookings a week or two in
nearly twice as expensive as the $30 bus fare for the
advance. The pandemic has made these “walkup”
15same travel corridor. However, an Amtrak passenger during which bus travel booked 10 days in advance
who booked a ticket on that same date for a trip 10 was cheapest on 85% and 80% of routes
days in advance was offered a $39 fare, just $9 more respectively.
than the cheapest bus ticket (which remained $30).
This “airline style” pricing appears to target We believe that the heightened price competition
passengers who book ahead, which likely accounts from Amtrak in recent months is the result of both
for a large share of the market during the pandemic. the soft demand conditions that characterize this
Considering that most Amtrak trips are faster than time of year and the continuing effects of the second
motorcoach trips on this route (even without wave of the pandemic. Amtrak’s liberal rules on
upgrading to Amtrak Acela service), such discounted ticket changes and cancellations further nullify some
train fares could weaken a post-pandemic recovery of the advantages of bus lines, many have generally
of bus traffic. Indeed, Amtrak’s promotional fares in made it easy to change tickets.
the Northeast have garnered much attention.
We anticipate that by summer Amtrak will use its
Throughout our data, we found that train fares tend yield-management system to push prices upward,
to be much more closely priced to bus fares for restoring the larger gap between train and bus fares
buyers who book well in advance. In early January that existed prior to the pandemic. The degree to
2021, the percentage of the 20 routes in which bus which this occurs will depend on whether Amtrak
travel was the least expensive fell to 60 - 65% for restores daily service on long distance routes and
trips purchased 10 days ahead of departure. That is returns short- and medium-distance service to pre-
the lowest rate observed in the entire sample (Figure pandemic levels.
5). These results contrast sharply with those from
around the Thanksgiving and Christmas holidays,
FIGURE 5: Percentage of Routes in which Bus Fares are lower than Air and Rail Fares
20 Prominent Routes in 100 – 525 mile range
90% 85%
80% 80%
80% 75% 75% 75%
70%
70% 65% 65%
60% 60% 60%
60%
50%
40%
30%
20%
10%
0%
Nov. 9, 2020 Nov. 23, 2020 Dec. 7, 2020 Dec. 21, 2020 Jan. 4, 2021 Jan. 17. 2021
% Routes with Bus Least Costly 3 day Adv. Purchase
% Routes with Bus Least Costly 10 day Adv.…
This chart shows the percentage of the 20 routes sampled in which bus travel was the lowest cost option available under different advance
purchase scenarios. The percentage fell to 60 - 65% for tickets bought 10 days in advance in early January, largely due to steep Amtrak
discounting.
16FINDING 7. To appreciate the mismatch between the $2 billion
The Coronavirus Economic Relief for provided and actual needs, consider that based on
our estimates the revenue loss for scheduled
Transportation Services Act, passed in late
intercity bus lines alone could exceed $1.5 billion
December 2020, provides temporary relief during the first year of the pandemic. Additionally,
for the ailing intercity bus industry. The there will be further losses in Pandemic Year 2.
amount of financial support set aside for the Passenger airlines have received (or are set to
motorcoach industry in this legislation, receive) more than ten times as much direct support
however, is relatively meager. Additionally, as all types of over-the-road bus operators
combined. Billions more have been awarded to
it does not address the systemic problems
airports and airport contractors. Amtrak has also
facing the sector, many of which emerged received extensive supplemental funding, although
before the pandemic and have now reached its financial woes resulted in the temporary
crisis proportions. reduction of many long distance train schedules
from daily to tri-weekly in October 2020.
The $2 billion set aside mostly for motorcoach
operators in the Coronavirus Economic Relief for The relief offered to the motorcoach operators,
Transportation Services (CERTS) Act is far short of based on our calculations, has been proportionally
the $10 billion the American Bus Association (ABA), far less than would be appropriate considering the
United Motorcoach Association, and others enormous size of the sector (ABA estimates that,
advocated. The funding does come at a pivotal time. pre-pandemic, motor coaches handled 756 million
It will partially close a financial gap that has left annual trips).8 The $10 billion requested would have
many bus lines teetering on a financial cliff. Some been more in line with the support provided to other
operators, such as the Coach USA unit Lakefront modes than the modest sum provided in the CERTS
Lines and several suburban operators have already Act. As Mike Weinman of PTSI Transportation
closed. If more follow suit it could cripple mobility noted, the funding shortfall could be partially due to
for vulnerable segments of society. intercity buses being “out of sight, out of mind” for
many legislators in Washington.9
The $2 billion will be divided among many different
sectors, including private school bus operators, On a more favorable note, federal and state support
charter buses, tour operators, scheduled bus lines, for rural and tribal intercity bus services, including
and private commuter lines. Private passenger that provided through the Federal 5311(b) program,
carrying vessels (e.g., ferries) are also included, have continued through the pandemic. This has
further dividing the available funds. Funding will allowed many secondary routes, particularly those
likely come in the form of both grants and loans, serving urbanized areas with populations less than
although critical details are not yet clear. 200,000, to continue. The development of these
routes depends heavily on the strength of the
national bus network, as described in Finding 5.
17CONCLUSIONS AND PROGNOSTICATIONS
The intercity bus industry’s long term place on the country’s transportation landscape, despite the present
challenges, seems secure. The near term outlook, however, is less sanguine. We expect the following for the
remainder of the year and into 2022.
PREDICTION #1.
A move by a major carrier (or perhaps some combination of smaller carriers), to dramatically
downsize service, or even shut down entirely and dispose of equipment will occur unless a more
favorable set of policies emerge from Washington.
Although we are bullish about the sector’s long term potential, we are concerned about the near term and believe
that the flow of red ink could trigger a major downsizing event. This could be forestalled if the Biden
Administration sets into motion a more assertive federal response to the industry’s financial losses, but the
prospects for that remains unclear.
PREDICTION #2.
A recovery in traffic will start around mid-July, when travel demand typically is near its summer
peak, air and rail fares rise in response to seasonal demand, and vaccines are widely
administered to all age groups.
Almost all universities should return to in-person classes by late summer, and we expect to see renewed life in the
central business districts of major cities—the lifeblood of many intercity bus services. Although demand will not
likely return to levels approaching pre-pandemic levels for several years, the warmer months will bring back a
sense of normalcy to a beleaguered industry. We believe summer bookings could rise toward 60 percent of pre-
pandemic levels by the end of summer, roughly twice the rate today. The financial strain facing bus companies will
continue, but conditions, thankfully, will have greatly improved.
PREDICTION #3.
Pro-rail policies of the Biden Presidency will foster enhanced coordination between intercity bus
and Amtrak services.
Amtrak has devoted considerable resources to developing the Amtrak Thruway system prior to the pandemic, with
particularly impressive programs in place in California, Michigan, Oregon, and other states. Indeed, much of the
success of the Amtrak Thruway network has been due to state direction and investment. The Thruway system,
however, has yet to reach its potential. Due to the profound effects of the pandemic, and President Biden’s
anticipated support for both Amtrak and public transit, more forceful efforts to leverage the combined strength of
the bus and rail systems seem probable. Funding for new and enhanced downtown terminals and intermodal
transportation centers, more incentives to provide bus routes into underserved areas, and more aggressive use of
buses to complement Amtrak service in corridors could be in the offing.
18PREDICTION #4.
Flixbus, Greyhound, and Megabus will accelerate efforts to expand their booking platforms by
adding the services of other carriers that operate as independent brands, including new publicly
funded routes to rural and mid-size communities.
We anticipate that Greyhound, Megabus, and Flixbus will work aggressively to add more services to their booking
platforms through partnerships with smaller carriers that operate under separate brand identities. Greyhound has
long been doing this, and Megabus and Flixbus took notable took steps in this direction in 2020. We expect that
more such additions are to come, including new publicly funded services. Funding for service to rural communities
and small cities appears poised to expand (and, in fact, needs to expand) as the result of the financial difficulty of
sustaining routes in a world forever changed by COVID-19. Megabus’s addition of the Virginia Breeze, a state
supported service enjoying great success prior to the pandemic, provides a glimpse of the enhanced integration we
expect to become more common. Booking aggregator sites such as BusBud and Wanderu, meanwhile, will
continue to innovate and develop new ways to promote services that have in the past suffered from a lack of
brand awareness.
PREDICTION #5.
There will be more aggressive expansion by “asset-light” brands such as FlixBus and OurBus,
which employ business models that give them more versatility.
Although the entire industry has suffered enormously during the pandemic, carriers that outsource their
operations, such as Flixbus and OurBus are in a somewhat better position to respond rapidly to post-pandemic
changes in demand. We anticipate that the presence of these carriers will continue to grow across the country, in
some cases filling the void left by more traditional carriers that have downsized.
Regardless of whether or not all or some of our predictions come true, the next year will be a pivotal time for the
industry.
A Miller Transportation/Hoosier Ride bus arriving from Indiana at the Chicago Greyhound Terminal
19REGIONAL BOOKINGS
This chart shows year-over-year changes in bookings observed by Transcor Data Service. This information was
compiled and aggregated from TDS’s clients, who operate in most areas of the country, but not all.
US REGION: MIDWEST US REGION: SOUTHEAST
US REGION: SOUTHWEST US REGION: WEST
US REGION: NORTHEAST
20AUTHOR INFORMATION
JOSEPH P. SCHWIETERMAN, PH.D., a professor of Public Service Management and
director of the Chaddick Institute for Metropolitan Development at DePaul
University, is a nationally known authority on transportation and urban economics.
He has testified three times on transportation issues before subcommittees of the
U.S. Congress. Schwieterman holds a Ph.D. in public policy from the University of
Chicago and is president of the Chicago chapter of the Transportation Research
Forum. He is widely published on intercity bus and rail travel.
BRIAN ANTOLIN is an entrepreneur, consultant, and researcher following his
childhood love for travel and transportation. As a respected thought leader in public
transportation, Brian’s research and commentary has been cited in numerous
national publications including the Boston Globe, Philadelphia Inquirer, New York
Times, and regional affiliates of National Public Radio. Prior to launching his tour and
transportation company, CoTo Travel, Brian worked for BoltBus, a division of
Greyhound Lines, Inc., in various operations and management positions.
CRYSTAL BELL is the program manager for the Chaddick Institute for
Metropolitan development and a graduate student studying public policy in
DePaul University’s School of Public Service. She has assisted in the
development of Chaddick’s Intercity Bus E-News publications. Crystal also
provided technical assistance for Chaddick’s recent research publications
investigating the rapid growth of Amazon Air.
THE CHADDICK INSTITUTE, WHICH PROMOTES EFFECTIVE PLANNING AND TRANSPORTATION, DOES NOT RECEIVE FINANCIAL SUPPORT
FROM INTERCITY BUS LINES OR SUPPLIERS OF BUS OPERATORS.
Would you like to join our intercity bus listserv? We send approximately 8 – 10 emails annually (no spam). Contact
chaddick@depaul.edu or call 312.362.5731.
Photo captions and credits for cover photos can be found through this report except the bottom center photo. We include the
latter photo, taken at a bus top at an international airport, to illustrate the global effects of the pandemic on bus travel.
21RELATED STUDIES BY THE CHADDICK INSTITUTE
Making Connections: 2020 Outlook for the Intercity Bus
Industry in the United States
January 30, 2020
Our analysis of the state of the intercity bus industry in 2019
highlights notable service changes and includes an interactive
map of premium service routes.
The Evolution of New York – Washington Intercity Bus Service:
2000 to 2020
March 2020
Our analysis of the evolution of regionally focused intercity bus
networks highlights the New York City to Washington, DC corridor.
22REFERENCES
Antolin, Brian (2020). The Evolution of New York-Washington Intercity Bus Service: 2000 to 2020, Chaddick
Institute for Metropolitan Development, DePaul University.*
Chaddick Institute for Metropolitan Development (2015). Adding Amenities, Broadening the Base: 2014 Year in
Review of Intercity Bus Service in the United States. DePaul University. Authors: Schweiterman, Joseph, Brian
Antolin, Marisa Schultz, Gary Scott, and Martin Sellers.*
Chaddick Institute for Metropolitan Development. (2016). The Remaking of the Motor Coach: 2015 Year in Review
of Intercity Bus Service in the United States. DePaul University. Authors: Schwieterman, Joseph, Brian Antolin,
Alexander Levin, Matthew Michel, and Heather Spray.*
Chaddick Institute for Metropolitan Development (2017). Running Express: 2017 Outlook for the Intercity Bus
Industry in the United States. DePaul University. Authors: Schwieterman, Joseph and Brian Antolin.*
Chaddick Institute for Metropolitan Development. (2018). Driving Demand: 2018 Outlook for the Intercity Bus
Industry in the United States. DePaul University. Authors: Schwieterman, Joseph and Brian Antolin.*
Chaddick Institute for Metropolitan Development (2019). New Directions: 2019 Outlook for the Intercity Bus
Industry in the United States. DePaul University. Authors: Schwieterman, Joseph, Brian Antolin, Matthew
Jacques.*
Chaddick Institute for Metropolitan Development Schwieterman. (2020). Making Connections: 2020 Outlook for
the Intercity Bus Industry in the United States. DePaul University. Authors: Joseph Schwieterman and Brian
Antolin.*
Elking, Issac and Robert Windle, Examining Differences in Short-Haul and Long-Haul Markets in US Commercial
Airline Passenger Demand, Transportation Journal, 53 (4) (Fall 2014), 424-452.
Federal Transit Administration. (2002). TCP Report 79: Effective Approaches to Meeting Rural Intercity Bus
Transportation Needs. Transit Research Cooperative Program, Washington, DC.
Grengs, Joe. (2009). Intercity Bus and Passenger Rail Study: Prepared for the Michigan Department of
Transportation, University of Michigan Department of Architecture and Urban Planning.
Hall, David. (2013) The Intercity Bus Renaissance: One Company’s Experiences, TR News: A Publication of the
Transportation Research Board, 303 (May/June 2013), 11–16.
Hough, Jill and Jeremy Mattson, (2016). The Changing State of Rural Transit. TR News: A Publication of the
Transportation Research Board, 303 (May/June 2013), 34–37.
Klein, Nicholas J. (2015). Get on the (curbside) bus: The new Intercity Bus. Journal of Transport and Land use, 8(1),
155.
23RSG, Inc. (2016). Developing Refined Estimates of Intercity Bus Ridership. Prepared for the Federal Highway
Administration (April 23, 2015).
Schwieterman, Joseph P., Lauren Fischer, Sara Smith, and Christine Towles. (2007). The Return of the Intercity Bus:
The Decline and Recovery of Scheduled Service to American Cities, 1960 - 2007. Chaddick Institute for
Metropolitan Development, DePaul University.*
Schwieterman, Joseph and Lauren Fischer. (2012a). Competition from the Curb: Survey of Passengers on Discount
Curbside Bus Operators in Eastern and Midwestern Cities. Transportation Research Record, 227, 49–56.
Schwieterman, Joseph and Lauren Fischer. (2012b). The Decline and Recovery of Intercity Bus Service in the United
States: A Comeback for an Environmentally Friendly Transportation Mode. Environmental Practice, 13, 7–15.
Schwieterman, Joseph, Justin Kohls, Marisa Schultz, and Kate Witherspoon. (2014). The Traveler’s Tradeoff:
Comparing Intercity Bus, Plane, and Train Fares Across the United States. Chaddick Institute for Metropolitan
Development, DePaul University.*
Transportation Research Board. (2016). Interregional Travel: A New Perspective for Policy Making. Transportation
Research Board Special Report 320.
U.S. General Accounting Office (USGAO). (1992). Surface Transportation: The Availability of Intercity Bus Service
Continues to Decline. GAO/RECD-92-126. USGAO, Washington, DC.
Walsh, M. (2000). Making Connections: The Long-Distance Bus Industry in the USA. Ashgate, Aldershot, UK.
* study with free download available on the publications page at chaddick.depaul.edu
ENDNOTES
1 ROX’s new Virginia Beach service was suspended in August, 2021 due to COVID-19.
2 We thank the staff at PTSI Transportation for this insight.
3 The new route from Denver to Craig, like several of Bustang’s routes, is a recreation of a former Denver & Rio Grande Western
Railroad passenger service (in this case, the train known as the Yampa Valley Mail). We thank Mike Weinman at PTSI for this
insight.
4 Bus travelers tend to be provided fewer services when missing connections than airline travelers. In some cases, such as in
cases of mechanical problems, airlines are required to provide hotels and meals. This requirement is largely nonexistent for bus
travelers.
5 For a summary of the rise in immigrant travel, see Chaddick’s Making Connections: 2020 Outlook for the Intercity Bus Industry
in the United States.
6 See Transportation Research Board. (2016). Interregional Travel: A New Perspective for Policy Making. Transportation
Research Board Special Report 320 for a discussion of the problem of multi-modal planning in corridors 100 – 500 miles.
7 RedCoach operates connecting service on this route, provided with both business- and first-class buses.
8 See the American Bus Foundation’s 2019 Census report, available at https://www.buses.org/aba-foundation/research-
summary/motorcoach-census-2019
9 We thank Mike Weinman at PTSI Transportation for assisting in editing this section and providing us his insights on January 27,
2021.
Version 2
24You can also read