On the Reduction of NCEP GFS Systematic Biases with FV3 Dycore and Advanced Microphysics Fanglin Yang
←
→
Page content transcription
If your browser does not render page correctly, please read the page content below
On the Reduction of NCEP GFS Systematic Biases with
       FV3 Dycore and Advanced Microphysics

                             Fanglin Yang

                      Environmental Modeling Center
               National Centers for Environmental Prediction
                          College Park, Maryland, USA

    33rd session on the CAS/WCRP Working Group on Numerical Experimentation.
                         Tokyo, Japan , 9 - 12 October 2018

                                                                               1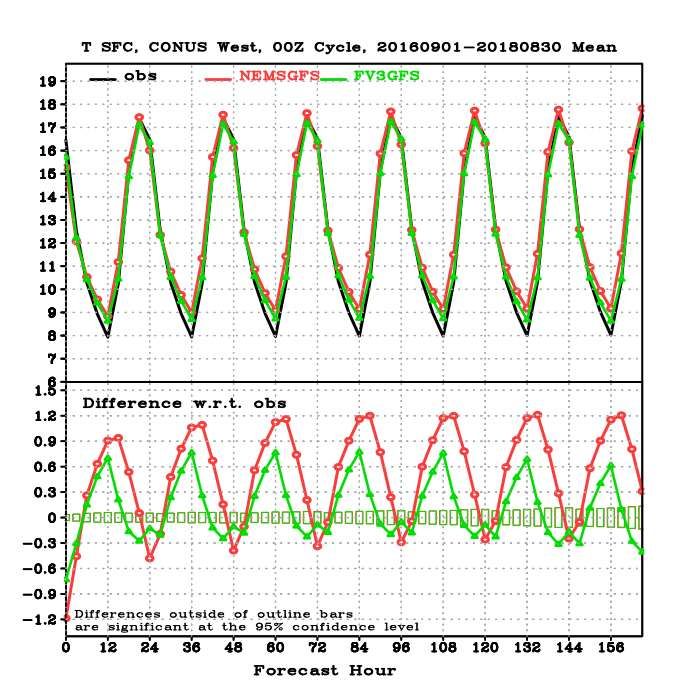
Change History of GFS Configurations

   Mon/Year    Lev      Truncations      Z-cor/dyncore    Major components upgrade

Aug 1980      12        R30 (375km)     Sigma Eulerian    first global spectral model, rhomboidal

 Oct 1983     12        R40 (300km)     Sigma Eulerian

Apr 1985      18        R40 (300km)     Sigma Eulerian    GFDL Physics

Aug 1987      18        T80 (150km)     Sigma Eulerian    First triangular truncation; diurnal cycle

Mar 1991      18        T126 (105km)    Sigma Eulerian

Aug 1993      28        T126 (105km)    Sigma Eulerian    Arakawa-Schubert convection

Jun 1998      42        T170 (80km)     Sigma Eulerian    Prognostic ozone; SW from GFDL to NASA

Oct 1998      28        T170 (80km)     Sigma Eulerian    the restoration

Jan 2000      42        T170 (80km)     Sigma Eulerian    first on IBM

Oct 2002      64        T254 (55km)     Sigma Eulerian    RRTM LW;

May 2005      64        T382 (35km)     Sigma Eulerian    2L OSU to 4L NOAH LSM; high-res to 180hr

May 2007      64        T382 (35km)     Hybrid Eulerian   SSI to GSI

 Jul 2010     64        T574 (23km)     Hybrid Eulerian   RRTM SW; New shallow cnvtion; TVD tracer

 Jan 2015     64        T1534 (13km)   Hybrid Semi-Lag    SLG; Hybrid EDMF; McICA etc

May2016       64        T1534 (13km)   Hybrid Semi-Lag    4-D Hybrid En-Var DA

 Jun2017      64        T1534 (13km)   Hybrid Semi-Lag    NEMS GSM, advanced physics

JAN 2019      64        FV3 (13km)       Finite-Volume    NGGPS FV3 dycore, GFDL MP

                     GSM has been in service for NWS operation for 38 years !                          2
                                                                                                           2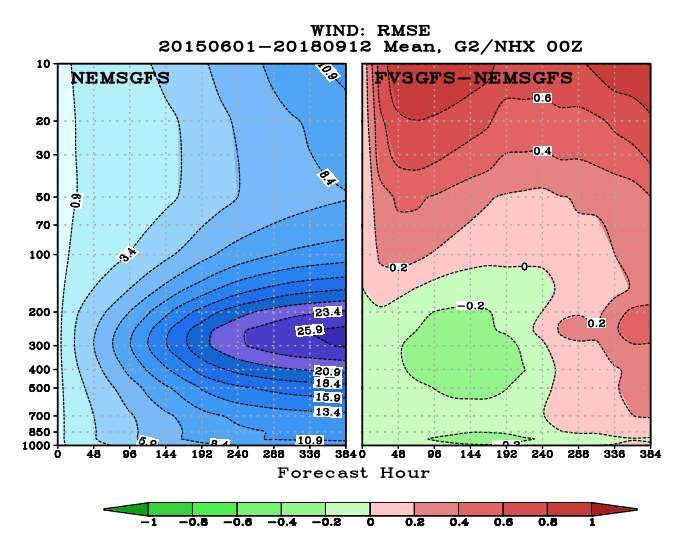
NOAA’s Next Generation Global Prediction System
                              NGGPS v1
   FV3GFS is being configured to replace spectral model (NEMS GSM) in operations in Q2FY19

Configuration:                              Schedule:
● FV3GFS C768 (~13km                        ●   3/7/18: code freeze of FV3GFS-V1 (GFS
  deterministic)                                V15.0)
                                            ●   3/30/18: Public release of FV3GFS-V1
● GFS Physics + GFDL                        ●   4/1 – 1/25/19: real-time EMC parallel
  Microphysics                              ●   5/25 – 9/10/18: retrospectives and case
                                                studies (May 2015 – September 2018;
                                                three summers and three winters)
● FV3GDAS C384 (~25km, 80
  member ensemble)                          ●   9/24/2018: Field evaluation due; EMC
                                                CCB
                                            ●   10/01/2018: OD Brief, code hand-off to
● 64 layer, top at 0.2 hPa
                                                NCO
                                            ●   12/20/2018-1/20/2019: NCO 30-day IT
● Uniform resolution for all 16                 Test
  days of forecast
                                            ●   1/24/2019: Implementation
                                                                                             3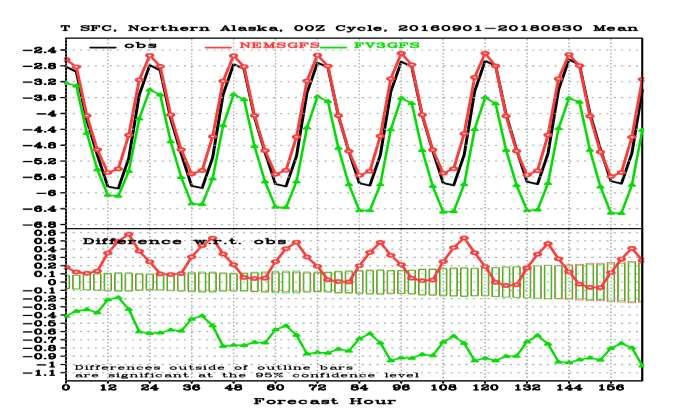
Model: Infrastructure & Physics Upgrades

➢   Integrated FV3 dycore into NEMS       ➢ New parameterization of middle
                                             atmospheric water vapor
➢   Added IPD in NEMSfv3gfs
                                             photochemistry

➢   Newly developed write grid            ➢ a revised bare soil evaporation
    component -- write out model             scheme.
    history in native cubed sphere grid
    and Gaussian grid                     ➢ Modify convection schemes to reduce
                                             excessive cloud top cooling
➢   Replaced Zhao-Carr/Sundqvist
    microphysics with the more            ➢ Updated Stochastic physics
    advanced GFDL microphysics
                                          ➢ Improved NSST in FV3
➢   Updated parameterization of ozone
    photochemistry with additional
    production and loss terms             ➢ Use GMTED2010 terrain to replace
                                             TOPO30 terrain

                                                                                  4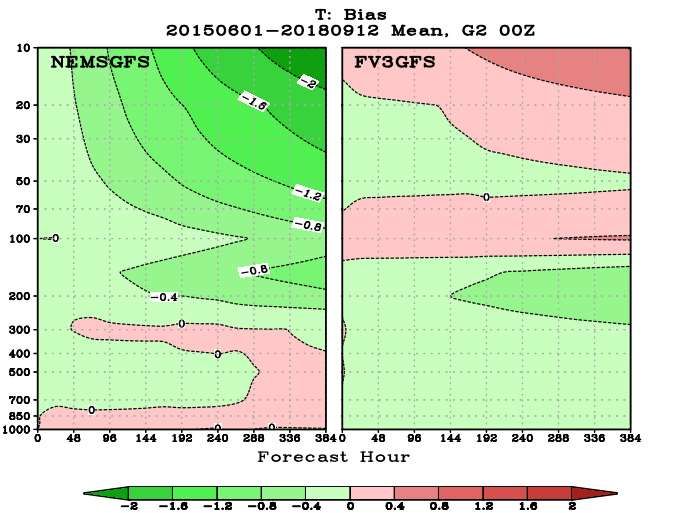
GFDL FV3 Dycore and Microphysics

          GSM                                 Zhao-Carr MP
         Spectral                        Prognostic could species: one
         Gaussian                              total cloud water
        Hydrostatic
      64-bit precision
                                                  GFDL MP
                                            Prognostics cloud species : five
                                             Liquid, ice, snow, graupel, rain

                                          more sophisticated cloud processes
       Finite-volume
       Cubed-Sphere
      non-hydrostatic
      32-bit precision

Physics still runs at 64-bit precision
                                                                                5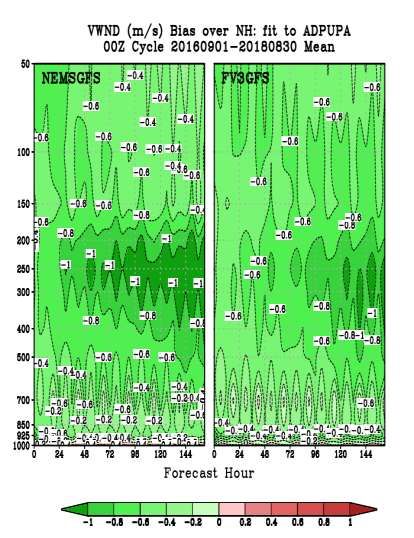
Revised Bare-Soil Evaporation
               For Reducing Dry and Warm Biases

                                                The latent heat flux now
                                                contributed more from the bare
                                                soil evaporation which is directly
                                                dependent on the first layer soil
                                                moisture. Thus we have strong
                                                and fast coupling between precip
                                                and soil moisture.

   But ECMWF uses the table below                The goal is to keep or
NLDS                  GFS - NLDS                 increase the latent heat flux
                                                 while keeping the deep soil
                                                 moisture intact
                      4th-layer Soil Moisture
                        Credit: Helin Wei
                      Reduced dry bias
FV3 - NLDS
                                                                    From: Helin Wei
                                                                                      6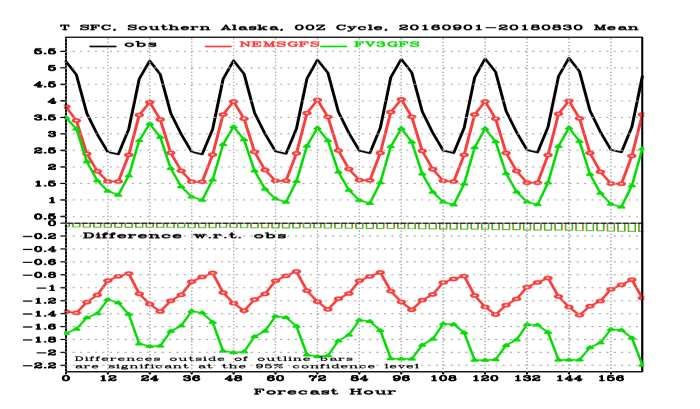
Updated Ozone Physics in FV3GFS
Funded by NOAA Climate Program Office
Naval Research Laboratory CHEM2D Ozone Photochemistry Parameterization
(CHEM2D-OPP, McCormack et al. (2006))
( P L) ( P L) ( P L)
t
( P L) ( P L ) 0
O3 0
O 3 O 3
T 0
T T
cO3 0
cO3 cO3
NEMS GSM FV3GFS
Includes reference Additional dependences
tendency and on temperature
dependence on O3 and column total ozone
mixing ratio
Reference tendency (P-L)0 and all partial derivatives are computed from odd oxygen (Ox ≡
O3+O) reaction rates in the CHEM2D photochemical transport model.
CHEM2D is a global model extending from the surface to ~120 km that solves 280 chemical
reactions for 100 different species within a transformed Eulerian mean framework with fully
interactive radiative heating and dynamics.
O 3 prognostic Ozone mixing ratio
T Temperature
cO 3 column ozone above From: Shrivinas Moorthi
7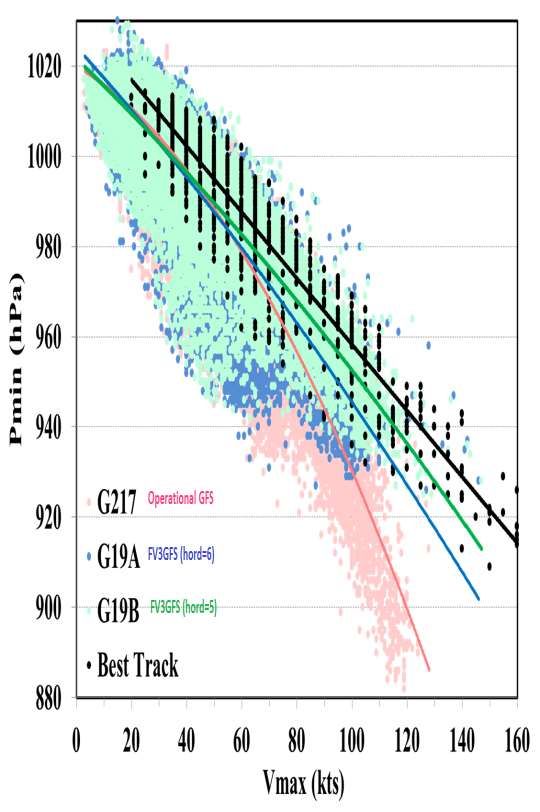
Water Vapor Sources and Sinks
in the Stratosphere/Mesosphere
This new scheme is based on “Parameterization of middle atmospheric
water vapor photochemistry for high-altitude NWP and data assimilation”
by McCormack et al. (2008), from NRL
Accounts for the altitude, latitude, and seasonal variations in the
photochemical sources and sinks of water vapor over the pressure region
from 100–0.001hPa (∼16–90km altitude)
Monthly and zonal mean H2O production and loss rates are provided by
NRL based on the CHEM2D zonally averaged photochemical-transport
model of the middle atmosphere
The scheme mirrors that of ozone, with only production and loss terms.
From: Shrivinas Moorthi
8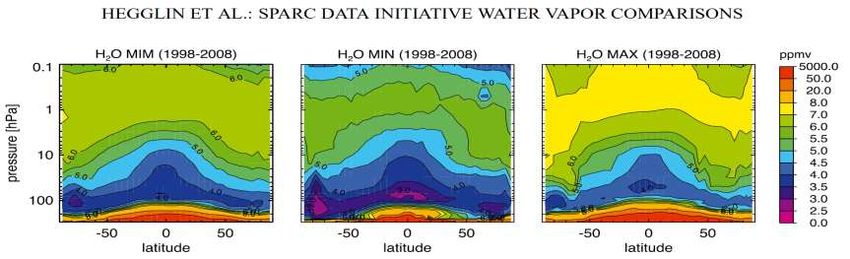
Terrain: GMTED2010 vs GTOPO30

  GMTED2010:                                        GMTED minus GTOPO30
  A more accurate replacement for GTOPO30
  data, created by USGS in 2010. Primarily                                > 1000 m
  derived from NASA Shuttle Radar Topography
  Mission (SRTM) data.

                      South America                 Greenland

                                                    DIFFERENCES IN GREENLAND ARE LARGE
                                                    IN MAGNITUDE AND AREAL EXTENT.

           2000 m
                                                        GMTED2010 – Terrain height

         HEIGHT                       DIFFERENCE
                                      in STANDARD
                                      DEVIATION

From: George Gayno & Fanglin Yang
                                                                                         9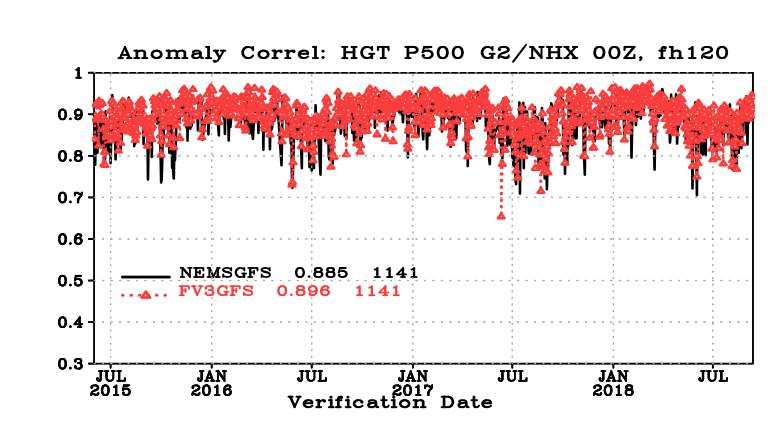
DA: Infrastructure Changes

• Improved GSI code efficiency

• The GSI does not currently have the capability to operate on a non-rectangular
  grid. Forecasts are therefore provided via the FV3 write-grid component on the
  Gaussian grid required by the GSI. Increments are interpolated back on the
  cube-sphere grid within the FV3 model itself.

• Both the analysis and EnKF components are now performed at one-half of the
  deterministic forecast resolution (increased from one-third in current
  operations) and is now C384 (~26km) instead of 35km. This reduced issues
  when interpolating between ensemble and control resolutions.

• Tropical cyclone relocation is omitted from the implementation, as is the full
  field digital filter.

• The current operational GDAS/GFS system uses a total (non-precipitating) cloud
  condensate, whereas the FV3-GFS has five separate hydrometeor variables.

                                                                From: DA Team
                                                                                   10
DA Infrastructure Changes – cont’d
• The initial FV3 data assimilation scheme retains the total cloud condensate
control variable by combining liquid water and ice amounts from the model,
but avoids issues with how to split the analysis increments into the component
species by not feeding the increment back at all.
– This approach (treating the cloud as a “sink variable”) will still update the
other model fields to be consistent with the cloud increment through
the multivariate error correlation in the background error specification
while also mitigating “spin-down” issues seen in current operations.
• Only the SHUM (Stochastically Perturbed Boundary Layer Specific Humidity)
and SPPT (Stochastically Perturbed Physics Tendencies) are included as
stochastic physics in the EnKF. The SKEB (Stochastic Energy Backscatter)
was not available to be used at the time the code was frozen, and amplitude
parameters for SHUM and SPPT were modified to compensate.
From: DA Team
11Retrospective and Real-Time Parallels
Three and an half years of retrospective runs
http://www.emc.ncep.noaa.gov/gmb/emc.glopara/vsdb/prfv3rt1 real-time parallel
http://www.emc.ncep.noaa.gov/gmb/emc.glopara/vsdb/fv3q2fy19retro1c hord=5, Dec2017 ~ Aug2018
http://www.emc.ncep.noaa.gov/gmb/emc.glopara/vsdb/fv3q2fy19retro2c hord=5, Jun2017 ~ Nov2018
http://www.emc.ncep.noaa.gov/gmb/emc.glopara/vsdb/fv3q2fy19retro4c hord=5, Jun2016 ~ Nov2016 In total
http://www.emc.ncep.noaa.gov/gmb/emc.glopara/vsdb/fv3q2fy19retro6c hord=5, Jun2015 ~ Nov2015 11 streams,
2000 days,
8000 cycles
Aggregated STATS
http://www.emc.ncep.noaa.gov/gmb/emc.glopara/vsdb/gfs2019b
Comparing NEMS GFS with FV3GFS, including all cases from hord5 runs,
and 2015 and 2016 winter/spring streams with hord6.
http://www.emc.ncep.noaa.gov/users/Alicia.Bentley/fv3gfs/ MEG evaluation page
http://www.emc.ncep.noaa.gov/gmb/STATS_vsdb/ International models
12NH 500-hPa HGT Anomaly Correlation
(20150601 ~ 20180912)
Day-5
Annual Mean day-5 ACC, GFS - CFSR
0.06
0.04 NH:GFS-CFSR
0.02 SH:GFS-CFSR
0
A gain of 0.011
-0.02
-0.04
-0.06
Die-off
-0.08
-0.1 2008~2017 gain: 0.04
-0.12
-0.14
-0.16
1987
1988
1989
1990
1991
1992
1993
1994
1995
1996
1997
1998
1999
2000
2001
2002
2003
2004
2005
2006
2007
2008
2009
2010
2011
2012
2013
2014
2015
2016
2017
Increase is significant up to day 10
13SH and N. America 500-hPa HGT ACC
(20150601 ~ 20180912)
SH Pacific North America
A gain of 0.008 A gain of 0.009
14Temperature Biases
Global Mean, verified against analysis Global Mean, against RAOBS
- 2.0 K + 0.8K
GSM has strong cold bias in the middle to upper stratosphere ( - 2K).
FV3GFS warm bias ( +0.8K) is caused by a radiation bug (fixed).
Sensitivity studies showed that the reduction of the cold bias is primarily attributed to the new
FV3 dycore, and in a certain degree to the improvement in Ozone physics 15Ozone Bias
Verified against analyses
O3 at 10 hPa
Column Total Ozone
GSM loses ozone in forecast.
FV3GFS conserves better.
16Zonal Mean SPFH and SPARC Climatologies
GFS FV3-GFS
17NH WIND RMSE
Verified against analyses
August 2018
• FV3GFS has larger RMSE than GSM in the stratosphere
• FV3GFS RMSE is similar to ECMWF RMSE
• GSM winds in the stratosphere is too smooth due to strong damping.
• Weaker and smoother winds usually (falsely) make RMSE smaller. Extra caution is
required in evaluation of vector wind field.
18NH WIND BIAS and RMSE
Verified against ROBS, 20160901 ~ 20180831
BIAS RMSE
• Winds in both GSM and FV3GFS are weaker than observed, but FV3GFS is
closer to the observation.
• FV3GFS has stronger winds at the jet level, reduced RMSE in the
troposphere, but worse in the stratosphere
19CONUS Precip ETS and BIAS SCORES
00Z Cycle, verified against gauge data, 20150601~ 20180912
FH 36-60
FH 84-108
• Improved ETS scores for almost all
thresholds and at all forecast length
• Reduced wet bias for light rains
• Slightly worsened dry bias for
moderate rain categories
20Improved Precipitation Diurnal Cycle
SUMMER 2018 CONUS DOMAIN-AVG PCP
2018: FV3GFS better than GSM,
especially overnight
FV3GFS ops GFS OBS
From: Ying Lin
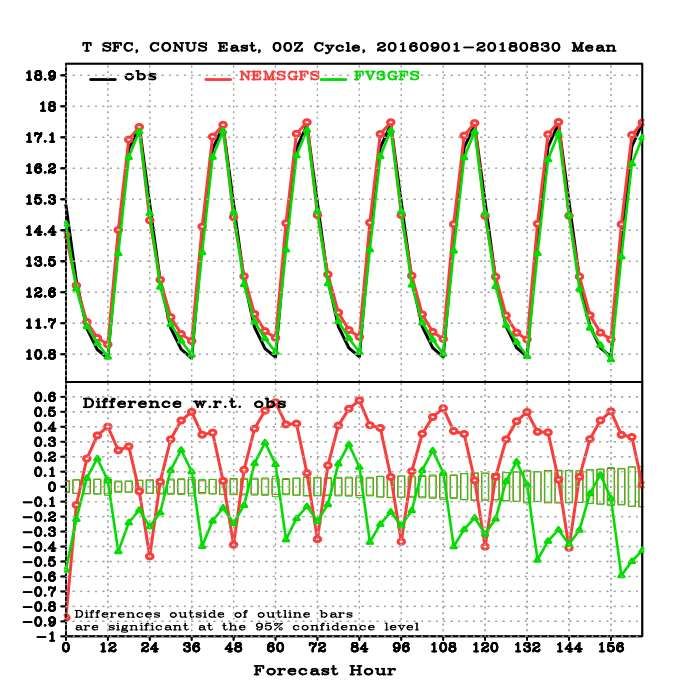
21CONUS 2-m Temperature
Verified against Station Observations, 3-year mean
WEST OBS GFS FV3GFS EAST
Slight FV3GFS improvement in both the min and the max
222-m Temperature over Alaska
Verified against Station Observations, 3-year mean
NORTH ALASKA OBS GFS FV3GFS
SOUTH ALASKA
FV3GFS has large cold bias !
Likely caused by a cold NSST and an overestimate (underestimate) of cloud in summer (winter)
23Diagnosing and Fixing an NSST Issue
• In response to feedback on how well gulf stream was resolved, the
background error correlation lengths were revised to be more consistent with
those used in other operational SST analyses (50km).
• After a number of months of pre-operational testing an SST anomaly of ~3K
was noted in the northern Pacific. This was a symptom of a lack of
observations in the area and the reduced influence of distant observations
because of the reduction in length scales.
• At the same time anomalies in lake temperatures were noted by the MEG
team which was also traced to a lack of observations being assimilated.
Tref, 26 May – 18 September 2018
Both of these are solved by
switching on a climatological
update of the tref to the background
SST field. This option is currently
being tested along with an increase
in background error length scales to
100km.
gcycle is now called hourly in GDAS forecast step
From: DA Team
24Fixing the N. Pacific Cold Bias
RTG Analysis
NCDC OI Analysis (dashed)
Ostia Analysis
Operational NSST
NSST 100km + clim. update.
NSST 50km + clim. update.
NSST 50km
25Fixing the Great Lakes Cold Bias
RTG Analysis
NCDC OI Analysis (dotted)
Ostia Analysis
Operational NSST
NSST: FV3 real time parallel
NSST: FV3 EXP with fixes
(dashed)
Cold warmer
26Improved Wind-Pressure Relationship FV3GFS shows a much better W-P relation than ops GFS for strong storms For FV3GFS, W-P relation with hord=5 is better than hord=6 Graph made by HWRF group 27
Hurricane Track and Intensity
                             20150601 ~ 20180919
                          Red: NEMS GFS;   Green FV3GFS

Track

            AL                        EP                       WP

Intensity

                                      EP                       WP
            AL

    • Intensity is improved over all basins
    • Tracks in AL and WP are improved for the first 5 days except at FH00,
      and degraded in day 6 and day 7. Track in EP is neutral
                                                                              28
Extratropical Cyclone Track
Jun 2017 ~ May 2018
FV3GFS track errors are Ops
FV3GFS
consistently smaller than GFS
that of GFS. Error at 120
hour is substantially
smaller. (Unit: NM)
FCST hr 0 12 24 26 48 72 96 120
FV3GFS 0.0 24.09 40.38 57.04 73.91 113.66 165.22 212.75
Track GFS 0.0 26.59 44.17 62.87 81.08 125.89 180.85 281.57
errors diff 0.0 -2.50 -3.79 -5.83 -7.17 -12.23 -15.63 -68.82
FCST hr 0 12 24 26 48 72 96 120
FV3GFS 15490 14895 13904 10069 6231 2285 799 239
Number
of cases GFS 16672 16156 15031 10906 6776 2563 925 281
diff -1182 -1261 -1127 -837 -545 -278 -126 -42
FV3GFS captures slightly smaller number of cases. From: Guang-Ping Luo
29Summary -- Benefits
• (significantly) Improved 500-hpa anomaly correlation
• Intense tropical cyclone deepening in GFS not observed in FV3GFS
• FV3GFS tropical cyclone track forecasts improved (within 5 days)
• Warm season diurnal cycle of precipitation improved
• General improvement in HWRF and HMON runs
• Some indication that fv3gfs can generate modest surface cold pools from
significant convection
• FV3GFS with advanced GFDL MP provides better initial and boundary
conditions for driving standard alone FV3, and for running downstream
models that use advanced MP.
• Improved ozone and water vapor physics and products
• Improved extratropical cyclone tracks
• Improved precipitation ETS score (hit/miss/false alarm)
• Overall reduced T2m biases over CONUS
30Summary -- Concerns
• FV3GFS can be too progressive with synoptic pattern
• Precipitation dry bias for moderate rainfall
• SST issues – North Pacific and lakes are too cold in the transition season
• T2m over Alaska is too cold, likely caused by cold NSST and/or cloud
microphysics issue in the Arctic region.
• Both GFS and FV3GFS struggle with inversions
31Thank you
32You can also read