Oregon Renewable Energy Siting Assessment (ORESA)
←
→
Page content transcription
If your browser does not render page correctly, please read the page content below
The following information is part of the Oregon Renewable Energy Siting Assessment (ORESA). The ORESA project is funded through a $1.1 million
 U.S. Department of Defense Office of Local Defense Community Cooperation grant awarded to the Oregon Department of Energy, working with
               the Department of Land Conservation & Development and Oregon State University's Institute for Natural Resources.
                      More information is available at https://www.oregon.gov/energy/energy-oregon/Pages/ORESA.aspx

Oregon Renewable Energy
Siting Assessment (ORESA)
  Supporting Materials
  Please refer to the ORESA Final Report and ORESA Mapping and
  Reporting Tool for more information and context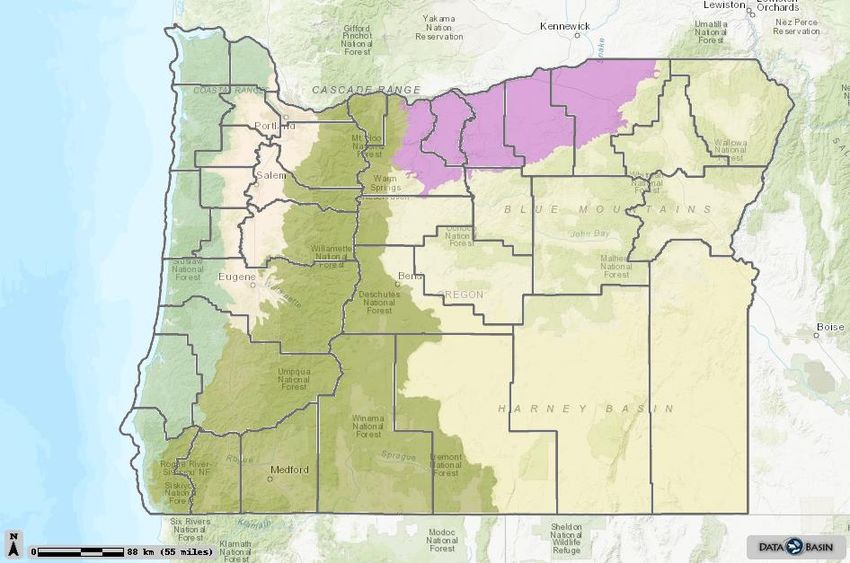
Oregon Renewable Energy Siting Assessment

Natural Resources, Environment, and Development:
          Opportunities and Constraints

                 September 2021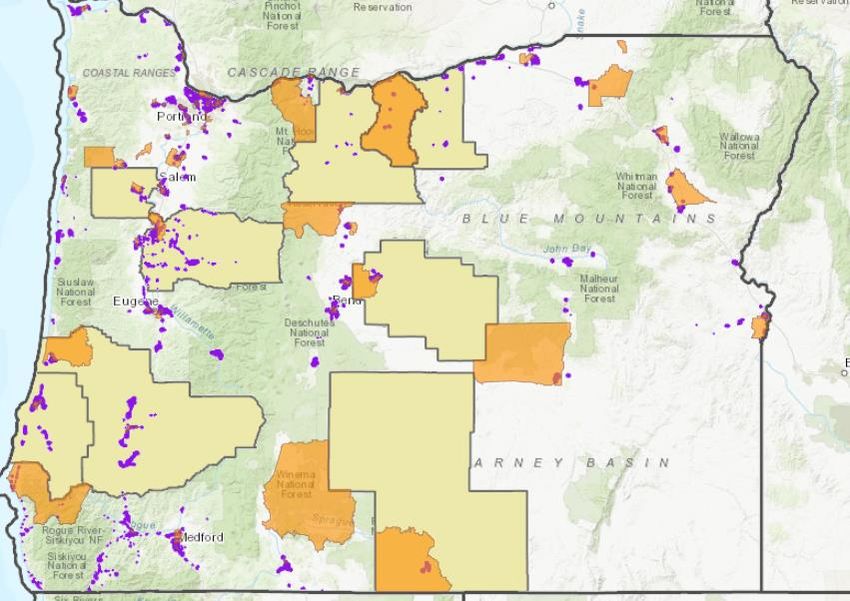
Natural Resources, Environment, and Development
Opportunities and Constraints                                             September 2021

                                   [This page intentionally left blank]

                                                    i
Natural Resources, Environment, and Development
Opportunities and Constraints                                                                                                   September 2021

                                                        Table of Contents
Executive Summary ....................................................................................................................... iv
Introduction ..................................................................................................................................... 1
Stakeholder Registry ....................................................................................................................... 4
Online Survey ................................................................................................................................. 4
   Interest in Renewable Energy Source Types .............................................................................. 6
   Scoring of Renewable Energy Development Considerations ..................................................... 6
Opportunities and Constraints - Background .................................................................................. 7
   Growth in Renewable Energy Development .............................................................................. 8
   Renewable Energy Policies....................................................................................................... 11
   Customer Preferences ............................................................................................................... 16
   Development and Operational Costs of Renewable Energy ..................................................... 16
   Land Utilization ........................................................................................................................ 19
   Environmental Impacts from Renewable Energy ..................................................................... 20
   Local Economic Benefits .......................................................................................................... 22
Summary of Stakeholder Inputs.................................................................................................... 22
   Need for a Comprehensive Planning Approach........................................................................ 23
   Need for Better Cooperation and Coordination ........................................................................ 24
   Desire for a Better Public Process ............................................................................................ 25
   Tribal Concerns ......................................................................................................................... 27
   Specific Comments by Energy Source ..................................................................................... 28
       Solar ...................................................................................................................................... 28
       Wind...................................................................................................................................... 29
       Small Hydro .......................................................................................................................... 30
       Biomass ................................................................................................................................. 31
       Geothermal ............................................................................................................................ 31
       Wave ..................................................................................................................................... 31
       Transmission and Storage ..................................................................................................... 31
   Military Roundtable Webinar ................................................................................................... 33
Spatial Data Review ...................................................................................................................... 35
   Priority Data and Information ................................................................................................... 35
   Oregon Context ......................................................................................................................... 39
   Renewable Energy .................................................................................................................... 39
   Oregon Hazard Considerations ................................................................................................. 40

                                                                         ii
Natural Resources, Environment, and Development
Opportunities and Constraints                                                                                                 September 2021

   Oregon Protected Area Considerations ..................................................................................... 41
   Other Conservation Value Considerations................................................................................ 43
   Fish and Wildlife Considerations.............................................................................................. 44
   Other Land/Water/Air Considerations ...................................................................................... 49
   Oregon Offshore Context .......................................................................................................... 50
   Oregon Offshore Renewable Energy ........................................................................................ 51
   Oregon Offshore Hazards ......................................................................................................... 51
   Oregon Offshore Protected Areas ............................................................................................. 52
   Oregon Offshore Development Considerations ........................................................................ 53
   Oregon Offshore Fish and Wildlife – Mammals ...................................................................... 55
   Oregon Offshore Fish and Wildlife Considerations – Seabirds................................................ 56
   Oregon Offshore Fish and Wildlife Considerations – Other .................................................... 58
Data Gaps, Updates, and Processing Needs.................................................................................. 59
   Energy and Transmission .......................................................................................................... 59
   Hazards ..................................................................................................................................... 59
   Protected Areas ......................................................................................................................... 59
   Other Conservation Values ....................................................................................................... 60
   Fish and Wildlife....................................................................................................................... 60
   Other Air/Water/Land ............................................................................................................... 61
   Tribal Cultural Data .................................................................................................................. 62
Online Tool ................................................................................................................................... 62
   Desired Tool Function for Renewable Energy Decision Support ............................................ 62
   Functionality and Feature Options ............................................................................................ 63
   Data Handling ........................................................................................................................... 63
   Logins and Save ........................................................................................................................ 64
Key Take-aways............................................................................................................................ 65
Literature Cited ............................................................................................................................. 70
APPENDIX A: Stakeholder Registry by Sector .......................................................................... 75
APPENDIX B: Copy of the Online Survey ................................................................................. 76
APPENDIX C: Survey Results by Sector – Renewable Energy Development Considerations .. 79
APPENDIX D: Survey Results by Sector – Renewable Energy Priority Data and Information 82
APPENDIX E: Organized Summary of Written Survey Responses to Questions 11, 12 and 16 85
APPENDIX F: Number of Webinar Registrants and Attendees ................................................. 93
APPENDIX G: Data Delivery List .............................................................................................. 93

                                                                       iii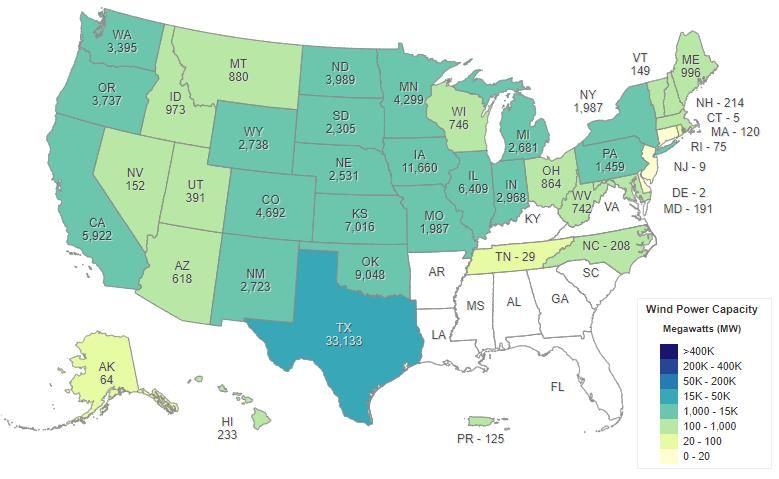
Natural Resources, Environment, and Development
Opportunities and Constraints September 2021
Executive Summary
The ORESA project’s main goal is to assess data, information, and stakeholder perspectives to create
transparent, trusted, and accurate information to support renewable energy development in Oregon
without specific recommendations or endorsements. The Natural Resources, Environment and
Development Opportunities and Constraints Assessment component of the project is the focus of this
report and included six main activities: (1) created a stakeholder registry; (2) created and analyzed an
online survey; (3) conducted numerous one-on-one interviews; (4) facilitated a military stakeholder
roundtable webinar discussion; (5) collected relevant spatial data and managed stakeholder review; and
(6) provided input for online tool development.
The stakeholder registry was populated with 396 individuals each assigned to one of ten sectors who
were then invited to take an online survey, which was designed to obtain information regarding
renewable energy interest, perceived opportunities and constraints, spatial data interest, and
preferences for specific online tool functionality – 82 responded. Survey responses were followed-up
with one-on-one phone interviews with individuals from each sector in order to obtain more in-depth
feedback. In addition, a special group roundtable webinar discussion was held focusing on stakeholder-
military interaction.
Main findings from stakeholder feedback include:
Renewable energy planning in Oregon is being met with considerable excitement and optimism;
however, some anxiety and fear persists.
Solar, onshore wind, and offshore wind were reported as the top three renewable energy types
of interest.
An overwhelming majority of stakeholders felt a comprehensive approach to energy planning in
Oregon is needed – one that includes all renewable energy types at all scales.
Effective and adaptive renewable energy planning and siting requires better collaboration and
communication between all parties. Early and regular communication was an overriding theme.
Support for ongoing public participation in the planning process was highly desirable to most
stakeholders.
Developing and maintaining high quality data and information is needed for effective planning,
project implementation, and monitoring.
Data and process transparency is extremely important in streamlining renewable energy
development at reduced costs.
There is currently a need for a centralized, standardized, editable database of tower locations
for military and civilian air safety in Oregon.
A state-wide or region-wide least-conflict planning process was suggested by stakeholders.
Over 650 spatial datasets were collected, 570 of which were curated into a private working group in
Data Basin (http://databasin.org) so all stakeholders could easily review the data and provide specific
feedback. A series of Data Basin maps (each containing 15-20 individual datasets) were composed with
the more valuable datasets and shared with stakeholders. These maps were presented in a series of
Zoom webinars to registered stakeholders. Six webinars were conducted focusing on the different
iv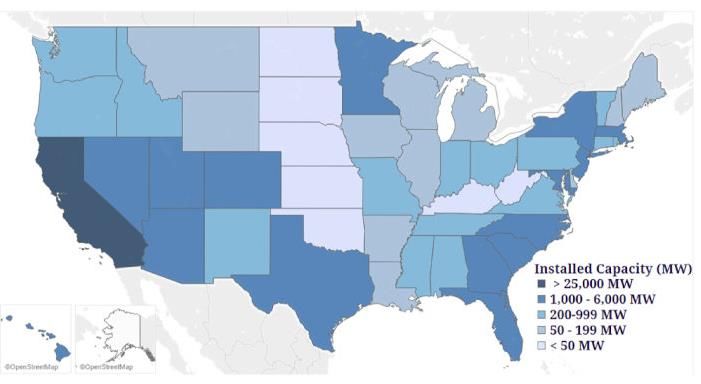
Natural Resources, Environment, and Development
Opportunities and Constraints                                                           September 2021

regions of the state and specific content. Maps remained available for stakeholders to review and
comment. A total of 189 individuals attended the webinars; total number of unique attendees was 140.

Comments were assembled and adjustments made to the final spatial data catalog, which contained the
data delivered to the ORESA team. Discussion about data gaps, updates, and processing needs was also
provided for selected topics. The most important themes to stakeholders included data pertaining to:
sensitive habitat and species, infrastructure, cultural resources, energy resources, and conservation
areas of interest. Top ranking online tool functions identified by stakeholders included: guided
workflow; the ability to download data; printing of individual maps and PDF reports; and thematic layer
exploration. An additional set of project take-aways is provided at the end of the report.

                                                  v
Natural Resources, Environment, and Development
Opportunities and Constraints                                                            September 2021

Introduction

The Oregon Renewable Energy Siting Assessment (ORESA) project was funded through a grant from the
U.S. Department of Defense (DoD) Office of Economic Adjustment and administered by the Oregon
Department of Energy (ODOE). Other project partners included the Oregon Department of Land
Conservation and Development (DLCD) and the Oregon State University’s Institute for Natural Resources
(INR). The main project goal was to assess data, information, and perspectives to create transparent,
trusted, and accurate information to support renewable energy development for Oregon (noting where
data may be uncertain) without recommendations or endorsements. The five main components to the
ORESA project included:

    1.   Renewable Energy Market and Industry Assessment
    2.   Military Needs and Interest Assessment
    3.   Natural Resources, Environment and Development Opportunities and Constraints Assessment
    4.   Siting Procedures Review
    5.   Mapping and Reporting Tool

Energy and Environmental Economics (E3) conducted the Renewable Energy Market and Industry
Assessment. The main objective was to use available data and information to model future
opportunities to develop renewable energy generation and transmission projects in Oregon and
adjacent ocean. Cost-optimized renewable energy build-out scenarios were developed for the next 15
years. The assessment also focused on the challenges and opportunities that exist in the renewable
development community in Oregon and identified gaps that if addressed could help meet Oregon’s long-
term energy goals.

The Military Needs and Interest Assessment conducted by Epsilon explored the intersection of
renewable energy and military operations in Oregon and the adjacent ocean. Epsilon gathered
information from the military and processed spatial data regarding current and future military assets,
uses, and needs. Final report describes current and anticipated military mission requirements and
highlights existing constraints and opportunities for collaboration between renewable energy
development and military uses.

The Siting Procedures Review concentrated on the siting regulations, permitting, and project review
processes as they relate to notification, identification, and evaluation of potential impacts. A summary
of siting regulations and process review was developed with the help of feedback from stakeholders and
best practices identified for better engagement and improved coordination.

The Mapping and Reporting Tool is being developed by INR staff and housed in the Oregon Explorer. The
spatially explicit tool is being built to provide a more comprehensive understanding of renewable energy
and transmission development in Oregon to a wide range of stakeholders and to help support proactive
coordination between them.

                                                   1
Natural Resources, Environment, and Development
Opportunities and Constraints                                                              September 2021

The Natural Resources, Environment and Development Opportunities and Constraints Assessment,
which is the focus of this report, concentrates on the renewable energy development opportunities and
constraints from the standpoint of natural/cultural resources and the physical environment in the state
and offshore. The assessment relied heavily on obtaining input from a broad range of stakeholders using
a variety of means. Originally, a series of face-to-face meetings was an important component of the
outreach effort. Face-to-face meetings are often effective at exposing levels of interest and topical
sensitivity that can only be learned from well-managed group interactions. However, the timing of the
COVID-19 pandemic interrupted the ability to hold face-to-face meetings, and the assessment used
alternative means to obtain the necessary feedback from stakeholders. Outreach involved four different
approaches – (1) an online survey, (2) one-on-one phone interviews, (3) a series of regional webinars
focused on relevant spatial data for renewable energy development considerations with follow up calls
with individual data providers, and (4) a military stakeholder roundtable webinar discussion. The scope
of work outlined and summarized in this report included six primary components (Figure 1):

    A.   Stakeholder Registry
    B.   Online Survey
    C.   One-on-one Interviews
    D.   Military stakeholder roundtable webinar
    E.   Spatial Data Management
    F.   Online Tool Content and Function Input

A stakeholder registry was developed to identify the target audience for this project. The registry was
primarily used to distribute an online survey, but it also provided a record of individuals and
organizations with a stake in renewable energy development in the State of Oregon. By creating a living
digital registry, the list can be updated and maintained by agency staff and used in the future to further
outreach and engagement related to renewable energy development.

The main objective of the survey was to reach as many people as possible representing different
stakeholder perspectives in order to gain important insight about renewable energy development in
Oregon and the adjacent marine environment using a standardized learning device; the objective was to
cover a wide range of topics without an in-depth assessment. In general, the survey was developed to
obtain information about the audience; the type(s) of renewable energy of interest; identification of
renewable energy development opportunities and constraints; and desirable data and online tool
functionality considerations.

Information regarding stakeholder perspectives regarding opportunities and constraints was obtained
from the online survey as well as from a series of follow-up one-on-one interviews. These one-on-one
conversations with individuals from different stakeholder sectors were designed to focus primarily on
opportunities and constraints to renewable energy development in the state. Unlike the survey, these
conversations were meant to gain a deeper understanding based on the stakeholder’s experience –
what works and what doesn’t from their perspective. After the one-on-one interviews were completed,
a military-focused stakeholder roundtable webinar was convened.

                                                    2
Natural Resources, Environment, and Development
Opportunities and Constraints September 2021
A. Stakeholder
Registry
B. Online Survey
①
The Audience
③ Opportunities ④ Data & Tool
and Constraints? Considerations
② Renewable Energy
Interest
C. One-on-one E. Spatial Data Management
Interviews
Spatial Data Spatial Data
Aggregation Review
D. Military
Stakeholder
Roundtable F Online Tool
Webinar Content & Function
Figure 1. Diagram outlining the relationship of the various components of the scope of work
implemented and reviewed in this report.
Finally, a major focus of the project was to obtain stakeholder feedback on the spatial data needs for
planning and siting renewable energy in the state. At the same time, we took the opportunity to ask
stakeholders to provide input on desirable tool functionality (mostly through the survey) to help provide
some high-level guidance to the Institute for Natural Resources (INR), which is responsible for
developing an online tool. Spatial data management involved two activities – (1) an extensive spatial
data aggregation and curation exercise and (2) regionally organized spatial data reviews – both
supported by Data Basin (http://databasin.org). Data Basin is an online map-based data sharing platform
that facilitates easy and open collaboration. Using Data Basin allowed for a highly transparent review of
available data for planning purposes and provided a convenient means for all stakeholders to
understand the data better and to provide helpful feedback. All collected and collated spatial data that
is allowed to be shared publicly will remain accessible online via Data Basin. Results from the
stakeholder survey, extensive data collection and review process, and CBI experience with online tool
development formed the basis for this report.
3Natural Resources, Environment, and Development
Opportunities and Constraints September 2021
Stakeholder Registry
In preparation of an online survey, a stakeholder registry was created with attention to broad sector
representation (Appendix A). Based on our current stakeholder network as well as input from the
ORESA team, including members from DLCD, ODOE, and INR, a stakeholder list was generated and
organized under ten sectors. The goal was to generate a representative list of individuals and
organizations relevant to each sector. The digital registry provides agency staff a convenient way to
update and maintain the list of stakeholders relevant to renewable energy development. Sector
representation in the registry ranged from 12 to 62 (Table 1).
Table 1. Number of stakeholders listed by sector in the Stakeholder Registry.
Sector Number of Stakeholders
Agriculture 15
Federal Government 48
Industry 50
Irrigation Districts 12
Local Government 56
NGO 62
State Government 34
Tribes 40
University 13
Utilities 66
Total 396
Online Survey
The online survey was designed in coordination with the ORESA team to obtain information regarding
renewable energy interest, opportunities and constraints, spatial data interest, and online tool
functionality considerations (Appendix B).The survey included 16 questions and could be taken in 10
minutes to maximize the number of potential responses.
Invitations were distributed to the stakeholders from the registry in September 2020; the survey was
closed on October 20, 2020. Survey Monkey was used to manage the survey and reminders were
periodically sent out to increase participation. Of the 396 invitations, 82 responses (20.7%) were
received; above average returns (Figure 2). The sectors with the highest response rates included
University, Local Government, Industry, and NGOs. Poorest response rates (i.e., less than 10%) included
Utilities, Irrigation Districts, and Federal Government staff members. Zip codes were used to obtain an
understanding of the spatial distribution of the respondents. Highest concentration areas by county
include Coos, Deschutes, Lake, Crooks, and Benton (Figure 3). Eight people declined to provide their zip
codes and three were from out of state (1 from Washington, D.C. and 2 from Washington state).
4Natural Resources, Environment, and Development
Opportunities and Constraints September 2021
53.9%
University
30.4%
Local Government
30.0%
Industry
26.7%
Agriculture
25.8%
NGO
17.5%
Tribes
14.7%
State Government
9.1%
Utilities
8.3%
Federal Government
8.3%
Irrigation Districts
0 10 20 30 40 50 60 70
Number of Surveys Returned Number of Surveys Not Returned
Figure 2. Summary of the number of surveys sent and the percent responded by each sector.
No. of Respondents
1
2
3
4
7
Figure 3. Map showing zip code locations of survey respondents.
5Natural Resources, Environment, and Development
Opportunities and Constraints September 2021
Interest in Renewable Energy Source Types
The purpose of this survey question was to determine which renewable energy types were of greatest
interest to stakeholders. Survey respondents were asked to check one or more from six types provided
plus an “Other” write-in option. Solar was most popular, with approximately 75% of respondents
selecting it (Figure 4). Three other energy types (offshore wind, small hydro, and onshore wind) were
selected by 37-43% of respondents. A little over 33% of respondents listed biomass to be of interest.
Geothermal and the “Other” category were of least interest to the survey respondents. The other
categories highlighted in the survey answers included wave energy, energy storage, and microgrids as
important renewable energy topics.
80.00%
70.00%
60.00%
50.00%
40.00%
30.00%
20.00%
10.00%
0.00%
Figure 4. Renewable energy types respondents expressed interest in (Percent totals exceed 100%
because respondents could select more than one type of interest).
Scoring of Renewable Energy Development Considerations
The purpose of this survey question was to better understand the motivations or high-level concerns
pertaining to renewable energy development. Survey respondents were asked to score renewable
energy development considerations (5 = very high importance; 1 = very low importance). Categories
included:
Energy Security/Resilience
Climate Change Adaptation
Natural Lands/Wildlife Protection
Water Protection
Working Farms, Ranching, and Forest Lands (Working Lands)
Local Economic Development
6Natural Resources, Environment, and Development
Opportunities and Constraints September 2021
Social/Environmental Justice
Participatory Planning Process
Transmission and Storage Infrastructure
Permitting Process.
Results from the one irrigation district respondent were combined with the Utility category for the two
scoring questions. Summaries for all 82 respondents showed that the categories provided were
generally viewed as important with all categories receiving ≥50% high or very high rankings (Figure 5).
Highest ranking categories include Natural Lands/Wildlife Protection, Transmission and Storage
Infrastructure, and Climate Change Adaptation. The two categories that scored the lowest but still
moderately high importance were Working Lands and Social/Environmental Justice. Results were also
summarized by sector so individual sector difference could be observed (Appendix C). Caution is
warranted for the results where the return sample size was small compared to the number invited as
they may be unrepresentative of the sector.
very low low medium high very high
Natural Lands/Wildlife Protection
Transmission and Storage
Climate Change Adaptation
Participatory Planning Process
Local Economic Development
Water Protection
Energy Security/Resilience
Permitting Process
Working Lands
Social/Environmental Justice
0% 20% 40% 60% 80% 100%
Figure 5. Summary responses (n=82) ranking the relative importance of energy development
consideration categories.
Opportunities and Constraints - Background
This section provides context to the stakeholder data review, the opportunities and constraints survey,
and the one-on-one interview responses, we include a short summary of solar and wind development
trends followed by brief discussions on the three growth drivers – policies, demand, and costs. We
provide background to land utilization and environmental impacts from renewable energy development,
and we end with a brief discussion on local economic benefits. We only focus on solar and wind as these
7Natural Resources, Environment, and Development
Opportunities and Constraints September 2021
were the renewable energy sources of greatest interest to stakeholders and the most likely to dominate
future utility scale renewable energy development in the state.
Growth in Renewable Energy Development
According to the U.S. Energy Information Administration, growth in solar power in the United States
rapidly grew from 493 million kW hours in 2000 to over 90,000 million kW hours in 2020 (Figure 6). In
2020, Oregon ranked 19th of the 50 states with total capacity of 966 MW of solar based on Q4 2020
accounting, which is enough energy to power nearly 124,000 homes (SEIA, 2021a). Utility scale solar
energy development in Oregon started out slowly, but has increased by 280% between 2009 and 2018
(Blumenstein and Schlusser, 2019). Most of this solar generated electricity is used within state where it
provided 1.3% of Oregon’s electricity consumption in 2018; only about 12% of solar power was exported
to neighboring markets (ODOE, 2021). In 2018, utility-scale solar accounted for 79% of solar power
generation in the state with 13% from commercial and 8% from residential sources. Growth projections
have been estimated to be an additional 1,647 MW over the next five years and capacity is available to
support this growth opportunity with 116 companies operating in the state, including manufacturing,
installers, developers, and others (SEIA, 2021).
Wind energy development in the United States has contributed more renewable energy compared to
solar getting a quicker start to the market and is experiencing ongoing growth (Figure 7). Based on Q4
2020 numbers from the U.S. Department of Energy, Oregon has installed wind capacity of 3,737 MW,
which is the state’s second largest renewable energy source behind hydro. Oregon ranks 9 th nationally
for wind power capacity (ODOE, 2021). Wind development in Oregon has grown in fits and starts, but
grew 56% between 2009-2018 (Blumenstein and Schlusser, 2019). In 2018, wind power made up 11.6
percent of Oregon’s electricity generation and 4.69 percent of Oregon’s energy consumption.
Approximately two-thirds of Oregon’s wind generation was exported to neighboring markets. As of
October 1, 2020, there are 46 existing wind farms and four state jurisdictional facilities under
construction in Oregon totaling an additional 894 MW, with an additional 550 MW of wind projects
approved or in review. Three-quarters of existing and planned wind utility-scale generation in Oregon
lies on the Columbia River Plateau in Wasco, Sherman, Gilliam, Morrow, and Umatilla counties, with a
few developments in Eastern Oregon. Development occurs in these regions due to the rich wind
resources as well as access to existing transmission infrastructure.
In 2019, 62% of Oregon’s utility scale electricity generation came from renewable sources with 49%
from hydro power, 11% from wind, and 2% from other sources such as geothermal and solar (US EIA,
2021a). As described in the subsections below, renewable energy development (particularly solar and
wind) is growing across the country and in the state. This is being driven by three main factors: (1)
federal and state policies, (2) increased customer choice/preference, and (3) sharp declines in
development costs.
8Natural Resources, Environment, and Development
Opportunities and Constraints September 2021
15
19
10
8
20
7
6 12 14 17
1 11
3
5 18 13
9
2
16 4
Figure 6. Solar power net generation in the United States from 2000 to 2020 from the US Energy
Information Administration from Statista (https://www.statista.com/) (Top). Top 20 states for installed
solar capacity in 2019 (SEA, 2021b) from the Solar Energy Industries Association (Middle). Utility scale
solar development in Oregon between 2009-2018 (Blumenstein and Schlusser, 2019) (Bottom).
9Natural Resources, Environment, and Development
Opportunities and Constraints September 2021
Figure 7. Wind power net generation in the United States from 2000 to 2020 from the US Energy
Information Administration from Statista (https://www.statista.com/ 2021) (Top). Installed wind power
capacity by state in 2020 (U.S. DOE, 2021a) (Middle). Utility scale wind development in Oregon between
2009-2018 (Blumenstein and Schlusser, 2019) (Bottom).
10Natural Resources, Environment, and Development
Opportunities and Constraints September 2021
Renewable Energy Policies
Federal, state, and local government policies have helped drive renewable energy development at all
scales.
Federal Policies
Federal policies include tax credit programs such as the Renewable Energy Production Tax Credit (PTC),
Investment Tax Credit (ITC), Residential Energy Credit, and Modified Accelerated Cost-Recovery System
(US EIA, 2021b). Once providing as much as 30% tax credits, the PTC and ITC had been partially phased
out, but recently expanded and extended via the 2021 Consolidated Appropriations Act (Medina and
Dajani 2021). In addition, the Public Utility Regulatory Policies Act (PURPA) of 1978 was established after
the U.S. energy crisis at the time to encourage development of small, non-utility power facilities (or
Qualifying Facilities. Due to various amendments to the act, PURPA gives Qualifying Facilities the right to
interconnect with the utility-controlled grid and requires these utilities to purchase QF-generated
energy (U.S. DOE, 2021b).
State Policies
State policy has also played a key role in driving renewable energy development. The Oregon
Department of Energy has worked with a variety of entities to reduce energy use across the state and
was a major focus of the first Sustainability Plan produced in 2003.
The Oregon Renewable Portfolio Standard (RPS), established in 2007 by Senate Bill 838 and updated in
2016 by Senate Bill 1547 requires Oregon’s large investor-owned utilities (IOUs) to provide 50% of retail
electricity sales from eligible renewable resources with interim targets. (Oregon RPS Statute) Oregon’s
consumer-owned utilities (COUs) have lower targets. Electric Service Suppliers (ESSs) must also meet the
RPS requirements applicable to the electric utilities that serve the territories in which the ESS sells
electricity to retail electricity customers. The specific statutory requirements established by SB 1547 are
shown in Table 2. SB 1547 also requires that all coal is removed from Oregon's electricity mix by 2030
(with an exception for a small portion of Portland General Electric’s ownership of Colstrip, which must
be phased out by 2035).
Table 2. Statutory RPS requirements established by SB 1547.
2020 2025 2030 2035 2040
IOUs
20% 27% 35% 45% 50%
(3% or more of retail sales)
Large COUs
- 25% 25% 25% 25%
(3% or more of retail sales)
Medium COUs
- 10% 10% 10% 10%
(1.5% - 3% of retail sales)
Small COUs
- 5% 5% 5% 5%
(less than 1.5% of retail sales)
11Natural Resources, Environment, and Development
Opportunities and Constraints September 2021
Generation sources eligible for the Oregon RPS include solar, wind, geothermal, certain biomass
sources, some hydropower, hydrogen, and wave or tidal energy. One goal of the Oregon RPS is to
promote “research and development of new renewable energy sources in Oregon.” For this reason,
aside from a few exceptions, only facilities that became operational on or after January 1, 1995, are
eligible for participation in the RPS to incentivize the development of new renewable electricity sources;
this is one reason why much of the existing hydropower in the region is not eligible for the RPS.
Two state programs, which have now sunset provided sizeable tax credits to jumpstart renewable
energy development in the state: the Oregon Business Energy Tax Credit (BETC) program (1979-2014)
and Residential Energy Tax Credit (RETC) program (1978-2017). The BETC program allowed for tax
investment credits worth $653 million while the RETC program issued tax credits totaling over $258
million, including 15,000 solar projects. Business Oregon oversaw another cash incentives program that
closed in 2017 called the Solar Development Incentives Program, which over the course of its operation
providing cash incentives to 19 solar developments totaling $362 million (ODOE, 2018). During the 2019
and 2020 legislative sessions, House Bill 2618 created a $1.5 million rebate program targeting residential
customers to reduce the consumer cost of solar development and energy storage. This program also
included specific targets for low and moderate income participants and low income service providers.
Using a competitive process, ODOE managed the Renewable Energy Development (RED) Grant Program
(now concluded) that promoted investment in renewable energy via grants to individuals, businesses,
NGOs, tribes, and others to install renewable energy systems of up to $250,000 not to exceed 35% of
eligible costs. The Energy Trust of Oregon, which began operation in 2002 and is funded through a small
percentage of customer utility bills as a public purpose charge, invests in cost-effective energy efficiency
and helps pay the above-market costs of renewable energy resources. The Energy Trust provides energy
efficiency and renewable energy programs to customers in Oregon and SW Washington (Energy Trust of
Oregon, 2021).
During the recent 2021 legislative session in Oregon, several new energy programs were passed and will
be implemented over the next few years. Below is a list of recent energy related legislation that passed:
HB 2021 was described as “Clean Energy For All” –
o 100% Clean Electricity Targets: Oregon’s large investor-owned utilities (IOUs) and
electricity service suppliers must reduce greenhouse gas emissions associated with
electricity sold in Oregon compared to a 2010 baseline – 80% emissions reductions by
2030, 90% by 2035, and 100% by 2040 – effectively requiring emission-free electricity by
2040. The legislation provides exemptions from meeting goals if compliance would
impact system reliability or lead to excessive rate increases.
o New Natural Gas Plant Restrictions: Restricts the Oregon Energy Facility Siting Council
from issuing site certificated for fossil-fueled energy facilities including prohibiting site
certificate issuance for new fossil-fueled facilities that emit greenhouse gases into the
atmosphere.
o Community Renewable Investment Fund: Creates a $50 million dollar fund at ODOE to
provide competitive grants for planning or developing community renewable energy
12Natural Resources, Environment, and Development
Opportunities and Constraints September 2021
projects less than 20 megawatts in capacity that promote energy resilience, increase
renewable energy generation or storage capacity and provide economic or other
benefits to communities.
o Study on Small Scale Renewable Energy Development: Directs ODOE to convene a work
group to develop and publish a study on the barriers, opportunities, and benefits of
small-scale renewable energy projects.
o Green Energy Tariffs: Permits IOUs to collaborate with local governments to develop
green electricity rates in alignment with local government renewable or clean (non-
emitting) energy goals to serve retail electricity customers within the geographical
boundaries of the local government.
o Responsible Contractor Labor Standards: Requires renewable project developers and
contractors to document and meet specific labor standards when constructing
renewable energy generating or storage facilities with capacity of 10 megawatts or
greater.
o RPS Community-based Renewable Energy Project Target Changes: Increases the RPS
community based renewable energy target from 8% of aggregate electrical capacity by
2025 to 10% of aggregate electrical capacity by 2030 for Oregon’s large IOUs.
HB 2289 – Wildfire Rebuilding Process to create a more affordable and streamlined rebuilding
process for those who sustained property damage during the 2020 Labor Day wildfires. If certain
criteria are met, a property owner may alter, restore, or replace a nonresidential use without
further application with the local government. Local and state governments are directed to
approve applications and permits in most cases. The new construction must comply with
applicable building codes that were in effect on the later of 1/1/2008 or the date of the former
dwelling’s construction. For residences, the applicable building code will be the 2005 Oregon
Residential Specialty Code. For commercial buildings, the applicable building code will be the
2007 OSSC/Energy Code. As part of HB 5006, the budget reconciliation bill, $10 million was
directed to the Oregon Department of Energy to provide energy efficiency incentives for the
same structures being rebuilt or repaired as a result of the 2020 wildfires.
HB 3141 – Public Purpose Charge Modernization - changes many elements of the Public Purpose
Charge (PPC). The PPC has funded both energy efficiency and renewable energy projects in the
territories served by Oregon’s two largest investor owned utilities since the passage of SB 1149
in 1999. Among the changes, HB 3141:
o Extends the public purpose charge for 10 years, through January 1, 2036
o Reduces the PPC from 3% of revenues to 1.5% of revenues
o Modifies but maintains PPC support for renewable energy, low-income
weatherization, low-income housing, and energy-related projects in schools
o Moves most cost-effective energy efficiency work from the Public Purpose Charge and
funds those programs through rates instead
o Adds language in renewables section to allow PPC funds to be
used for distribution system-connected technologies that support reliability,
resilience, and integration of renewable energy with the distribution system, and adds
this same language for self-direct large customers
13Natural Resources, Environment, and Development
Opportunities and Constraints September 2021
o Adds language for OPUC to set rates to collect at least $20 million a calendar year from
all electric companies to go to the Oregon Housing and Community Services Low-
Income Electric Bill Payment Assistance Program
o Requires the OPUC to establish equity metrics for environmental justice for PPC
programs administered by nongovernmental entities
HB 3375 – Floating Offshore Wind Energy Study – declares a state goal to plan for the
development of up to 3 GW of floating offshore wind in federal waters off Oregon’s coast by
2030 and states that this planning must be conducted to maximize state benefits and minimize
conflicts across ocean ecosystems and ocean users. It also calls for federal planning and
permitting processes to consider the decommissioning of offshore energy facilities and related
energy infrastructure after permanent end to use. The bill also directs ODOE to conduct a
literature review of the benefits and challenges of integrating up to 3 GW of floating offshore
wind into the electric grid by 2030. ODOE will consult with other state, regional, and national
entities to gather input on the effects, including benefits, and challenges, of integrating 3 GW of
floating offshore wind on reliability, state renewable energy goals, jobs, equity, and resilience.
Then, the agency will hold at least two public meetings with interested stakeholders to provide a
summary of findings and to gather feedback on the benefits and challenges of integrating up to
3 GW of offshore wind. Finally, HB 3375 directs ODOE to provide a summary of key findings from
the literature review and consultations with stakeholders, including opportunities for future
study and engagement, in a report to the Legislature by September 15, 2022.
SB 333 – Renewable Hydrogen Study requires ODOE to conduct a study of the potential benefits
of and barriers to production and use of renewable hydrogen (RH2) in Oregon. ODOE must
submit the study report to the Legislative Assembly no later than September 15, 2022.
SB 589 – Regional Transmission Organization Study requires ODOE, in consultation with the PUC,
to report on benefits, opportunities, and challenges posted by the development of a Regional
Transmission Organization (RTO) in this state through a literature review, advisory committee,
and public meetings.
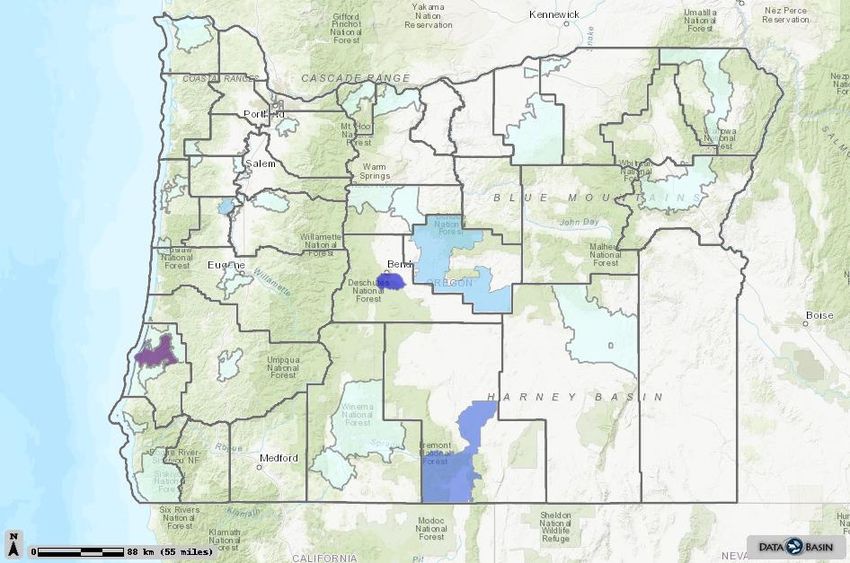
State Economic Incentive Zones
Geographically, three priority economic incentive regions have been defined and mapped in the state
where development (including renewable energy) is provided additional support (Figure 8). Starting in
2011, 14 Rural Renewable Energy Development (RRED) Zones have been established primarily at the
county level to incentivize renewable energy development within a 3-5 year time frame. Currently, 10
sites (9 counties plus the City of Pilot Rock) are designated as RRED zones (Oregon Business 2021).
Opportunity Zones consists of an entire census tract, as established for the decennial U.S. Census. Tracts
vary in size but generally align with population density. Oregon has 834 census tracts, more than 300 of
which were eligible by meeting the definition of a "low income community" in terms of median family
incomes or poverty rates. Oregon could nominate up to 86 zones, as each state was allowed up to 25%
of its low income communities for designation. The designations are in effect until December 31, 2028,
and offer a predictable basis for private investment decisions over several years. Current federal law
provides no means to change or add zones. These areas can deliver significant tax savings on medium-
14Natural Resources, Environment, and Development
Opportunities and Constraints September 2021
to long-term investments in economically disadvantaged communities. This new tax incentive pertains
to both the capital gains invested initially through a qualified opportunity fund (QOF), as well as future
capital gains earned on the original investment in zone-based businesses or projects.
Lastly, Oregon's Enterprise Zones offer a unique resource to Oregon communities, and an excellent
opportunity for businesses growing or locating in Oregon. Primarily, enterprise zones exempt businesses
from local property taxes on new investments for a specified amount of time, which varies among the
different zone programs. Sponsored by municipal or tribal governments, an enterprise zone typically
serves as a focal point for local development efforts. There are currently 73 enterprise zones creating
better opportunities for business investment across Oregon: 56 rural and 17 urban.
Figure 8. Active Rural Renewable Energy Development Zones (yellow), Oregon Opportunity Zones
(orange), and Oregon Enterprise Zones (purple).
Municipal Policies
In addition to federal and state policies promoting renewable energy development, around 30 local
municipalities have adopted their own climate change mitigation goals and programs. For example, the
City of Portland and Multnomah County committed to 100% renewable electricity by 2035 and 100%
renewable energy across all sectors by 2050. The City of Ashland offers residential and commercial users
a cash rebate of $0.05/W (up to $7,500 per site) when they go solar. In Eugene, the Eugene Water and
15Natural Resources, Environment, and Development
Opportunities and Constraints September 2021
Electric Board will pay $0.04/W to solar residential customers up to $2,500. Customers in Salem can
receive a $600 rebate for the first 3kW installed solar and $300 for every additional kW up to $1,500.
Customer Preferences
Based on recent polling, 60-79% of American’s feel the country’s energy supply should transition away
from fossil fuels toward renewable energy alternatives (McCarthy, 2019; Tyson and Kennedy, 2020).
While data shows both self-identified Democrats and Republicans support the energy transition, they
differ significantly on several overarching questions. For example, there is a large divide in opinion as to
whether humans are largely responsible for climate change (72% D versus 22% R) and whether climate
change is impacting their own local community (83% D versus 37% R). While 65% feel government is
doing too little, it breaks down quite differently between the two parties (89% D versus 35% R) with
Independents largely supporting the Democratic position (Pew Research, 2020). There is also a major
partisan difference as to what motivates their support for renewable energy development. Democrats
are more motivated and driven to combat the impacts from climate change and Republicans are mostly
driven by economic considerations (Gustafson et al., 2020). Despite the generally positive attitude
toward renewable energy development, people directly impacted by utility scale solar and wind
development are sometimes less enthusiastic (Seattle Times, 2021), especially as projects continue to
get larger; for example, PV solar installations have increased in size by 80% between 2010 and 2019
(NREL, 2020).
Development and Operational Costs of Renewable Energy
Of the three renewable energy types of greatest interest to the stakeholders (solar, onshore wind, and
offshore wind), solar is currently the least expensive to install although onshore wind shows a slight
levelized cost of electricity (LCOE) advantage (IRENA, 2020). Solar and onshore wind are increasingly the
least cost energy resource for many areas, often producing electricity at lower costs compared to
electricity produced from fossil fuels. Cost savings can translate to lower electric bills for customers,
which is one of many motivations and benefits for advancing renewable energy development in Oregon.
Between 2010 and 2019, costs for utility scale PV solar fell by 82% globally (74% in the US) largely driven
by reductions in solar module prices (hard costs). There was also some increase in the PV solar capacity
factor (Figure 9; IRENA, 2020). Capacity factor is expressed as the percentage of the annual energy
output divided by the maximum output capacity. In Oregon, overall PV solar prices fell by 45% over the
past five years (SEIA, 2021a).
16Natural Resources, Environment, and Development
Opportunities and Constraints September 2021
Figure 9. Global weighted average total installed costs, capacity factors, and levelized cost of electricity
(LCOE) for PV solar from 2010 to 2019 [from IRENA, 2020].
Global costs for onshore wind fell by 39 % between 2010 and 2019 with 75% of new wind projects in
2019 showing lower LCOE costs than fossil fuel power plants (IRENA, 2020). Technology enhancements
resulted in considerable improvement in capacity factor going from 27% in 2010 to 36% in 2019 (Figure
10; IRENA, 2020).
Figure 10. Global weighted average total installed costs, capacity factors, and levelized cost of electricity
(LCOE) for onshore wind from 2010 to 2019 [from IRENA, 2020].
17Natural Resources, Environment, and Development
Opportunities and Constraints September 2021
Compared to utility scale PV solar and onshore wind, offshore wind showed more modest declines in
cost (29%) between 2010 and 2019, and it remains the most expensive of the three to deploy (Figure
11). It continues to grow as new market opportunities emerge. Reduced costs have been attributed to
several factors, including: (1) more extensive developer experience, (2) greater product standardization,
(3) manufacturing improvements, (4) regional manufacturing and service hubs, and (5) economies of
scale reached (IRENA, 2020).
Figure 11. Global weighted average total installed costs, capacity factors, and levelized cost of electricity
(LCOE) for offshore wind from 2010 to 2019 [from IRENA, 2020].
In spite of the significant reduction in costs to developing renewable energy, there are still large soft
costs (costs other than direct construction) to renewable energy development, especially in places like
the U.S. and U.K. where environmental and social policies require careful planning and siting. For
example, Tegen et al. (2016) cite soft and permitting costs range for a typical 100 MW wind project in
2013 to be in the millions of dollars (Table 3). These costs can be reduced by a regional renewable
energy planning public process by eliminating the need for repeating planning and identification for
areas that could be more easily permitted (Pearce et al., 2016).
Table 3. Soft cost ranges associating with siting for a typical 100 MW wind project in 2013 dollars [from
Tegen et al., 2016).
Category Low Estimate High Estimate
Public Engagement $1,319,000 $5,581,000
Wildlife $1,623,000 $6,697,000
Radar $30,000 $710,000
18Natural Resources, Environment, and Development
Opportunities and Constraints September 2021
Land Utilization
Land area used for energy production is expected to continue growing into the foreseeable future. By
2040, what is sometimes referred to as ‘energy sprawl’ is projected to grow by 27% in the United States
to meet future energy demand (EIA, 2013); an increase of as much as 50 million new acres of land
directly impacted by energy development (Trainor, McDonald, and Fargione, 2016). Some of this land
area will likely be dedicated to further expansion of fossil fuel extraction, such as unconventional oil and
gas development, which impacted roughly 7.5 million acres between 2000 and 2012 (Alfred et al. 2015).
More recently, researchers have expressed concerns over the amount of land needed to support a full
renewable energy strategy (Larson et al., 2020 and Merrill, 2021), which according to some scenarios
would require hundreds of millions of new acres dedicated to energy production. Although solar and
wind facilities require more land area on a per-watt basis than fossil fuel alternatives, some have argued
that if one considers the ‘time to land use equivalency’ or the entire energy life cycle, the cumulative
area of land used by renewable energy would be less than the cumulative area used by fossil fuels over
time (Denholm and Margolis, 2008 ; Fthenakis and Kim, 2009; Trainor, McDonald, and Fargione, 2016).
For example, the land required for coal production would be equal to or exceed that of wind, solar and
geothermal energy within 2–31 years (Trainor, McDonald, and Fargione, 2016). That is because once
established, renewable energy facilities remain in place year after year while fossil fuel energy due to
fuel extraction requires continual conversion and degradation of new areas over time.
Regardless of the mix of renewable energy sources, researching the potential to: (a) reuse already
disturbed lands, (b) co-locate energy types (e.g., wind and PV solar), and (c) co-locate energy and other
uses (e.g., PV solar and agriculture) is likely to provide some relief to future energy sprawl. For example,
the U.S. EPA has identified approximately 130,000 contaminated sites in the country through their RE-
Powering Program (https://www.epa.gov/re-powering) that have been pre-screened for renewable
energy development potential. In Oregon, the RE-Powering Program has identified 5,693 solar sites,
1,462 wind sites, 5,541 geothermal sites, and 1,033 biomass sites. Kiesecker et al. (2011) estimated that
a “disturbance–focused” development strategy would avert the development of 5.7 million acres of
natural or working lands and Oregon was reported as one of nine states where Department of Energy
projections for new wind to help meet state renewable requirements and goals could be reached on
existing disturbed lands. Localized additions of storage, rooftop solar, and small wind generation would
also contribute to reducing energy sprawl (Gagnon et al., 2018).
Driven in large part by the spatial and temporal variability of different renewable energy sources (e.g.,
wind and solar), a growing body of research (especially over the last five years) is being conducted to
explore the effectiveness of co-locating different renewable energy types (including storage) at the
same location (Jurasz et al., 2020), which could also play an important role at reducing energy sprawl,
especially in locations where land is already limiting (IPPC, 2011). Optimization of these hybrid solutions
is a topic of great interest in terms of reducing construction and operational costs and lowering storage
capacity (Jurasz et al., 2020). Focusing on a west Texas study area, Siochani and Denholm (2012)
demonstrated that co-locating solar and wind improved the overall capacity factor of the combined
19You can also read