Our Salem: Today - Public Workshop: May 8, 2019
←
→
Page content transcription
If your browser does not render page correctly, please read the page content below
Our Salem: Today

Public Workshop: May 8, 2019
Meeting Agenda
• Project Update
• City Profile
• Greenhouse Gas (GhG) Inventory
• Draft Scenarios and Indicators
   • Report Card
• What do you think?
   • Boards and Your Report Card
• Next Steps
• Questions and Answers

                            2
What is a Comprehensive
Plan?
Comprehensive plans…
Are based on residents’ and
stakeholders’ values and
dreams
Provide a shared vision for
the city to guide future
growth and development
Provide policies and action items to implement the shared vision
3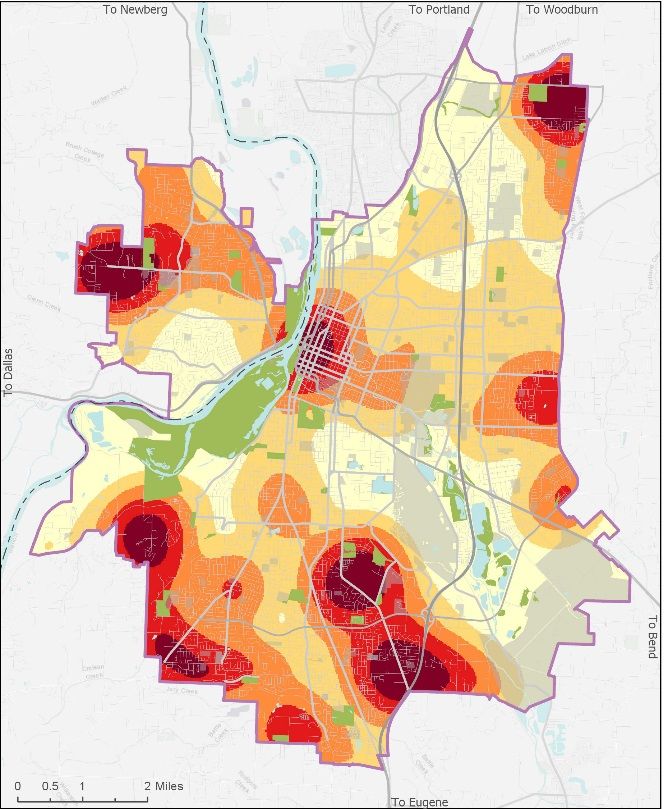
Salem’s Comprehensive Plan
 Update Process

 Phase 1          Phase 2            Phase 3
  Existing                        Update Comp Plan
               Community Vision
Conditions +
 Scenarios
 Fall 2018 –         TBD                 TBD
 Spring 2019

                     4
Process and Schedule
                                                  We are
                                                  here!
                        1        2

  1            2                 3       4           5
Review      Choose           Develop    Report   Report Back
Existing   Indicators       Scenarios    Card
 Plans

                             5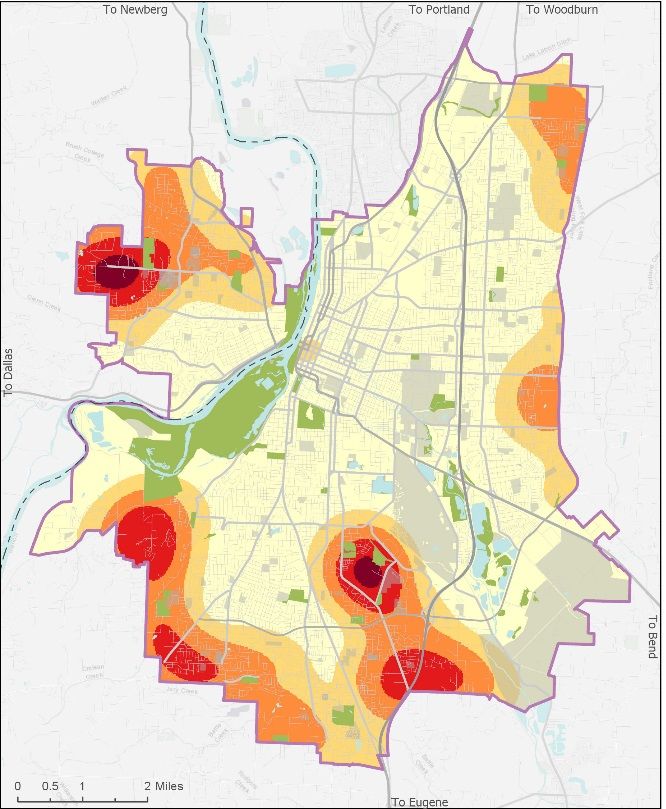
City Profile
     6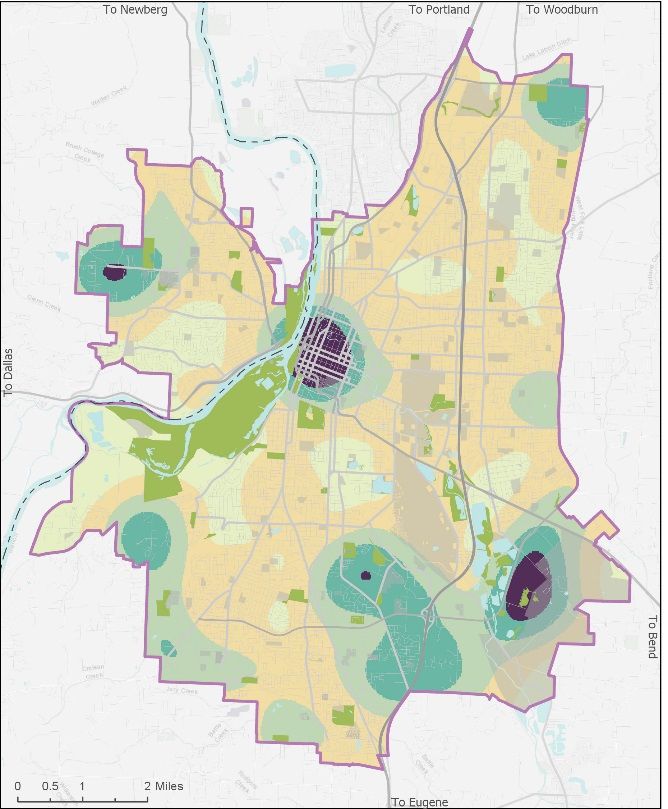
7
60,000 more people by 2035

                      Est.
       Current       2035
        Pop.         Pop.

                 8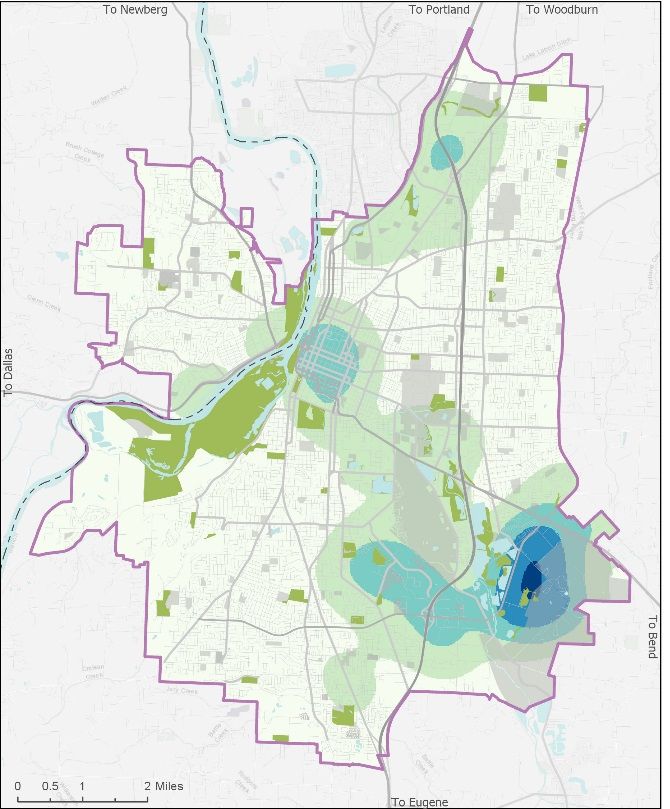
Salem’s Population is Aging

                9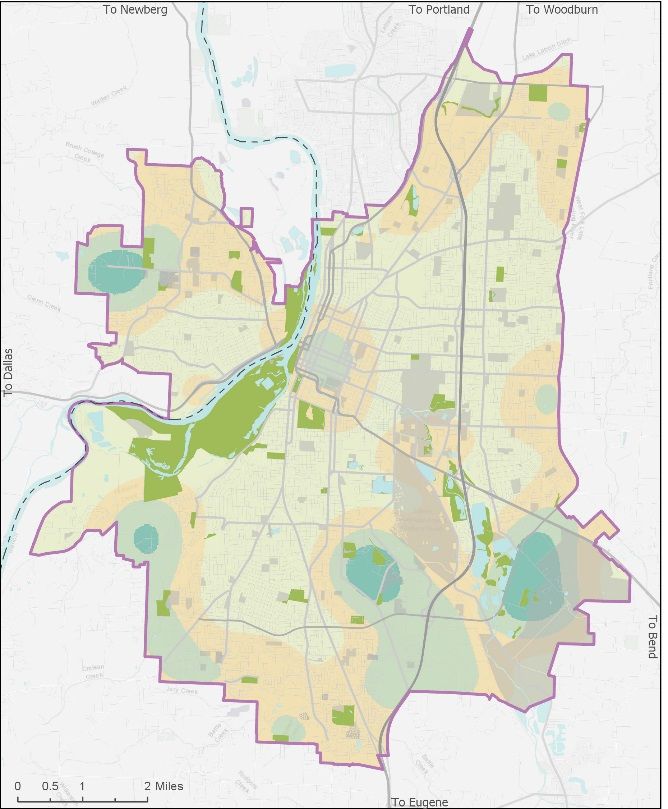
Salem has a mix of housing types

               10
Housing prices are rising following
regional and national trends
11Community Greenhouse Gas
(GhG) Inventory
12Why create a Community GhG
Inventory?
• Human activity releases GhGs into
the atmosphere, and is the primary
cause of global climate (IPCC).
• GhG inventories are a full accounting
of these gases emitted into and
removed (sequestered) from the
atmosphere. Credit: Flickr / Sheila Sund
• A community GhG inventory tracks
emissions and sequestration
associated with activities that occur
within a city, county, or region.
• Measuring multiple years of this data
allows jurisdictions to track progress
toward emissions reduction goals
Credit: PIXNIO
13Community GhG Inventory
Scope
• City of Salem AND Salem UGB
• Annual emissions for 2016
• Sector-based
• Does not include emissions occurring
outside study area from Salem’s
consumption of goods and services like
cars, food, fuels, appliances and clothing.
14What sources do we cover?
DIRECT INDIRECTInventory Results
16Inventory Highlights –
Electricity
Source: Salem Electric and Portland General Electric (2019)
17Inventory Highlights -
Transportation
Source: 2012-2016 American Community Survey (ACS) 5-Year Estimates
18How do other cities compare?
Note: Comparison inventory years vary (Eugene: 2015, Beaverton: 2013,
Bend: 2016, Portland: 2008, Ashland: 2015, Milwaukie: 2016)
19How do other cities compare?
20What’s next?
• Inventory additional
years of data (backward
looking)
• Look to best practices
for setting emissions
reductions targets
• Consider developing a
climate action plan
Credit: State of Oregon Greenhouse Gas Emissions Inventory (2018)
21Indicators and Scenarios
22Indicators Chosen
The indicators are:
1. Variables that can be
measured on a map
2. Questions for which good
data is available
3. Can be influenced by a
Comprehensive Plan
23December Community Workshop
24Top 20 Indicators
“Result Areas”
25Salem is Growing
How We Grow Matters
26What is Scenario Planning?
Conventional Approach: One Possible Future
The Present The Future
27Scenario Planning Explores
Multiple Possible Futures
28Two Future Scenarios
These are not alternative growth scenarios used for Visioning
Both assume current City policies
Scenario 1: Current Trends (Most Likely)
• Population: 54,000 more people (Forecast =60,000)
• Density: Lower than allowed
• Redevelopment: Some
Scenario 2: Zoning Buildout (Maximum Density)
• Population: 93,000 more people
• Density: Maximum allowed (housing)
• Redevelopment: Much more
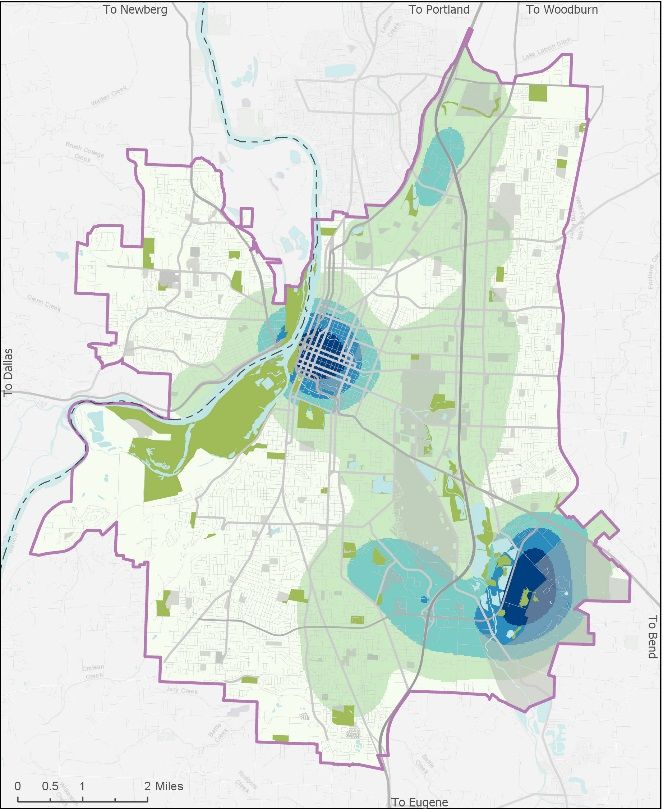
29New Households
Current Trends Zoning Buildout
30New Jobs
Current Trends Zoning Buildout
31New Activity =
Households + Jobs
Current Trends Zoning Buildout
32Many Indicator Results were Different
Similar: Different:
1. Affordability (Housing + 15. Property Tax Revenue
Transportation + Energy) 16. Traffic/Pedestrian Accidents
2. Housing Affordability 17. Infill Development/
3. Complete Neighborhoods Redevelopment
4. Walk and Transit Friendliness 18. Development in Slopes,
5. Jobs/Housing Balance Floodplain and Riparian Areas
6. Active Transportation 19. Greenhouse Gas Emissions
7. Bicycle and Pedestrian Use 20. Air Pollution Reduction
8. Average Wage
9. Tree Canopy
10. Employment Mix
11. Access to Frequent Transit
12. Proximity to Parks and Trails
13. Revenue-to-Cost Ratio
14. Annual Level of ServiceWhy Were They Similar?
• New homes continue to be built on the edges
• New jobs mirror current jobs
• Current policies remain in place
Current Trends Zoning Buildout
34Why Were They Different? • More development in the Zoning Buildout Scenario • Different types of development • Redevelopment • Mixed use Downtown • Population varies between scenarios (54,000 vs. 93,000) • Direct impact on revenue, accidents, etc. • Less to do with where development occurs
Our Salem Report Card

            36
Are we heading in the right
direction?
We seem to be heading in the right direction.
Is this the right direction?
We are moving in the wrong direction.
We are doing well in some areas, doing less well in others, and
we have questions that we need the citizens help to answer.
37Indicator Sheets
Indicator sheets for each “Result Area”
38Jobs/Housing Balance
We seem to be
heading in the
right direction.
Having a good balance of housing and jobs is important for many reasons.
Salem in general is has many jobs and will continue to in the future.Infill & Redevelopment
We seem to be
heading in the
right direction.
About a third of new housing development today is from recent infill or
redevelopment.
This will increase in the future and that aligns with existing policies that
promote infill and redevelopment.Tree Canopy
We are moving
in the wrong
direction.
Trees provide environmental and quality-of-life benefits.
We currently don’t meet our target of 23%.Walking & Biking Trips
We are moving
in the wrong
direction.
Salem has adopted targets to increase walking and biking trips
by 2020. We are not projected to meet our goal.Proximity to Parks
Is this the right
direction?
The percentage of households living within a half-mile
of a park drops in the future.
Will we need more parks in the future?Complete Neighborhoods
A “complete
neighborhood”
means people live
within walking
distance of parks,
schools, grocery
stores, businesses,
transit. Is this the
right
direction?
Is this important
for the future of
Salem?Please Provide Feedback
• Take some time to review
the report card and
indicator sheets
• Ask question and share
your thoughts with the
staff and consultant team
• Mark your grades on the
comment form
45What’s Next?
Community
Visioning!
• How do we want Salem to
grow and develop?
• What do we value?
• What goals do we have?
• How can we improve our
community?
46Visit project website for updates
www.cityofsalem.net/Pages/our-salem.aspx
47Our Salem: Today Public Workshop: May 8, 2019
You can also read