Outline: dipartimento di Fisica UniMi
←
→
Page content transcription
If your browser does not render page correctly, please read the page content below
Monitoring of the covid19 disease in Italy

 Outline:
 • Monitoring of the covid19 disease pg. 2
 • Covid-19 molecular and rapid tests pg. 3
 • Omicron (prevalence estimation) pg. 4
 • Cases / Symptomatic hospitalized / ICUs / deaths comparison (ITALY) pg. 5
 • Cases / deaths/day (Europe) pg. 6
 • Covid 19 Vaccination (Italy) pg. 7
 • SIR model pg. 10
 • Deaths from ICUs in the first pandemic wave pg. 12
 • Reproduction number estimation for the B.1.1.7 lineage (UK variant) pg. 14
 • Case fatality estimation considering serological tests in Italy pg. 15
 • Appendix: data about influenza pg. 17

Prof. Simone Cialdi, Physics Dept., Università degli Studi di Milano (Unimi), in collaboration with Prof. Carlo La Vecchia, Clinical Sciences and
Community Health Dept. (Unimi).
Acknowledgments: S. Cialdi is grateful to Prof. Pasquale Ferrante (Department of Biomedical, Surgical and Dental Sciences, Unimi), Dr. Francesco Canella, Daniele
Cipriani, Prof. Giancarlo Ferrera, Prof. Guido Fratesi, Prof. Nicola Manini, Prof.Giovanni Onida, Prof. Nicola Piovella, Prof. Marco Potenza, Dr. Luca Serafini, Prof.
Stefano Zapperi for useful discussions and support
 1
(Italy) Monitoring of the covid19 disease in Italy Data from Ministero della Salute and ISS
 2020 2021

 %

Mobility= (Retail&recreation+Parks+Transit Data about mobility from Google mobility reports (the Data about vaccinations
stations+Workplaces)/4 baseline is the median value, for the corresponding day of from:https://github.com/italia/covid19-opendata-vaccini 2
 the week, during the 5-week period Jan 3-Feb 6, 2020)
Covid-19 molecular and rapid tests (Italy) Data from Ministero della Salute and ISS

 2021 new cases from molecular swabs test
 new cases from antigen rapid test

 2021 molecular swabs test / day
 antigen rapid test / day

 (new cases from molecular swabs test) / (molecular swabs test / day)
 2021
 (new cases from antigen rapid test) / (antigen rapid test / day)

 T2 = doubling time 3

Omicron (prevalence estimation) Data from Ministero della Salute and ISS

 (new cases from antigen rapid test) / (antigen rapid test / day)

 2021

 Omicron prevalence %
%

 4
Cases / Symptomatic hospitalized / ICUs / Deaths/day comparison (ITALY) Data from Ministero della Salute and ISS

 (new cases from antigen rapid test) / (antigen rapid test / day)

 5
Cases & Deaths/day (Europe) Data from John Hopkins Univ.

 New cases/day / 100000 inhabitants
 Italy
 France
 Spain
 UK
 Germany

 2021
 Italy
 Deaths/day / 100000 inhabitants
 France
 Spain
 UK
 Germany

 2021
 Italy
 France
 Spain ൙ = See
 UK pg.10
 Germany
 + 15 recorded
 ൙

 6
 2021
Covid19 Vaccinations in Italy From ISS report (28 Jan 2021) Age distribution (ITALY)
 %

 7
Covid19 Vaccinations in Italy From ISS report (28 Jan 2021)

 8
pg. 13

 9
SIR model

1 =− r = reproduction number,

 1 − 1
2 = − = = 1 +

3 = C = cases, I = infected

4

 = where p is the case fatality

 1 + 1 Where T is the number of ICUs, q is the ICU probability for an infected, tT is the ICU mean time
5 = − = −
 +
 and are the new accesses to the ICUs

 t, r, p, q, tT estimations from data:

 +
 =
 = = = =
 +
 − −

 10
estimation of the reproduction number (r) from ICUs or hospitalizations

 ǁ 1 −1 Note: r also depends on the reduction of the suscettibles
 From SIR model: = − = Where: = ǁ
 due to the diffusion of the disease and the vaccination

 = 1 + Note that: 1+ = 1 + where k is a constant

 1 Where T is the number of ICUs, q is the ICU probability for an infected and tT is the ICU
 For the ICUs: = −
 mean time

 1 1 1 Note: it is not necessary to
 = + =1+ + =1+ + know the value of q

 1 + 1 +
 tT estimation: = − = − = Where are the new accesses to the ICUs
 +

 −

 + +
 Note that it is possible to write: = 1 + But the data about are only avaliable from 3 Dec 2020

 Note:it is possible to write the same equation for the hospitalizations in place of the ICUs (with different parameters qH and tH). In particular,
 in the case of the small regions dT/dt is very small and the fluctuations on the retrived R are to much big.

 See ref [1] for the results

 [1] Stimare R(t) dalle terapie intensive, Simone Cialdi, Chiara Sabelli. https://www.scienzainrete.it/articolo/stimare-rt-dalle-terapie-intensive/simone-cialdi-
 chiara-sabelli/2021-01-24. 11
(30/11/2020)

 From
 clinical
 (30/11/2020) data

DT = deaths from ICUs (DT=0.1D), T = ICUs, pT
pT=case fatality in the ICUs, tT = ICUs mean time pT≅ 0.3 From SIR
 model

 =
 + tT = 20 days
 −
 Lombardy
 =
 2021
See pg. 8,9 12
Deaths from ICUs in the first pandemic wave:

 T=ICUs
 + 1 1 187660
 = − +
 = න = = See pg. 8,9
 +
 −

 ITALY Considering tT=15days (Italy) and pT=0.3 (see pg. 10):
 H(t)

 + = 12510 < ℎ = 35430 ℎ

 DT = pT T+ = 3753

 DT / D = 10.6%

 2020

 13
Italy
 = 1.5

 % (cases/day)/(testing swabs/day)
 Cases/day
 = 1.25

From pg. 11 of [3] = 1

r is the reproduction number for the current lineage in Italy (r ≈ 1)
rV is the reproduction number for the B.1.1.7 lineage (UK variant) Early phase of the third wave (r ≈ 1) 2021

 ≈ 1.56 ≈ 1.56

 12000 17.8% [4] 1.56 [3] 1 [3] Transmission of SARS-CoV-2 Lineage B.1.1.7 in England: Insights from linking
 epidemiological and genetic data , medRxiv preprint doi:
 https://doi.org/10.1101/2020.12.30.20249034
At 3 Feb cases (0) (0) (0) [4] https://www.iss.it/primo-piano/-/asset_publisher/3f4alMwzN1Z7/content/comunicato-
2021:
 = = + = (0) + (0)
 day stampa-n%25C2%25B011-2021-covid-19-in-italia-il-17-8%2525-delle-infezioni-dovute-
 a-variante-inglese-
 see also:
After 3 Feb 2021: See pg. 8 9 days https://www.trovanorme.salute.gov.it/norme/renderNormsanPdf?anno=2021&codLeg=7
 8758&parte=1%20&serie=null 14
cases ( ) ( ) ( ) (0) −1 (0) [5] Prevalenza delle varianti VOC 202012/01 (lineage B.1.1.7), P.1, e 501.V2 (lineage B.1.351)
 = = + = + in Italia Indagine del 18 febbraio 2021 (ISS). (18 Feb 2021: 54% lineage B.1.1.7 «Inglese»).
 day 4.3% P1 «Brasiliana»
Case fatality estimation considering serological tests in Italy Data from ISTAT 3 Ago 2020 (people tested: 64660)

Regione Inhabitants % positive Deaths (22Jul) Lethality (%)
Piemonte 4325895 3 3114 2.4
 60030210 X 0.023 =
Valle d’Aosta 125052 4 146 2.9
 1381000 cases
Liguria 1534594 3.1 1676 3.5
Lombardia 10017994 7.5 16776 2.2
Bolzano 523422 3.3 292 1.7
Trento 534843 3.1 405 2.4
Veneto 4872440 1.9 1990 2.1
Friuli 1204309 1 349 2.9
Emilia-Romagna 4426983 2.8 4266 3.4
Toscana 3707737 1 1132 3
Umbria 878270 0.9 80 1
Marche 1518186 2.7 984 2.4
Lazio 5843220 1 868 1.5
Abruzzo 1306856 1.5 470 2.4
Molise 302755 0.7 22 1
Campania 5793968 0.7 459 1.1
Puglia 4017306 0.9 548 1.5
Basilicata 559419 0.8 30 0.67
Calabria 1935010 0.6 97 0.83
Sicilia 4978732 0.3 304 2
Sardegna 1633210 0.3 134 2.7
ITALIA 60030201 2.3 34142 2.5

 15
Case fatality estimation by age group in Italy From ISS report 06-10-2020 Deaths by age group Median age From ISS report 22/Jul/2020 ~100% of the deaths Age group A method to estimate the lethality by age group deaths − 2 ? Case fatality (pi) − Estimation of the = Δ = Δ ∆ = 2 2 error: by considering a Lethality Poissonian cases = 60 (0.025. see distribution of the pg. 14) deaths in the age 15 = groups age group index σ 0.67 = = ℎ N = normalization factor consideging the = = age Δ avaliable age groups 16
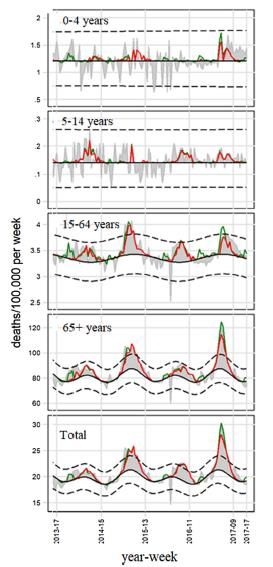
Appendix: data about influenza (1)

 Mortality : is a measure of the number of deaths in a particular population, scaled to the size of that population

 from
 [A1], see 0.01% – 0.04%
 also [A2]

 Attack Rate: in epidemiology, the attack rate is the percentage of the population that contracts the disease

 Results: We included 32 RCTs that had a total of 13,329 participants. The pooled estimates for
 from [A3], see symptomatic influenza were 12.7% (95%CI 8.5%, 18.6%) for children (
Appendix: data about influenza (2)
 Lethality or Case fatality ratio/proportion: lethality is how capable something (disease) is of causing death

 from [A6,A7 and the data at pg. 18] 0.1%-0.4%

 Rise time: is the time taken by a signal to change from a specified low value to a specified high value 9-10 weeks
 (2-3 weeks for Covid19
 see pg.2)

 from [A8] see
 also [A1]

 note: this part of the
 graph is not complete

[A6] https://www.virology.ws/2009/06/16/how-many-people-die-from-influenza/
[A7] https://en.wikipedia.org/wiki/Influenza 18
[A8] https://www.scienzainrete.it/articolo/confermato-eccesso-di-mortalit%C3%A0-molto-superiore-ai-casi-di-covid/luca-carra-roberto-satolli
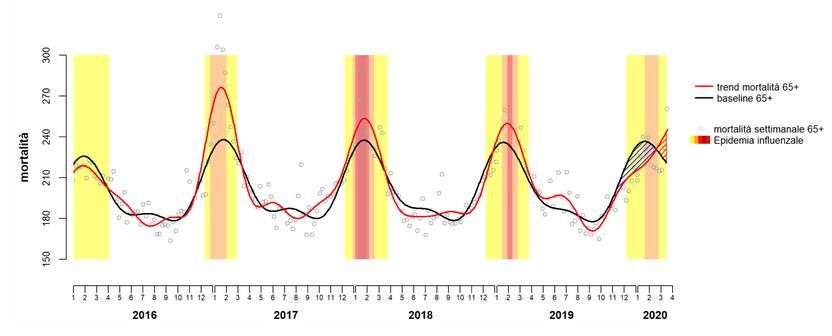
Influenza in Italy
 Appendix: data about influenza (3) Lombardy (Covid19)
 from [A1]
 2020
 Deaths/day:
 Considering the 65+ years

 deaths/day
 population from [A1] we observe a
 peak of 5-20 deaths/100000 per
 week or 0.7-2.8 deaths/100000 per
 day.
 We have to consider that the 65+
 years italian population is 20% of
 the total population and about 30
 50% [A9] of the 65+ years pop. is 7
 vaccinated. So we obtain a peak of
 40-170 deaths/day in Italy Veneto (Covid19)
 2020
 Considering an uniform distribution
 of the cases we obtain a peak of
 about 7-30 deaths/day for

 deaths/day
 Lombardy and 3-15 deaths/day for
 Veneto.

 currently the total number of
 real cases for the Covid19 is 15
 totally unknown
 3

 19
[A9] https://www.epicentro.iss.it/influenza/coperture-vaccinali
You can also read