Party Brands Canada This Month - Public Opinion Research Release Date: August 12, 2021 (Updated August 13) Field Dates: July 22, 2021 to August 4 ...

Page created by Melanie French
 
CONTINUE READING
Party Brands Canada This Month - Public Opinion Research Release Date: August 12, 2021 (Updated August 13) Field Dates: July 22, 2021 to August 4 ...
Canada This Month                               Public Opinion Research
                    Release Date: August 12, 2021 (Updated August 13)
Party Brands                Field Dates: July 22, 2021 to August 4, 2021

                                                STRICTLY PRIVILEGED AND CONFIDENTIAL
Party Brands Canada This Month - Public Opinion Research Release Date: August 12, 2021 (Updated August 13) Field Dates: July 22, 2021 to August 4 ...
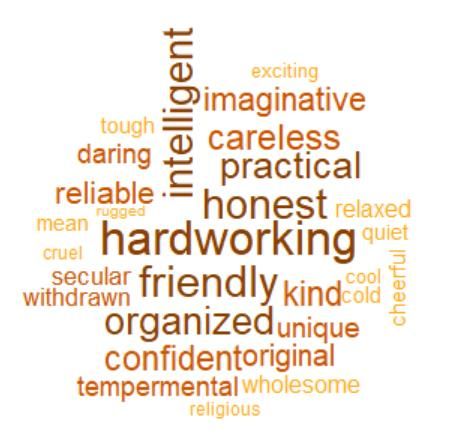
2

Federal Politics in the time of COVID-19
The COVID-19 outbreak has set off a series of changes in the Canadian political landscape. General satisfaction with the
government is up since June to 54%. The Liberals continue to lead in vote over the Conservatives.

Today, INNOVATIVE is releasing results from our July 2021 Canada This Month survey. This online survey was in field
from July 17th to August 4th, 2021 with a weighted sample size of 1,500. Detailed methodology is provided in the
appendix.

This report covers key results on government satisfaction, approval of the federal government on COVID-19 and vote
choice.
Party Brands Canada This Month - Public Opinion Research Release Date: August 12, 2021 (Updated August 13) Field Dates: July 22, 2021 to August 4 ...
Government Approval                         4

           Read, Seen, Heard                           9

           Voter Segments                              13

           Vote Choice                                 22

Table of   Party Voter Pools                           33

Contents
           Brand Loyalty                               42

           Positive and Negative Views of Parties      49

           Brand Personality                           58

           Brand Promise                               66

           Methodology                                 89

           Appendix – Full Brand Personality Results   90
Party Brands Canada This Month - Public Opinion Research Release Date: August 12, 2021 (Updated August 13) Field Dates: July 22, 2021 to August 4 ...
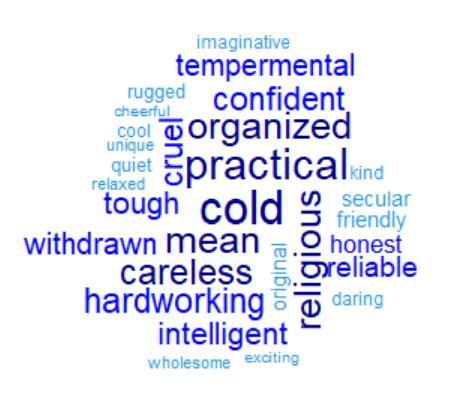
4

Government Approval
A majority of Canadians are satisfied with the federal
government and approve of how they are handling the
pandemic. COVID approval has been growing this summer.
Party Brands Canada This Month - Public Opinion Research Release Date: August 12, 2021 (Updated August 13) Field Dates: July 22, 2021 to August 4 ...
5
Federal Satisfaction: Slightly more than half (54%) are satisfied with
the performance of the federal government
  Generally speaking, how satisfied are you with the performance of the FEDERAL government in Canada? Would you say you are...?
  [asked of all respondents; n=1,500]

                         Satisfied: 54%

                                               43%

                                                                              Dissatisfied: 42%

                                                                       22%                           21%

               11%

                                                                                                                                     4%

          Very satisfied                Somewhat satisfied     Somewhat dissatisfied           Very dissatisfied                  Don't know
Party Brands Canada This Month - Public Opinion Research Release Date: August 12, 2021 (Updated August 13) Field Dates: July 22, 2021 to August 4 ...
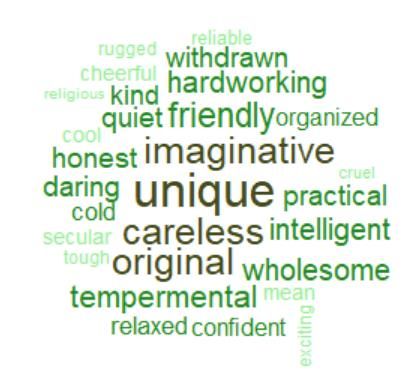
Federal Satisfaction Tracking: Satisfaction with the federal                                                                                                                                                                                                                                                                                                                                                                                                                                                                                                                                 6

government’s performance has gone up since June
              Generally speaking, how satisfied are you with the performance of the FEDERAL government in Canada? Would you say you are...?
              [asked of all respondents; n=1,500]
                                                       2015 Election                                                                                                                                                                                                                                                                                                     2019 Election
                                                                                                                                                                                                                                                                                                                                                                                                                                                                                                                                                                                       4%

28%                                                                                                                                                                                                                                                                                                                                                                                                                                                                                                                                                                                    21%

                                                                                                                                                                                                                                                                                                                                                                                                                                                                                                                                                                                       22%
28%

                                                                                                                                                                                                                                                                                                                                                                                                                                                                                                                                                                                       43%
37%

8%                                                                                                                                                                                                                                                                                                                                                                                                                                                                                                                                                                                     11%
                                                                             Nov-15

                                                                                                                                                                                                                                                        Jul-18

                                                                                                                                                                                                                                                                                                                                         Apr-19

                                                                                                                                                                                                                                                                                                                                                                                 Jul-19

                                                                                                                                                                                                                                                                                                                                                                                                                                                         Jul-20

                                                                                                                                                                                                                                                                                                                                                                                                                                                                                                                                                                                  Jul-21
              Apr-12

                                                           Jun-14

                                                                                                                                                              Jun-17
                       Nov-12

                                         Apr-13
                                                  Apr-14

                                                                                               Apr-16
                                                                                                        Jun-16

                                                                                                                                                     May-17

                                                                                                                                                                                                                             Apr-18
                                                                                                                                                                                                                                      May-18
                                                                                                                                                                                                                                               Jun-18

                                                                                                                                                                                                                                                                                                                                                               May-19
                                                                                                                                                                                                                                                                                                                                                                        Jun-19

                                                                                                                                                                                                                                                                                                                                                                                                                              Apr-20
                                                                                                                                                                                                                                                                                                                                                                                                                                       May-20
                                                                                                                                                                                                                                                                                                                                                                                                                                                Jun-20

                                                                                                                                                                                                                                                                                                                                                                                                                                                                                                                                          Apr-21

                                                                                                                                                                                                                                                                                                                                                                                                                                                                                                                                                                May-21
                                                                                                                                                                                                                                                                                                                                                                                                                                                                                                                                                                         Jun-21
                                                                                                                                                                                                           Feb-18

                                                                                                                                                                                                                                                                                            Nov-18

                                                                                                                                                                                                                                                                                                                                                                                                                                                                           Sep-20

                                                                                                                                                                                                                                                                                                                                                                                                                                                                                             Nov-20
     Mar-12

                                Jan-13

                                                                    Sep-14

                                                                                      Dec-15

                                                                                                                                                                                                  Jan-18

                                                                                                                                                                                                                    Mar-18

                                                                                                                                                                                                                                                                                                              Jan-19

                                                                                                                                                                                                                                                                                                                                                  Apr-19 (2)
                                                                                                                 Aug-16

                                                                                                                                   Dec-16
                                                                                                                                            Jan-17

                                                                                                                                                                       Aug-17

                                                                                                                                                                                         Dec-17

                                                                                                                                                                                                                                                                 Aug-18
                                                                                                                                                                                                                                                                          Sep-18

                                                                                                                                                                                                                                                                                                     Dec-18

                                                                                                                                                                                                                                                                                                                       Feb-19
                                                                                                                                                                                                                                                                                                                                Mar-19

                                                                                                                                                                                                                                                                                                                                                                                          Dec-19
                                                                                                                                                                                                                                                                                                                                                                                                   Jan-20
                                                                                                                                                                                                                                                                                                                                                                                                            Feb-20
                                                                                                                                                                                                                                                                                                                                                                                                                     Mar-20

                                                                                                                                                                                                                                                                                                                                                                                                                                                                  Aug-20

                                                                                                                                                                                                                                                                                                                                                                                                                                                                                                      Dec-20
                                                                                                                                                                                                                                                                                                                                                                                                                                                                                                               Jan-21

                                                                                                                                                                                                                                                                                                                                                                                                                                                                                                                                                   Apr-21 (2)
                                                                                                                                                                                                                                                                                                                                                                                                                                                                                                                        Feb-21
                                                                                                                                                                                                                                                                                                                                                                                                                                                                                                                                 Mar-21
                                                                                                                          Oct-16

                                                                                                                                                                                Oct-17

                                                                                                                                                                                                                                                                                   Oct-18

                                                                                                                                                                                                                                                                                                                                                                                                                                                                                    Oct-20
                                                                                        Very satisfied                                                          Somewhat satisfied                                                                               Somewhat dissatisfied                                                                                      Very dissatisfied                                                                 Don't know
COVID-19 Handling: More than half (54%) of the respondents approve                                                                               7

of how the federal government has been handling COVID-19
  Now thinking about the federal government, do you approve or disapprove of the way the federal government has handled the outbreak of COVID-
  19?
  [asked of all respondents; n=1,500]

                   Approve: 54%

                                         38%

                                                                                         Disapprove: 30%

            16%                                                                    16%
                                                             14%                                            14%

                                                                                                                                     2%

    Strongly approve               Somewhat approve   Neither approve nor   Somewhat disapprove     Strongly disapprove          Don't know
                                                          disapprove
8
COVID-19 Handling Tracking: Approval of the federal gov’ts handling
of COVID-19 has been increasing since late April – up 11 points
              Now thinking about the federal government, do you approve or disapprove of the way the federal government has handled the outbreak of COVID-19?
              [asked of all respondents; n=1,500]

3%                                                                                                                                                                                                                        2%
                                                                                                                                                                                                                          14%
17%
                                                                                                                                                                                                                          16%
16%
                                                                                                                                                                                                                          14%
14%

                                                                                                                                                                                                                           38%
33%

                                                                                                                                                                                                                          16%
17%
                                                                                                       Jul-20

                                                                                                                                                                                                                        Jul-21
                    Mar-20 (2)

                                          Apr-20 (2)

                                                           Apr-20 (3)

                                                                                 Jun-20

                                                                                                                                                                                                  Apr-21 (2)

                                                                                                                                                                                                               Jun-21
                                 Apr-20

                                                                        May-20

                                                                                                                                           Nov-20

                                                                                                                                                                                         Apr-21
     Mar-20

                                                                                                                Aug-20

                                                                                                                         Sep-20

                                                                                                                                                     Dec-20

                                                                                                                                                              Jan-21

                                                                                                                                                                       Feb-21

                                                                                                                                                                                Mar-21
                                                                                                                                  Oct-20
                                                                                          Jun-20 (2)

                                                       Strongly approve                                   Somewhat approve                          Neither approve nor disapprove
                                                       Somewhat disapprove                                Strongly disapprove                       Don't know
Read, Seen, Heard
Half of Canadians have read, seen, or heard something about Trudeau
in the last few days. Among those who have, impact is slightly more
negative than it was in May.
Federal Read, Seen, Heard: Less than half (43%) have RSH something                                                                                     10

the last few days; of those who have, 37% made no difference
   Have you read, seen or heard anything about Canada's Prime Minister       Did what you read, see or hear leave you feeling a lot more favourable,
   and the Federal government in the last few days?                          somewhat more favourable, somewhat less favourable or a lot less
   [asked of all respondents; n=1,500]                                       favourable towards Canada's Prime Minister and the Federal
                                                                             government?
                                                57%                          [asked of those who have RSH; n=643]

                                                                               A lot less favourable                      21%
                 43%
                                                                                                                                     Less Favourable:
                                                                                                                                           31%
                                                                          Somewhat less favourable                  10%

                                                                                Made no difference                               37%

                                                                         Somewhat more favourable                         20%
                                                                                                                                More Favourable:
                                                                                                                                      31%
                                                                              A lot more favourable                 11%
                  Yes                            No
45%
                                                        55%
                                      Mar-12
                                       Apr-12
                                      Nov-12
                                       Jan-13
                                       Apr-13

Note: Don't know not shown.
                                       Apr-14
                                       Jun-14
                                       Sep-14
                                      Nov-15
                                       Dec-15
                                       Apr-16
                                       Jun-16
                                                               [asked of all respondents; n=1,500]

                                      Aug-16
                                       Oct-16
                                       Dec-16
                                       Jan-17
                                      May-17
                                       Jun-17
                                      Aug-17
                                       Oct-17
                                       Dec-17
                                       Jan-18
                                       Feb-18
                                      Mar-18
                                       Apr-18
                                      May-18
                                       Jun-18
                                        Jul-18
                                      Aug-18
                                       Sep-18

                              No
                                       Oct-18
                                      Nov-18
                                       Dec-18
                                       Jan-19
                              Yes

                                       Feb-19
                                      Mar-19
                                       Apr-19
                                    Apr-19 (2)
                                      May-19
                                       Jun-19
                                        Jul-19
                                       Dec-19
                                       Jan-20
                                       Feb-20
                                      Mar-20
                                       Apr-20
                                      May-20
                                       Jun-20
                                        Jul-20
                                                                                                                                                                                                                            the last few days is down from 51% in June to 43% now

                                      Aug-20
                                                                                                     Have you read, seen or heard anything about Canada's Prime Minister and the Federal government in the last few days?

                                       Sep-20
                                       Oct-20
                                      Nov-20
                                       Dec-20
                                       Jan-21
                                       Feb-21
                                      Mar-21
                                       Apr-21
                                    Apr-21 (2)
                                      May-21
                                       Jun-21
                                        Jul-21
                                                 43%
                                                         57%
                                                                                                                                                                                                                            Read, Seen, Heard Tracking: Those saying they have RSH something in
                                                                                                                                                                                                                                                                                11
Federal Read, Seen, Heard, Impact Tracking: The impact of what                                                                                                                                                                                                                                                                                                                                                                                                                                                                                                                                 12

Canadians are hearing has been stable
                  Did what you read, see or hear leave you feeling a lot more favourable, somewhat more favourable, somewhat less favourable or a lot less favourable towards
                  Canada's Prime Minister and the Federal government?
                  [asked of those who have RSH; n=643]
                                                       2015 Election                                                                                                                                                                                                                                                                                     2019 Election

                                                                                                                                                                                                                                                                                                                                                                                                                                                                                                                                                                                        21%
   35%
                                                                                                                                                                                                                                                                                                                                                                                                                                                                                                                                                                                        10%

   14%
                                                                                                                                                                                                                                                                                                                                                                                                                                                                                                                                                                                        37%

   33%

                                                                                                                                                                                                                                                                                                                                                                                                                                                                                                                                                                                        20%
   11%
   6%                                                                                                                                                                                                                                                                                                                                                                                                                                                                                                                                                                                   11%
                                                                                 Nov-15

                                                                                                                                                                                                                                                            Jul-18

                                                                                                                                                                                                                                                                                                                                             Apr-19

                                                                                                                                                                                                                                                                                                                                                                                     Jul-19

                                                                                                                                                                                                                                                                                                                                                                                                                                                             Jul-20

                                                                                                                                                                                                                                                                                                                                                                                                                                                                                                                                                                                      Jul-21
                  Apr-12

                                                                                                                                                                  Jun-17
                           Nov-12

                                             Apr-13
                                                      Apr-14
                                                               Jun-14

                                                                                                   Apr-16
                                                                                                            Jun-16

                                                                                                                                                         May-17

                                                                                                                                                                                                                                 Apr-18
                                                                                                                                                                                                                                          May-18
                                                                                                                                                                                                                                                   Jun-18

                                                                                                                                                                                                                                                                                                                                                                                                                                  Apr-20
                                                                                                                                                                                                                                                                                                                                                                                                                                           May-20
                                                                                                                                                                                                                                                                                                                                                                                                                                                    Jun-20

                                                                                                                                                                                                                                                                                                                                                                                                                                                                                                                                              Apr-21

                                                                                                                                                                                                                                                                                                                                                                                                                                                                                                                                                                    May-21
                                                                                                                                                                                                                                                                                                                                                                                                                                                                                                                                                                             Jun-21
                                                                                                                                                                                                               Feb-18

                                                                                                                                                                                                                                                                                                Nov-18

                                                                                                                                                                                                                                                                                                                                                                   May-19
                                                                                                                                                                                                                                                                                                                                                                            Jun-19

                                                                                                                                                                                                                                                                                                                                                                                                                                                                               Sep-20

                                                                                                                                                                                                                                                                                                                                                                                                                                                                                                 Nov-20
         Mar-12

                                    Jan-13

                                                                        Sep-14

                                                                                          Dec-15

                                                                                                                                                Jan-17
                                                                                                                     Aug-16

                                                                                                                                       Dec-16

                                                                                                                                                                           Aug-17

                                                                                                                                                                                             Dec-17
                                                                                                                                                                                                      Jan-18

                                                                                                                                                                                                                        Mar-18

                                                                                                                                                                                                                                                                     Aug-18
                                                                                                                                                                                                                                                                              Sep-18

                                                                                                                                                                                                                                                                                                         Dec-18
                                                                                                                                                                                                                                                                                                                  Jan-19
                                                                                                                                                                                                                                                                                                                           Feb-19
                                                                                                                                                                                                                                                                                                                                    Mar-19

                                                                                                                                                                                                                                                                                                                                                      Apr-19 (2)

                                                                                                                                                                                                                                                                                                                                                                                              Dec-19
                                                                                                                                                                                                                                                                                                                                                                                                       Jan-20
                                                                                                                                                                                                                                                                                                                                                                                                                Feb-20
                                                                                                                                                                                                                                                                                                                                                                                                                         Mar-20

                                                                                                                                                                                                                                                                                                                                                                                                                                                                      Aug-20

                                                                                                                                                                                                                                                                                                                                                                                                                                                                                                          Dec-20
                                                                                                                                                                                                                                                                                                                                                                                                                                                                                                                   Jan-21

                                                                                                                                                                                                                                                                                                                                                                                                                                                                                                                                     Mar-21

                                                                                                                                                                                                                                                                                                                                                                                                                                                                                                                                                       Apr-21 (2)
                                                                                                                                                                                                                                                                                                                                                                                                                                                                                                                            Feb-21
                                                                                                                              Oct-16

                                                                                                                                                                                    Oct-17

                                                                                                                                                                                                                                                                                       Oct-18

                                                                                                                                                                                                                                                                                                                                                                                                                                                                                        Oct-20
                                               A lot more favourable                                                                            Somewhat more favourable                                                                                             Made no difference                                                                            Somewhat less favourable                                                                                     A lot less favourable

Note: Don't know not shown.
Note: In May '18, this question is asked of all respondents except those in Ontario.
13

We group individuals into segments based
on key political and economic values and
attitudes
We use these segments throughout the remainder of the report to analyze vote results.
14
Core Political Values: Over half (60%) say the main role of government
is to create an equal opportunity so that everyone can compete
       Now we would like to ask a few questions about basic values and             Is the main role of government to…?
       society...When governments make major decisions concerning spending         [asked of all respondents; n=1,500]
       on programs and services, do you think they should be basing their
       decisions mainly on…?                                                    To create equal opportunity so that
       [asked of all respondents; n=1,500]                                   everyone can compete on their own to be                                60%
                                                                                        the best they can be
 Their ability to afford the programs and                                      To redistribute wealth so that the poor
                                                        34%                   and disadvantaged have more than they               32%
                   services
                                                                                      would if left on their own
 The public's need for the programs and
                                                                       58%
                 services
                                                                                                            Don't know    9%
                              Don't know     8%

       Which of the following statements comes closest to your view?               When it comes to government decision making, which of the following
       [asked of all respondents; n=1,500]                                         statements is closest to your view?
                                                                                   [asked of all respondents; n=1,500]

 The profit system brings out the worst in
                                                              41%                  Too often the government listens to
              human nature.                                                                                                             41%
                                                                                    experts instead of common sense.
    The profit system teaches people the
                                                              43%               Provincial issues are complicated so
      value of hard work and success.
                                                                             government should listen to experts when                         47%
                                                                                         it comes to policy.
                               Don't know         16%
                                                                                                             Don't Know    12%
Value Clusters: 1-in-4 (25%) Canadians are Business Liberals followed                                                                                       15

by Thrifty Moderates (19%) and Core Left (17%)
   Clusters are based on 4 basic values: equal opportunity versus redistribution; trust in the profit system; whether spending should be based on ability
   to afford or public need; and whether government should listen to experts or common sense.
   [asked of all respondents; n=1,500]

                                            Thrifty Moderates,                         Populist Conservatives,
                                                    19%                                          11%

                                                                                                      Deferential Conservative, 12%

                                         Core Left, 17%

                                                                                                    Business Liberals, 25%

                                                  Left Liberals, 16%
Defining Value Clusters: Conservative clusters are split based on                                                                            16

whether they think gov’ts should listen to experts or common sense
Core Political Values by Value Clusters

                                                              Populist     Deferential    Business                                Thrifty
                               Column %                                                              Left Liberals   Core Left
                                                            Conservatives Conservatives   Liberals                               Moderates

             Governments              Ability to afford         93%           92%           0%           0%            0%          78%
              should base
             decisions on...              Public Need           0%             0%          97%          94%            96%          0%

                                 Create equal Opportunity       98%           81%          70%          98%            0%          39%
           Is the main role of
            government to .?
                                    Redistribute wealth         0%            16%          22%           0%            94%         35%

           When it comes to       Rely on common sense         100%            0%          34%          44%            33%         45%
             government
           decision making...         Listen to experts         00%           90%          57%          43%            56%         28%
                                 Brings out the worst in
                                     human nature
                                                                0%             0%           0%          83%            86%         64%
          The profit system...
                               Teaches value of hard work
                                      and success
                                                                90%           90%          88%           0%            0%           7%
Segmentation Attitudes: A majority of Canadians believe that you can                                                                                                 17

be anything you want if you’re willing to work for it
        Do you agree or disagree with the following statements? -
        [asked of all respondents; n=1,500]

                                                                                                                  y
      Here in [PROV] you can be anything you
                                                               22%                                 34%                           18%                15%   9%    2%
        want if you are willing to work for it

  x

       No matter how hard I work, every year
                                                               22%                                31%                          22%                  13%   10%   2%
          it seems more difficult to get by

                                 Strongly agree   Somewhat agree     Neither agree nor disagree    Somewhat disagree   Strongly disagree   Don't know
Economic Gap Segmentation: Most Canadians are either Canadian                                                                                           18

Dream Achievers (29%) or Strugglers (27%)
   Gap segmentation: Agree with 'Here in [PROVINCE] you can be anything you want if you are willing to work for it' BY Agree with 'No matter how hard
   I work, every year it seems more difficult to get by'.
   [asked of all respondents; n=1,500]

                                            Don’t believe in
                                         “Canadian Dream”
                                                                                                     Believe in “Canadian Dream”,
                                                                                                     not struggling to get by
                                                                Alienated, 24%    Achievers, 29%

                                                               Ambivalent,
                                                                 20%
                    Neutral or don’t know on                                     Strugglers, 27%
                          “Canadian Dream”

                                                                                              Believe in “Canadian Dream”,
                                                                                              but find it difficult to get by
Federal Party ID: 1-in-3 (30%) identify as Liberals followed by                                                                                                        19

Conservatives (19%) while the NDP trails (14%)
       Now we have just a few last questions for statistical purposes. Thinking about politics in Canada, generally speaking, do you usually think of yourself as a…
       [asked of all respondents; n=1,500]

                        30%

   19%

                                                                                                                                             15%
                                             14%

                                                                                                                                                               7%
                                                        6%
                                                                         4%
                                                                                          2%                                 2%
                                                                                                           0%

Conservative           Liberal               NDP   Bloc Québécois       Green        People's Party   Maverick Party   Something else None/Independent      Don't know
                                                                                                                       (Please specify)
Federal Party ID (Quebec vs. ROC): The Bloc party has taken the lead                                                                       20

party ID in Quebec; the Liberal party still leads the rest of Canada
 Party ID: Quebec                                                  Party ID: Rest of Canada
 [Respondents in Quebec; n=352]                                    [Respondents in the rest of Canada; n=1148]

                                                                                            32%

                                        26%              26%
                  24%
                                                                          22%
                                                                                                                                 21%

                                                                                                                 16%

    9%                                                                                                                  8%
                                  8%            7%

Conservative     Liberal          NDP   Bloc   Other   Unaligned     Conservative          Liberal               NDP   Other   Unaligned
11%
                            13%
                                  17%
                                              27%
                                                      32%
                  Apr-11
                  Oct-13
                 Mar-15
                 May-15
                 Nov-15
                  Dec-15
                  Jan-16
                  Feb-16
                 Mar-16
                  Apr-16
                  Jun-16
                  Sep-16
                  Oct-16
                                                            [asked of all respondents; n=1,500]

                  Dec-16
                  Jan-17
                  Feb-17
                 Mar-17
                  Apr-17
                 May-17
                  Jun-17
                  Aug-17
                  Oct-17
                  Dec-17
                  Jan-18
                                                                                                                                                                                                                                                                  and remains the top party

                  Feb-18
                 Mar-18

Conservative
                  Apr-18
                 May-18
                  Jun-18
                   Jul-18
                  Aug-18
                  Sep-18

Liberal
                  Oct-18
                 Nov-18
                  Dec-18
                  Jan-19
                  Feb-19
NDP

                 Mar-19
                  Apr-19
               Apr-19 (2)
                 May-19
                  Jun-19
                   Jul-19
Other

                  Sep-19
               Sep-19 (2)
                  Oct-19
               Oct-19 (2)
                  Dec-19
                  Jan-20
                  Feb-20
Unaligned

                 Mar-20
                  Apr-20
                 May-20
                  Jun-20
               Jun-20 (2)
                   Jul-20
                  Aug-20
                  Sep-20
                  Oct-20
                 Nov-20
                  Dec-20
                  Jan-21
                  Feb-21
                 Mar-21
                  Apr-21
               Apr-21 (2)
                 May-21
                  Jun-21
                   Jul-21
                            14%
                            14%
                                        22%
                                                    30%

                                        19%
                                                                                                                                                                                                                                                                  Federal Party ID Tracking: Liberal Party ID has increased since June ’21

                                                                                                  Now we have just a few last questions for statistical purposes. Thinking about politics in Canada, generally speaking, do you usually think of yourself as a…
                                                                                                                                                                                                                                                                                                                           21
22

The horserace is mostly steady this month.
Innovative reports on vote intention in two ways.
When we ask people who they would vote for if an election were held today, and who they lean towards if they are
unsure, we call those results Combined vote. This accounts for the views of everyone in the population including
decided voters, undecided voters, and non-voters.

When we look at the results among only decided voters, we call that Decided vote. These results most tell us what the
election results would be like if the survey results matched the election exactly.
Federal Combined Vote: The Liberals (34%) lead over the Conservatives                                                                                        23

(21%) when it comes to the federal vote
   If a federal election were held today, which party would you vote for? In that case, which party do you lean toward slightly? [Vote + Lean]
   [asked of all respondents; n=1,500]

                          34%

       21%

                                         17%

                                                                                                                                   11%

                                                     6%
                                                                     5%
                                                                                     3%                                                             3%
                                                                                                    0%              1%

   Conservative          Liberal         NDP         Bloc           Green      Peoples Party Maverick Party        Other      Undecided DK       Would not
                                                                                                                                                 vote None
1%
                                        8%
                                        9%
                                              14%
                                                           26%
                                                                 33%
                         Jan-08
                        Mar-08
                        May-08
                          Jul-08
                         Sep-08
                        Nov-08
                         Jan-09
                        May-09
                          Jul-09
                         Sep-09
                        Nov-09
                         Jan-10

Conservative
                                                                       [asked of all respondents; n=1,500]

                        Mar-10
                        May-10
                        Nov-10
                        Mar-11
                         Jun-11

Liberal
                         Aug-11
                         Oct-11
                         Dec-11
                        Mar-12
                        Nov-12

NDP
                         Apr-13
                         Dec-13
                        May-14
                         Sep-14
                         Dec-14

Bloc
                         Apr-15
                          Jul-15
                         Sep-15
                        Nov-15
                         Jan-16
Green                   Mar-16
                         Jun-16
                         Sep-16
                                                                                                                                                                                                                                                           Conservatives; the NDP is up this wave

                        Nov-16
                         Jan-17
                        Mar-17
Other

                        May-17
                         Aug-17
                         Dec-17
                         Feb-18
                         Apr-18
                         Jun-18
                         Aug-18
                         Oct-18
                         Dec-18
Undecided DK

                         Feb-19
                         Apr-19
                        May-19
                          Jul-19
                      Sep-19 (2)
                      Oct-19 (2)
                         Jan-20
                        Mar-20
                        May-20
                      Jun-20 (2)
                         Aug-20
                         Oct-20
Would not vote/None
                                                                                                             If a federal election were held today, which party would you vote for? In that case, which party do you lean toward slightly? [Vote + Lean]
                                                                                                                                                                                                                                                           Federal Vote Tracking: The Liberals continue their lead over the

                         Dec-20
                         Feb-21
                         Apr-21
                        May-21
                          Jul-21
                                   3%
                                   4%
                                   5%
                                   6%
                                        11%
                                               17%
                                                                 34%

                                                     21%
                                                                                                                                                                                                                                                                                                              24
Federal Decided Vote: Among the decided voters, the Liberals (39%)                                                                                   25

hold a 14-point lead over the Conservatives (25%)
   If a federal election were held today, which party would you vote for? In that case, which party do you lean toward slightly? [DECIDED]
   [decided voters only; n=1299]

                                   39%

         25%

                                               19%

                                                                   7%
                                                                                      6%
                                                                                                         3%
                                                                                                                             0%               1%

    Conservative               Liberal         NDP                Bloc              Green           Peoples Party      Maverick Party        Other
1%
                                 9%
                                      16%
                                                    29%
                                                          37%
                  Jan-08
                 Mar-08
                 May-08
                   Jul-08
                  Sep-08
                 Nov-08
                  Jan-09
                 May-09
                   Jul-09
                  Sep-09
                                                                  [only decided voters; n=1299]

                 Nov-09
                  Jan-10
                 Mar-10
                 May-10
                 Nov-10
                 Mar-11
                  Jun-11
                  Aug-11
                  Oct-11
                  Dec-11
                 Mar-12
                 Nov-12
                  Apr-13

Conservative
                  Dec-13
                 May-14
                  Sep-14
                  Dec-14
                  Apr-15

Liberal
                   Jul-15
                  Sep-15
                 Nov-15
                  Jan-16
NDP              Mar-16
                  Jun-16
                  Sep-16
                 Nov-16
                  Jan-17
Bloc

                 Mar-17
                 May-17
                  Aug-17
                  Dec-17
                  Feb-18
                  Apr-18
Green

                  Jun-18
                  Aug-18
                  Oct-18
                  Dec-18
                  Feb-19
Other
                                                                                                                                                                                                                                            Conservatives are continuing their downward trend

                  Apr-19
                 May-19
                   Jul-19
               Sep-19 (2)
               Oct-19 (2)
                  Jan-20
                 Mar-20
                 May-20
               Jun-20 (2)
                  Aug-20
                                                                                                  If a federal election were held today, which party would you vote for? In that case, which party do you lean toward slightly? [DECIDED]

                  Oct-20
                  Dec-20
                  Feb-21
                                                                                                                                                                                                                                            Federal Decided Vote Tracking: The Liberals maintain their lead,

                  Apr-21
                 May-21
                   Jul-21
                            7%
                            6%
                            5%
                                        19%
                                              25%
                                                            39%
                                                                                                                                                                                                                                                                                                 26
Decided Vote by Region: The Liberals hold a lead in BC, ON, and the                                  27

Atlantic provinces
 Decided vote by Region
                                                             Region

                               BC        AB       Prairies             ON        QC       Atlantic
                              (N=177)   (N=152)    (N=82)             (N=516)   (N=287)    (N=85)

               Conservative    21%       42%        37%                23%       15%        27%

                 Liberal       37%       27%        38%                47%       32%        40%
Decided Vote

                  NDP          31%       20%        13%                20%       12%        22%

                   Bloc          -         -         -                   -       32%         -

                  Green         9%        3%        2%                  6%        6%        8%

                  Other         2%        9%        10%                 5%        2%        3%
Decided Vote by Value Cluster: Thrifty Moderates are split, with                                                                 28

  almost 1-in-3 voting Conservative or Liberal
                                                                                  Value Clusters
                                       Deferential      Populist                                            Thrifty
                                                                      Business Liberals    Left Liberals               Core Left
                                      Conservatives   Conservatives                                        Moderates
                                         (N=167)         (N=142)           (N=319)           (N=214)        (N=198)     (N=259)

                       Conservative       43%             58%               19%                11%           32%          6%
Federal Decided Vote

                         Liberal          32%             17%               47%                44%           33%         45%

                          NDP              9%              6%               16%                26%           15%         35%

                           Bloc            9%              3%                8%                7%             8%          6%

                          Green            4%              2%                8%                8%             6%          5%

                          Other            3%             14%                2%                4%             6%          3%
Decided Vote by Economic Gap: Liberal are the most popular party                                  29

  across the economic gap clusters
                                                               Economic Gap

                                      Achievers   Strugglers              Ambivalent    Alienated

                                       (N=390)     (N=354)                    (N=232)    (N=323)

                       Conservative     29%         24%                        28%        17%
Federal Decided Vote

                         Liberal        42%         38%                        38%        36%

                          NDP           12%         14%                        19%        35%

                           Bloc          7%         11%                         6%         3%

                          Green          5%          6%                         6%         7%

                          Other          5%          6%                         4%         3%
Decided Vote by Party ID: Liberal and CPC partisans are about equally                                               30

loyal with over 85% of their votes going towards their own party
                                                               Federal Party Identification

                                      Conservative   Liberal              NDP                 Other     Unaligned

                                        (N=285)      (N=433)             (N=206)              (N=204)    (N=170)

                       Conservative       86%          4%                  4%                   8%        19%
Federal Decided Vote

                         Liberal          7%          88%                 13%                   6%        37%

                          NDP             3%           6%                 79%                   9%        20%

                           Bloc           0%           0%                  1%                  40%         5%

                          Green           1%           1%                  2%                  21%        12%

                          Other           3%           1%                  1%                  16%         7%
Federal 2nd Choice: A plurality of decided voters either choose the                                                                            31

NDP (21%) as their second choice or are undecided (25%)
   And which party would be your second choice?
   [only decided voters; n=1299]

                                                                                                                          25%

                                                   21%

                                   15%

                                                                                       10%                                            11%
          9%
                                                                                                           7%

                                                                     3%

   Conservative 2nd       Liberal 2nd Choice   NDP 2nd Choice   Bloc 2nd Choice   Green 2nd Choice   Other 2nd Choice   Undecided   WNV/None
       Choice
2nd
                                                                                                                                                 32
Federal 2nd Choice: The top                                                              choice of Liberal voters is the NDP and
vice versa
 And which party would be your second choice? BY [Vote+Lean]
                                                                                               First Choice
                                         Conservative 1st                    Liberal 1st
                                                                                             NDP 1st Choice   Bloc 1st Choice Green 1st Choice
                                             Choice                            Choice
                                                    (N=318)                    (N=503)           (N=252)          (N=92)           (N=75)
                Conservative 2nd
                                                       0%                       13%                8%               6%              6%
                    Choice
                Liberal 2nd Choice                    16%                        0%               40%              20%              20%
Second Choice

                 NDP 2nd Choice                       12%                       36%                0%              18%              37%

                 Bloc 2nd Choice                       4%                        3%                3%               0%              3%

                Green 2nd Choice                       5%                       10%               20%              11%              0%

                Other 2nd Choice                      13%                        3%                3%               4%              9%

                   Undecided                          29%                       26%               20%              24%              24%

                   WNV/None                           19%                        9%                5%              17%              1%

 Note: 'Other' in Combined Vote not shown due to insufficient sample size.
Party Voter Pools
How many people are actively considering each of the parties?
The Liberals across Canada have the largest pool of accessible vote with 41% giving the Liberals a 7 or better on an 11-
point likelihood to vote scale.

The Bloc are the strongest challenger with 37% of Quebecers at 7 or better.

The CPC stand-out from the remaining parties with a relatively large base of definite voters but their total pool at 7 or
better is just 28%. The NDP have fewer definite voters than the CPC but have a total voter pool of 39% at 7 or higher.

The Green party have a pool of 17% at 7 or higher, the PPC are at 11% and the Maverick are at 8%.
34
Federal Vote: Over half of the respondents say they will not vote for the
Maverick party; Liberals with highest response in voting for their party
      If the federal election were held today, how likely would you be to vote for each of the following federal political parties?
Q     [asked of all respondents; n=1,500]

      The Liberal Party of Canada                  16%              7%            10%               8%            5%        9%             3% 3%                       27%                  6%

    The Bloc Quebecois [QC ONLY]                   15%             5%        7%            10%               6%         13%            5%     5% 4% 2%                     22%               5%

The Conservative Party of Canada               12%            5%    5%        6%           5%        9%           3% 3% 4% 4%                                 36%                           7%

     The New Democratic Party of
                        Canada                8%         6%        8%             8%            7%                11%        6%       5% 4% 4%                         25%                  6%

         People’s Party of Canada           4%2%2% 3% 3%           8%        5% 4% 4% 5%                                                        50%                                        9%

                   The Green Party          3% 3% 5%          6%        6%         11%               6%       5%        6%       6%                            36%                          7%

     The Maverick Party [Western
                   Canada ONLY]         2%1%3%2%2% 6% 2%3% 4% 5%                                                                     54%                                             16%

              10 - Definitely WILL vote for this party        9     8        7         6        5        4         3    2        1     0 - Definitely WILL NOT vote for this party   Don’t know
Federal Vote for Liberals: Almost 3-in-10 (27%) will not vote for the                                                                                       35

Liberals; while 16% say they will definitely vote for them
      If the federal election were held today, how likely would you be to vote for each of the following federal political parties?
 Q    The Liberal Party of Canada
      [asked of all respondents; n=1,500]

                                                                                                                                      27%

       16%

                                       10%                             9%
                        7%                      8%
                                                          5%                                                                                     6%
                                                                                   4%
                                                                                                3%          3%           2%

        10 -              9                 8   7          6            5            4           3            2           1           0-       Don’t know
     Definitely                                                                                                                   Definitely
     WILL vote                                                                                                                    WILL NOT
      for this                                                                                                                   vote for this
       party                                                                                                                        party
Federal Vote for Conservatives: Almost 2-in-5 (36%) will not vote for                                                                                       36

the Conservatives, while 12% say they definitely will vote for them
      If the federal election were held today, how likely would you be to vote for each of the following federal political parties?
 Q    The Conservative Party of Canada
      [asked of all respondents; n=1,500]

                                                                                                                                      36%

       12%
                                                                       9%
                                                6%                                                                                               7%
                        5%              5%                5%                                                4%           4%
                                                                                   3%           3%

        10 -              9                 8   7          6            5            4           3            2           1           0-       Don’t know
     Definitely                                                                                                                   Definitely
     WILL vote                                                                                                                    WILL NOT
      for this                                                                                                                   vote for this
       party                                                                                                                        party
Federal Vote for NDP: 1-in-4 (25%) of respondents will not vote NDP,                                                                                       37

while only 8% say they definitely will vote for them
     If the federal election were held today, how likely would you be to vote for each of the following federal political parties?
Q    The New Democratic Party of Canada
     [asked of all respondents; n=1,500]

                                                                                                                                     25%

                                                                     11%
       8%                              8%      8%
                                                         7%                                                                                     6%
                       6%                                                         6%           5%          4%           4%

       10 -              9                 8   7          6            5            4           3            2           1           0-       Don’t know
    Definitely                                                                                                                   Definitely
    WILL vote                                                                                                                    WILL NOT
     for this                                                                                                                   vote for this
      party                                                                                                                        party
Federal Vote for Bloc Québécois: 1-in-5 (22%) say they will not vote                                                                                        38

Bloc Québécois while 15% say they definitely will vote for them
      If the federal election were held today, how likely would you be to vote for each of the following federal political parties?
 Q    The Bloc Québécois
      [asked of all respondents in Quebec; n=352]

                                                                                                                                      22%

       15%
                                                                      13%
                                                    10%
                                        7%
                        5%                                6%                       5%           5%                                               5%
                                                                                                            4%
                                                                                                                         2%

        10 -              9              8           7     6            5            4           3            2           1           0-       Don’t know
     Definitely                                                                                                                   Definitely
     WILL vote                                                                                                                    WILL NOT
      for this                                                                                                                   vote for this
       party                                                                                                                        party
Federal Vote for the Green Party: Only 3% say they will definitely vote                                                                                     39

for the Greens, but only 36% say they definitely will not
      If the federal election were held today, how likely would you be to vote for each of the following federal political parties?
 Q    The Green Party of Canada
      [asked of all respondents; n=1,500]

                                                                                                                                      36%

                                                                      11%
                                                6%        6%                       6%                       6%           6%                      7%
                                        5%                                                      5%
        3%              3%

        10 -              9                 8   7          6            5            4           3            2           1           0-       Don’t know
     Definitely                                                                                                                   Definitely
     WILL vote                                                                                                                    WILL NOT
      for this                                                                                                                   vote for this
       party                                                                                                                        party
Federal Vote for The People’s Party of Canada: Half (50%) say they will                                                                                     40

definitely not vote for this party, while only 4% will vote for them
      If the federal election were held today, how likely would you be to vote for each of the following federal political parties?
 Q    The People’s Party of Canada
      [asked of all respondents; n=1,500]

                                                                                                                                      50%

                                                                       8%                                                                        9%
        4%                                      3%        3%                       5%           4%          4%           5%
                        2%              2%

        10 -              9                 8   7          6            5            4           3            2           1           0-       Don’t know
     Definitely                                                                                                                   Definitely
     WILL vote                                                                                                                    WILL NOT
      for this                                                                                                                   vote for this
       party                                                                                                                        party
Federal Vote for The Maverick Party: Over half (54%) say they will                                                                                          41

not vote for this party, while only 2% will definitely vote for them
      If the federal election were held today, how likely would you be to vote for each of the following federal political parties?
 Q    The Maverick Party
      [asked of all respondents in Western Canada; n=469]

                                                                                                                                      54%

                                                                                                                                                16%

                                                                       6%                                                5%
        2%                             3%              2%                          2%           3%          4%
                        1%                                      2%

        10 -             9               8                  7   6       5            4           3            2           1           0-       Don’t know
     Definitely                                                                                                                   Definitely
     WILL vote                                                                                                                    WILL NOT
      for this                                                                                                                   vote for this
       party                                                                                                                        party
Brand Loyalty
Innovative explores brand loyalty by asking participants to recall how often they have
voted for the 5 parties that have been around for the past two decades.
Just over half (51%) of all Canadians say they have voted Liberal at least occasionally.

Once again the Bloc is the strongest challenger with 43% occasionally voting Bloc.

The CPC have 38% of voters saying they at least occasionally vote Conservative.

The NDP are further back with 33% voting occasionally and fewer of those voting NDP all the time.

The Greens have 20% who report at least occasionally voting Green.
                                                                                                STRICTLY PRIVILEGED AND CONFIDENTIAL
Brand Loyalty Overview: Majority (61%) have never voted for the                                                                                             43

Green party, while 18% say they always vote Liberal
      The biggest parties in Canada have been largely consistent since 2004 when the Canadian Alliance and Reform Party merged to become the
Q     Conservative Party of Canada. Since then, on a scale of 1 to 5 where 1 is never and 5 is always, how often have you voted for each of the following
      parties?
      [asked of all respondents; n=1,500]

            Liberal                18%                     18%               15%          10%                        31%                       8%

      Conservative              14%                12%           12%         8%                           45%                                 9%

    Bloc Québécois              14%                 16%                13%         11%                        36%                           11%

                NDP        7%               11%           15%            13%                              45%                                 9%

              Green      4%      6%          10%         10%                                    61%                                           9%

                                                   Always -5             4           3               2               Never -1               Don’t know
The Liberal Party: 1-in-5 (18%) say they always vote for the Liberal                                                                                44

party; men and those who reside in ON likely to always vote Liberal
     On a scale of 1 to 5 where 1 is never and 5 is always, how often have you voted for each of the        Segmentation
 Q   following parties? The Liberal Party                                                                   Those who say ‘Always’
     [asked of all respondents; n=1,500]                                                                                   Age-Gender
                                                                                                              M 18-34            19%
                                                                                                              M 35-54            19%          20%
                                                                                                               M 55+              21%
                                                                                                              W 18-34           14%
                                                                                                              W 35-54           14%           16%
                                                                                                               W 55+             20%
                                                                                                                             Region
                                                                                                                     BC         17%
                                                                                                                Alberta        11%
                                                                                                                Prairies         19%
                                                                                                                Ontario           22%
                                                                                                               Quebec           15%
                                                                           31%                         Atlantic Canada           19%
                                                                                                                            Party ID
        18%                  18%           15%                                                           Conservative        3%
                                                          10%                                8%               Liberal                   48%
                                                                                                                 NDP         5%
                                                                                                                 Bloc        4%
     Always -5                  4           3               2             Never -1       Don’t know      Green/Other          8%
                                                                                                           Unaligned         6%
The Conservative Party: Over 1-in-10 (14%) say they have always voted                                                                               45

for the Conservative party; highest among those in AB & Prairies
    On a scale of 1 to 5 where 1 is never and 5 is always, how often have you voted for each of the        Segmentation
Q   following parties? The Conservative Party                                                              Those who say ‘Always’
    [asked of all respondents; n=1,500]                                                                                   Age-Gender
                                                                                                             M 18-34            19%
                                                                                                             M 35-54           16%            17%
                                                                                                              M 55+            17%
                                                                                                             W 18-34         7%
                                                                                                             W 35-54          10%             10%
                                                                                                              W 55+           13%
                                                                                                                            Region
                                                                                                                    BC        10%
                                                                                                               Alberta            26%
                                                                          45%                                  Prairies          22%
                                                                                                               Ontario         14%
                                                                                                              Quebec         7%
                                                                                                      Atlantic Canada          14%
                                                                                                                           Party ID
       14%                  12%           12%                                                           Conservative                    53%
                                                          8%                                9%
                                                                                                             Liberal        4%
                                                                                                                NDP         2%
                                                                                                                Bloc        4%
    Always -5                  4           3               2             Never -1       Don’t know
                                                                                                        Green/Other          10%
                                                                                                          Unaligned         2%
The Bloc Québécois: 14% of respondents have always voted for the                                                                                  46

Bloc Québécois; highest among older respondents
    On a scale of 1 to 5 where 1 is never and 5 is always, how often have you voted for each of the     Segmentation
Q   following parties? The Bloc Québécois                                                               Those who say ‘Always’
    [asked of all respondents in Quebec; n=352]                                                                      Age-Gender
                                                                                                          M 18-34      4%
                                                                                                          M 35-54      2%                   11%

                                                                                                            M 55+               24%
                                                                                                          W 18-34       7%
                                                                                                          W 35-54        10%                15%
                                                                                                            W 55+               24%
                                                                                                                     Party ID

                                                                          36%                         Conservative     2%
                                                                                                           Liberal     2%
       14%                  16%                   13%                                                        NDP       1%
                                                         11%                               11%
                                                                                                              Bloc                    48%
                                                                                                      Green/Other      0%
    Always -5                 4                    3       2             Never -1       Don’t know
                                                                                                        Unaligned      2%
The New Democrat Party: Less than 1-in-10 (7%) say they have                                                                                     47

always voted for NDP; highest among younger respondents
    On a scale of 1 to 5 where 1 is never and 5 is always, how often have you voted for each of the        Segmentation
Q   following parties? The New Democratic Party                                                            Those who say ‘Always’
    [asked of all respondents; n=1,500]                                                                                   Age-Gender
                                                                                                             M 18-34          12%
                                                                                                             M 35-54         7%             7%
                                                                                                              M 55+         2%
                                                                                                             W 18-34          10%
                                                                                                             W 35-54         6%             7%
                                                                                                              W 55+          7%
                                                                                                                            Region
                                                                                                                    BC       10%
                                                                                                               Alberta       8%
                                                                                                               Prairies      10%
                                                                          45%                                  Ontario       8%
                                                                                                              Quebec        3%
                                                                                                      Atlantic Canada       6%
                                                                                                                           Party ID
                            11%           15%            13%                                            Conservative        2%
        7%                                                                                  9%               Liberal        2%
                                                                                                                NDP                   35%
                                                                                                                Bloc        3%
    Always -5                  4           3               2             Never -1       Don’t know      Green/Other          5%
                                                                                                          Unaligned         1%
The Green Party: Only 4% of respondents have always voted for the                                                                           48

Green party; highest among young men
    On a scale of 1 to 5 where 1 is never and 5 is always, how often have you voted for each of the        Segmentation
Q   following parties? The Green Party                                                                     Those who say ‘Always’
    [asked of all respondents; n=1,500]                                                                                   Age-Gender
                                                                                                             M 18-34          11%
                                                                                                             M 35-54         5%        6%
                                                                                                              M 55+         2%
                                                                                                             W 18-34         5%
                                                                                                             W 35-54         3%        3%
                                                                                                              W 55+         1%
                                                                                                                            Region
                                                                          61%                                       BC       5%
                                                                                                               Alberta      3%
                                                                                                               Prairies     1%
                                                                                                               Ontario       6%
                                                                                                              Quebec        3%
                                                                                                      Atlantic Canada        4%
                                                                                                                           Party ID
                                                                                                        Conservative        3%
                                          10%            10%                                9%                               4%
        4%                   6%                                                                              Liberal
                                                                                                                NDP         1%
                                                                                                                Bloc         5%
    Always -5                  4           3               2             Never -1       Don’t know      Green/Other            16%
                                                                                                          Unaligned         2%
Positive and Negative Views of Parties
Many voters have both positive and negative feelings about parties, so we ask voters to
describe how positive or negative their views are for each party.
There has been a lot of change in how people feel about the parties since the 2019 election. Just prior to that campaign
we found only the Green party had net positive views. The NDP and the Liberals were around 10 percent more negative
than positive., The CPC and the Bloc were around 15 percent more negative than positive. The PPC had 24 percent more
negative than positive views.

Those numbers have changed significantly. The Bloc now has the positive brand with 13 percent more favourable than
unfavourable views. The NDP is also now in positive territory with 5 percent more voters feeling positive rather than
negative. The Liberals now have as many negative as positive views.

The Green numbers have flipped with 8 percent more negative than positive views. The CPC have dropped further to 22
percent more negative than positive views. The PPC has also lost a little more ground now with 28 percent more
negative than positive views.
Views of Parties: The Bloc Québécois has the highest positive net views                                                                                                                          50

and the biggest positive change in net views since June 2019
       Thinking about each of the following parties, please indicate if you have all positive, mostly positive, some positive and some negative, mostly
Q
       negative, or all negative views of that party. If you don’t know enough about the party to say, please indicate that.                                                           Net Views
       [asked of all respondents; n=1,500]

        The Bloc Québécois         June 2019         8%               17%                20%                     16%                          25%                       15%               -16%
                 [QC ONLY]          July 2021             13%                      23%                        28%                       10%               13%               12%           +13%

The New Democratic Party           June 2019    3%              18%                            34%                              17%                   13%                   14%            -9%
                                    July 2021    6%                    24%                             33%                              14%               11%               13%            +5%

            The Liberal Party      June 2019     7%                    21%                       27%                            18%                       19%                     8%      -10%
                                    July 2021        9%                     23%                         31%                           14%                       17%               7%       +1%

             The Green Party       June 2019     5%                    25%                             30%                        11%               10%                18%                 +9%
                                    July 2021   4%              15%                       32%                             15%                 12%                     21%                  -8%

     The Conservative Party        June 2019         7%               18%                      25%                        20%                         20%                    10%          -15%
                                    July 2021   5%               16%                     27%                              22%                             21%                 9%          -22%

    People’s Party of Canada       June 2019    3%        7%                 20%           13%                      21%                                    35%                            -24%
                                    July 2021   3%        7%            18%              12%                     26%                                        35%                           -28%

                                                     All positive views                  Mostly positive views                    A mix of positive and negative views
                                                     Mostly negative views               All negative views                       Don’t know enough to say
51
Party views: The Bloc Québécois have the highest positive views (36%)
followed by the Liberals (32%)
    Thinking about each of the following parties, please indicate if you have all positive, mostly positive, some positive and some negative, mostly negative, or
Q   all negative views of that party. If you don’t know enough about the party to say, please indicate that.
    [asked of all respondents; n=1,500]                                                                                                                                Positive
                                                                                                                                                                        views

               The Bloc Québécois              13%                     23%                              28%                  10%            13%                 12%      36%

                  The Liberal Party         9%                   23%                                 31%                    14%                 17%               7%     32%

       The New Democratic Party           6%                    24%                               33%                       14%               11%           13%          30%

           The Conservative Party         5%              16%                    27%                             22%                       21%                   9%      21%

                   The Green Party        4%         15%                           32%                           15%             12%                      21%            19%

         People’s Party of Canada         3% 7%                 18%              12%                       26%                                35%                        10%

                                     All positive views                      Mostly positive views                 A mix of positive and negative views
                                     Mostly negative views                   All negative views                    Don’t know enough to say
52
Conservative Party views: 1-in-5 (21%) have a positive view of the
Conservative Party; men have a higher positive view than women
     Thinking about each of the following parties, please indicate if you have all positive, mostly positive,   Segmentation
Q    some positive and some negative, mostly negative, or all negative views of that party. If you don’t        Among those who say “Positive”
     know enough about the party to say, please indicate that.                                                                        Age-Gender
     The Conservative Party                                                                                              M 18-34              24%
     [asked of all respondents; n=1,500]
                                            -22%                                                                         M 35-54
                                                                                                                          M 55+
                                                                                                                                              27%
                                                                                                                                              27%
                                                                                                                                                            26%

                                              Net                                                                        W 18-34            16%
                                            Positive                                                                                                        17%
           21% Positive                                             43% Negative                                         W 35-54            18%
                                                                                                                          W 55+             17%
                                                                                                                                        Region
                                               27%
                                                                                                                                BC          18%
                                                                  22%                                                      Alberta              34%
                                                                                    21%                                    Prairies           26%
                                                                                                                           Ontario           22%
                                 16%                                                                                      Quebec           15%
                                                                                                                  Atlantic Canada            22%
                                                                                                                                       Party ID
                                                                                                        9%           Conservative                     67%
                                                                                                                          Liberal          12%
           5%                                                                                                                NDP         7%
                                                                                                                             Bloc        5%
                                                                                                                     Green/Other            15%
                                                                                                                       Unaligned          9%
    All positive views Mostly positive A mix of positive Mostly negative All negative views Don’t know
                           views         and negative        views                          enough to say
                                            views
53
Liberal Party views: Respondents are evenly split on having positive and
negative view about the Liberals; highest positive views in Ontario
      Thinking about each of the following parties, please indicate if you have all positive, mostly positive,   Segmentation
Q     some positive and some negative, mostly negative, or all negative views of that party. If you don’t        Among those who say “Positive”
      know enough about the party to say, please indicate that.                                                                   Age-Gender
      The Liberal Party                                                                                                           M 18-34               33%
      [asked of all respondents; n= 1,500]                                                                                        M 35-54              32%     32%
                                             +1%                                                                                   M 55+               31%
                                               Net                                                                                W 18-34              31%
                                             Positive                                                                             W 35-54              30%     32%

            32% Positive                                           31% Negative                                                    W 55+                34%
                                                                                                                                      Region
                                               31%
                                                                                                                                         BC          32%
                                                                                                                                    Alberta        24%
                                 23%                                                                                                Prairies        28%
                                                                                                                                    Ontario           37%
                                                                                    17%                                            Quebec           28%
                                                                                                                           Atlantic Canada           33%
                                                                 14%                                                                Party ID
                                                                                                                              Conservative        9%
           9%                                                                                                                      Liberal                    72%
                                                                                                        7%
                                                                                                                                      NDP          22%
                                                                                                                                      Bloc        15%
                                                                                                                              Green/Other          18%
                                                                                                                                Unaligned         13%
    All positive views Mostly positive A mix of positive Mostly negative All negative views Don’t know
                           views         and negative        views                          enough to say
                                            views
54
New Democratic Party views: 3-in-10 (30%) of respondents have a
positive view of the NDP, higher among younger men and women
      Thinking about each of the following parties, please indicate if you have all positive, mostly positive,   Segmentation
Q     some positive and some negative, mostly negative, or all negative views of that party. If you don’t        Among those who say “Positive”
      know enough about the party to say, please indicate that.                                                                   Age-Gender
      The New Democratic Party                                                                                                    M 18-34            35%
      [asked of all respondents; n=1,500]
                                             +5%                                                                                  M 35-54
                                                                                                                                   M 55+
                                                                                                                                                    30%
                                                                                                                                                   24%
                                                                                                                                                            29%

                                               Net                                                                                W 18-34             39%
                                             Positive                                                                                                       30%
                                                                                                                                  W 35-54           28%
            30% Positive                                           25% Negative                                                    W 55+           25%
                                               33%                                                                                    Region
                                                                                                                                         BC          37%
                                                                                                                                    Alberta         30%
                                 24%                                                                                                Prairies       26%
                                                                                                                                    Ontario         31%
                                                                                                                                   Quebec          24%
                                                                                                                           Atlantic Canada          32%
                                                                 14%                                   13%                          Party ID
                                                                                    11%                                       Conservative        13%
                                                                                                                                   Liberal          31%
           6%                                                                                                                         NDP                   84%
                                                                                                                                      Bloc        18%
                                                                                                                              Green/Other          23%
                                                                                                                                Unaligned         15%
    All positive views Mostly positive A mix of positive Mostly negative All negative views Don’t know
                           views         and negative        views                          enough to say
                                            views
55
Bloc Québécois views: Almost 4-in-10 (36%) Quebec residents find the
Bloc Québécois positive; highest among older men and women
      Thinking about each of the following parties, please indicate if you have all positive, mostly positive,   Segmentation
Q     some positive and some negative, mostly negative, or all negative views of that party. If you don’t        Among those who say “Positive”
      know enough about the party to say, please indicate that.                                                                   Age-Gender
      The Bloc Québécois
      [asked of all respondents in Quebec; n=352]
                                                                                                                                  M 18-34          30%
                                                    13%                                                                           M 35-54          28%
                                                                                                                                                               37%
                                                      Net
                                                    Positive                                                                        M 55+                50%
              36% Positive                                          23% Negative
                                                                                                                                  W 18-34          24%
                                                     28%                                                                                                       36%
                                                                                                                                  W 35-54          27%
                                23%                                                                                                 W 55+                50%
                                                                                                                                     Party ID

                                                                                                                              Conservative        15%
          13%                                                                       13%                12%                          Liberal       18%
                                                                 10%
                                                                                                                                      NDP           37%
                                                                                                                                      Bloc                     85%
                                                                                                                              Green/Other         17%
                                                                                                                                 Unaligned        18%
    All positive views Mostly positive A mix of positive Mostly negative All negative views Don’t know
                           views         and negative        views                          enough to say
                                            views
56
Green Party views: 2-in-5 (19%) of respondents have a positive view of
the Green party; higher among younger respondents
      Thinking about each of the following parties, please indicate if you have all positive, mostly positive,   Segmentation
Q     some positive and some negative, mostly negative, or all negative views of that party. If you don’t        Among those who say “Positive”
      know enough about the party to say, please indicate that.                                                                   Age-Gender
      The Green Party                                                                                                             M 18-34             29%
      [asked of all respondents; n=1,500]
                                              -8%                                                                                 M 35-54
                                                                                                                                   M 55+          8%
                                                                                                                                                     24%      19%

                                               Net                                                                                W 18-34             31%
                                             Positive                                                                                                         19%
                                                                                                                                  W 35-54           19%
                                                                                                                                   W 55+           12%
                                               32%                                                                                    Region
               19% Positive                                          27% Negative                                                        BC        19%
                                                                                                                                    Alberta        18%
                                                                                                                                    Prairies       17%
                                                                                                       21%                          Ontario        20%
                                                                                                                                   Quebec          19%
                                 15%                             15%                                                       Atlantic Canada          22%
                                                                                    12%                                             Party ID
                                                                                                                              Conservative        10%
                                                                                                                                   Liberal          20%
                                                                                                                                      NDP             31%
           4%                                                                                                                         Bloc         16%
                                                                                                                              Green/Other               46%
                                                                                                                                Unaligned         10%
    All positive views Mostly positive A mix of positive Mostly negative All negative views Don’t know
                           views         and negative        views                          enough to say
                                            views
57
People’s Party of Canada views: 2-in-5 (37%) view the People’s Party of
Canada negatively; men are more likely to view the party positively
      Thinking about each of the following parties, please indicate if you have all positive, mostly positive,   Segmentation
Q     some positive and some negative, mostly negative, or all negative views of that party. If you don’t        Among those who say “Positive”
      know enough about the party to say, please indicate that.                                                                   Age-Gender
      People’s Party of Canada                                                                                                    M 18-34        21%
      [asked of all respondents; n=1,500]                                                                                         M 35-54       12%      12%
                                             -28%                                                                                  M 55+       5%
                                               Net                                                                                W 18-34       12%
             10% Positive                    Positive
                                                                    37% Negative                                                  W 35-54       9%       8%

                                                                                                       35%                         W 55+       4%
                                                                                                                                      Region
                                                                                                                                         BC       7%
                                                                                    26%                                             Alberta        14%
                                                                                                                                    Prairies      10%
                                                                                                                                    Ontario        12%
                                               18%                                                                                 Quebec         7%
                                                                                                                           Atlantic Canada        10%
                                                                 12%                                                                Party ID
                                  7%                                                                                          Conservative      13%
                                                                                                                                   Liberal      10%
           3%                                                                                                                         NDP      5%
                                                                                                                                      Bloc     6%
                                                                                                                              Green/Other         27%
    All positive views Mostly positive A mix of positive Mostly negative All negative views Don’t know                          Unaligned      3%
                           views         and negative        views                          enough to say
                                            views
Brand Personality
Brand personality is way to humanise brands, even in politics. This month INNOVATIVE
combined items from the classic Aaker brand personality scale, Saucier scale based on the
Big 5 personality literature, and some work applying those scales in India which identified
a potential secular/religious dimension in political branding.
Looking at brands this way, Canadians see:
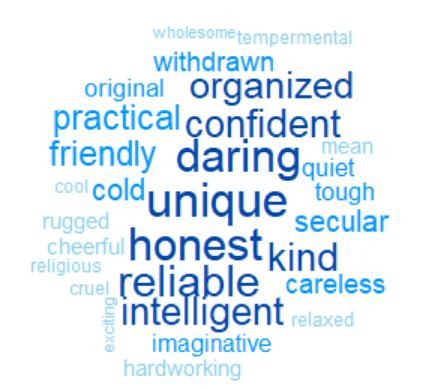
• The Liberals as confident, careless, and practical,
• The Bloc as unique, daring, and honest,
• The CPC seen cold, practical, and mean,
• The NDP as hardworking, intelligent, and honest,
• And the Greens as unique, careless and imaginative.

                                                                          STRICTLY PRIVILEGED AND CONFIDENTIAL
59

Brand Personality & Promise
      Each respondent was asked about the brand personality and brand promise of a total of three parties
      out of a possible five:
      • The Liberal Party
      • The Conservative Party
      • The New Democratic Party
      • The Green Party
      • The Bloc Quebecois [Quebec only]

      For each respondent, if they said they would vote for one of those parties it was included among the
      three parties they saw and the other two were random. If a respondent said they would vote for
      another party or were undecided they were given three random parties.

      Respondents were then asked a series of questions on both brand personality and brand promise
      relating to those parties. Sample sizes for each party are shown on the following slides.
Attributes: The Liberals are most commonly called “confident”, while                                                                         60

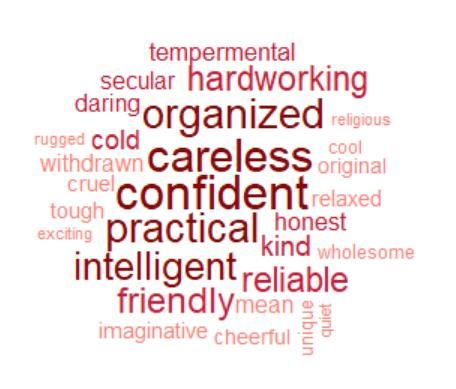
the Conservatives are most commonly described as “cold”
    Now, thinking about the [PARTY], which of the following words best describe that party? Select up to 5.
Q   [each respondent asked of the party they would vote for and two random parties]
                                                                                                                            New Democratic
                         Liberal Party                                                Conservative Party
                                                                                                                                Party

                                                         Green Party                                       Bloc Quebecois
Liberal Party Attributes: The most common word to describe the                                                                                  61

Liberals by other voters is “careless” at 44%
    Now, thinking about the Liberal Party, which of the following words best describe that party? Select up to 5.
Q   [showing those asked about the Liberal Party, n=1,125]

                                        40%
                                                                        Practical               Confident
                                        35%                          Intelligent
                                                        Reliable               Organized
                                        30%
                                                       Hardworking
                                                                         Friendly
               % among Liberal Voters

                                        25%
                                                       Kind
                                        20%
                                                    Honest
                                        15%
                                                   Imaginative
                                        10%
                                                                         Secular                                               Careless
                                        5%                           Withdrawn        Temperamental
                                                                                     Mean   Cold
                                        0%                                 Cruel
                                              0%      5%           10%             15%       20%       25%       30%   35%   40%          45%
                                                                                         % among non-Liberal Voters
Conservative Party Attributes: Conservative voters describe their party                                                                 62

as “practical” while other voters say they are “cold”
    Now, thinking about the Conservative Party, which of the following words best describe that party? Select up to 5.
Q   [showing those asked about the Conservative Party, n=1,089]

                                            60%

                                            50%                                  Practical
              % among Conservative Voters

                                                            Hardworking
                                            40%
                                                       Reliable
                                                                  Intelligent    Organized
                                            30%

                                                       Honest                   Confident
                                            20%

                                            10%
                                                                                Withdrawn Temperamental Religious
                                                                                                          Careless             Cold
                                                                                                    Cruel       Mean
                                            0%
                                                  0%   5%            10%       15%         20%          25%        30%   35%      40%
                                                                        % among non-Conservative Voters
New Democratic Party Attributes: New Democrats describe their party                                                                         63

as “hard working”, “intelligent”, and “honest”
    Now, thinking about the New Democratic Party, which of the following words best describe that party? Select up to 5.
Q   [showing those asked about the New Democratic Party, n=1,049]

                                    45%
                                                                                    Intelligent                 Hardworking
                                    40%                                                       Honesty
                                    35%

                                    30%                                                   Organized
                                                                                                                Friendly
               % among NDP Voters

                                                                                         Practical
                                    25%                               Reliable     Confident
                                                                                  Kind
                                    20%
                                                                                       Imaginative
                                    15%
                                                                                   Original
                                    10%                                           Unique
                                    5%
                                                                           Withdrawn
                                                                                  Temperamental                            Careless
                                    0%
                                          0%              5%           10%                15%                          20%            25%
                                                                    % among non-NDP Voters
Bloc Attributes: Bloc voters describe their party as “honest” and                                                                          64

“reliable”; others call it “unique” and “cold”
    Now, thinking about the Bloc Québécois, which of the following words best describe that party? Select up to 5.
Q   S’agissant du Bloc Québécois lesquels des terme suivants vous viennent à l’esprit pour décrire ce parti?
    [showing those asked about the Bloc Quebecois, n=229]

                                     45%
                                                                          Honesty
                                     40%

                                     35%                               Reliable
                                                                  Intelligent
                                     30%                                                               Daring
               % among Bloc Voters

                                                                                Confident                                   Unique
                                     25%                                      Organized
                                                                          Practical             Kind
                                     20%

                                     15%
                                                                                                       Friendly
                                                                                   Secular
                                     10%

                                     5%                                                    Withdrawn
                                                                                 Quiet          Careless
                                                                                         Rugged                      Cold
                                     0%
                                           0%               5%          10%                      15%                    20%          25%
                                                                 % among non-Bloc Voters
Green Attributes: Green voters describe their party as “intelligent” and                                                                  65

“friendly” while others describe it as “unique” and “careless”
    Now, thinking about the Green Party, which of the following words best describe that party? Select up to 5.
Q   [showing those asked about the Green Party, n=1,007]

                                      35%

                                      30%                                         Intelligent
                                                                                                  Friendly
                                                                              Practical
                                      25%                                Kind     Hardworking                                    Unique
                                                                                 Wholesome
               % among Green Voters

                                      20%                                      Honesty
                                                           Reliable                                          Imaginative
                                      15%                             Organized
                                                                      Confident
                                                                                                              Original
                                      10%                                            Daring
                                                                         Cold
                                      5%                                                 Quiet
                                                                          Relaxed        Withdrawn
                                                                                                 Temperamental Careless
                                      0%
                                            0%             5%              10%               15%                           20%     25%
                                                                          % among non-Green Voters
Brand Promise
What difference will each party make to you? To the country?
Most voters feel most parties won’t make much difference in their lives. Canadians are fairly equally divided on the
personal impact of the Bloc, the NDP and the Liberals if they form government or hold the balance of power.

While other measures show many voters don’t like the CPC, only 23% believe they will be personally worse off if the CPC
win. While that is nine points higher than the Liberals, the CPC have more people who say their lives will be better off (22%
better for the CPC vs 19% better for the Liberals.

Perhaps most surprising is that the party with the worst net impact score are the Green’s with 29% worse off vs 12% better.

The story is similar for the party impacts on the country with the exception that the Bloc drops from slightly higher than the
NDP and Liberals to slightly lower. That is not particularly surprising given the Bloc goal of dividing the country.

                                                                                                   STRICTLY PRIVILEGED AND CONFIDENTIAL
Personal Impact: Respondents say that they personally would be more                                                                                                             67

likely better off with the NDP (24%)
       If [PARTY] were to form the next government or hold the balance of power in a minority government, do you think you personally would be better
       off or worse off?
       [each respondent asked of the party they would vote for and two random parties]
                                                                                                                                                                          Net
                                                                                                                                                                       Better Off

                                                                                                           y
          The Bloc Quebecois               11%           9%                                    42%                           7%         10%               21%            +3%

    The New Democratic Party             10%               14%                                 35%                         10%          12%                19%           +1%

x

             The Liberal Party          7%           12%                                       46%                                10%             13%            12%     -5%

       The Conservative Party            10%             12%                             31%                         14%                    18%                16%       -10%

              The Green Party         4%       8%                             35%                              13%               16%                    24%              -16%

            Much better off             Somewhat better off              No impact             Somewhat worse off          Much worse off         Don’t know
Liberal Personal Impact: Respondents are more likely to feel worse                                                                                   68

off more than better off with the Liberal party
     If The Liberal Party were to form the next government or hold the balance of power in a                  Segmentation
Q    minority government, do you think you personally would be better off or worse off?                       Those who say ‘Better off’
     [showing those asked about the Liberal Party; n=1,125]                                                                  Age-Gender
                                                                                                                M 18-34            17%
                                                                                                                M 35-54             19%        20%
                                                                                                                 M 55+               23%
                                                                                                                W 18-34            16%
                                                  -5%                                                           W 35-54           13%          17%
                                                   Net                                                           W 55+               22%
                                                Better Off                                                                     Region
                                                                                                                       BC         16%
       18% Better off                                            23% Worse off                                    Alberta          19%
                                                   46%                                                            Prairies         20%
                                                                                                                  Ontario           23%
                                                                                                                 Quebec          8%
                                                                                                         Atlantic Canada            22%
                                                                                                                              Party ID
                              12%                               10%            13%            12%          Conservative         5%
          7%                                                                                                    Liberal                  35%
                                                                                                                   NDP            15%
                                                                                                                   Bloc        0%
    Much better off       Somewhat              No impact     Somewhat     Much worse off   Don’t know
                                                                                                           Green/Other          8%
                          better off                           worse off                                     Unaligned          9%
Liberal Personal Impact: The most common reason respondents say                                                                                                  69

they would be worse off is spending and the national debt
    And how do you think you would be better/worse off?
Q   [asked of all respondents; better n=208; worse n=264]

                                         Better                                                                           Worse
                                                                                             Irresponsible spending/increased
             Community benefits/more care for groups                                  23%                                                                  24%
                                                                                                       national debt
                   Better off/like leader/party- General                        18%             Increased taxes/higher cost of
                                                                                                                                                         21%
                                                                                                            living
           Based on past experience/handling of COVID                     12%               Based on past experience/handling
                                                                                                                                                   14%
                                                                                                        of COVID
                      In agreeance with party’s policies             10%
                                                                                                  Dislike Leader/Party-General                   11%
               Increased financial support for economy               9%
                                                                                                      Lack of care for the
               Opposed to other party’s being in power           8%                                                                         8%
                                                                                                   public/environment/selfish
                                  Environment benefits
                                                                                                  Better off/like leader/party-
                                                                6%                                                                      6%
                                                                                                            General
                          Dislike Leader/Party-General     2%                               Community benefits/more care for
                                                                                                                                       6%
                                                                                              certain communities/persons
                 Irresponsible spending/ national debt     1%
                                                                                             Opposed to other party’s being in
                                                                                                                                  1%
                   Increased taxes/higher cost of living   0%                                            power

                                                  Other          8%
                                                                                                                        Other          5%

                                                  None      3%                                                           None     2%

                                   Don't know/Refused      0%
                                                                                                         Don't know/Refused       2%
Conservative Personal Impact: 3-in-10 (32%) say they are worse off if                                                                                         70

the Conservatives form the next gov’t; better off in Alberta
     If The Conservative Party were to form the next government or hold the balance of power in a                  Segmentation
Q    minority government, do you think you personally would be better off or worse off?                            Those who say ‘Better Off’
     [showing those asked about the Conservative Party; n=1,089]                                                                  Age-Gender
                                                                                                                     M 18-34           17%
                                                                                                                     M 35-54             24%            26%
                                                                                                                      M 55+                34%
                                                                                                                     W 18-34          10%
                                                -10%                                                                 W 35-54            21%             18%
                                                  Net                                                                 W 55+             20%
                                               Better Off                                                                           Region
                                                                                                                            BC           22%
          22% Better off                                             32% Worse off                                     Alberta              37%
                                                                                                                       Prairies           29%
                                                                                                                       Ontario          20%
                                                  31%                                                                 Quebec           13%
                                                                                                              Atlantic Canada            23%
                                                                                    18%            16%                             Party ID
                             12%                                     14%
         10%                                                                                                    Conservative                      60%
                                                                                                                     Liberal         7%
                                                                                                                        NDP          8%
                                                                                                                        Bloc         9%
    Much better off       Somewhat             No impact           Somewhat     Much worse off   Don’t know
                                                                                                                Green/Other            18%
                          better off                                worse off                                     Unaligned          7%
Conservative Personal Impact: The most common reason Canadians                                                                                               71

say they would be worse off with a CPC govt is cuts to social services
     And how do you think you would be better/worse off?
 Q   [asked of all respondents; better n=237; worse n=349]

                                          Better                                                                 Worse
                Fiscal management/controlled spending                        23%                        Cuts to social services                        24%

                                          Economy/jobs                 10%         Only care about themselves/not the people                     19%
              Honesty/integrity/less corruption/scandals           8%                     Regressive/rigid policies and values                   17%
                          Debt/deficit/balanced budget             8%                 Worse/bad/negative comments-general                   9%
                                   Not Trudeau/Liberals            8%
                                                                                    Worse financially-affect poor/middle class         6%
                Better/good/positive comments-general              7%
                                                                                                              Climate change       4%
                                   Minority government            7%
                                                                                                                  Party leader     3%
                                                Policies          7%
                                                                                                               Economy/jobs        3%
                                            Lower taxes           6%
                                                                                                                 Higher taxes     2%
                 Interested in entire country/care about…    3%
                                                                                                    Covid/pandemic response       1%
                                                Change       2%
                                                                                     Better/good/positive comments-general        1%
                              Covid/pandemic response       1%
                                                                                      Fiscal management/controlled spending       1%
                           Only care about the economy      1%

                                                  Other           6%                                                    Other          5%

                                                  None      1%                                                           None     1%

                                   Don't know/Refused       1%                                           Don’t know/Refused       3%
New Democratic Personal Impact: 1-in-4 (24%) of respondents say                                                                                       72

they are better off with NDP; highest in younger women
     If The New Democratic Party were to form the next government or hold the balance of power in          Segmentation
Q    a minority government, do you think you personally would be better off or worse off?                  Those who say ‘Better Off’
     [showing those asked about the NDP; n=1,049]                                                                         Age-Gender
                                                                                                             M 18-34             20%
                                                                                                             M 35-54             20%            21%
                                                                                                              M 55+               23%
                                                                                                             W 18-34                34%
                                                +1%                                                          W 35-54              23%           26%
                                                 Net                                                          W 55+               23%
                                              Better Off                                                                    Region
                                                                                                                    BC             32%
          24% Better off                                     22% Worse off                                     Alberta           27%
                                                                                                               Prairies           29%
                                                                                                               Ontario           25%
                                                    35%                                                       Quebec           13%
                                                                                                      Atlantic Canada           19%
                                                                                           19%                             Party ID
                             14%                             10%            12%
        10%                                                                                             Conservative          9%
                                                                                                             Liberal            19%
                                                                                                                NDP                       64%
                                                                                                                Bloc        0%
    Much better off      Somewhat             No impact    Somewhat     Much worse off   Don’t know
                                                                                                        Green/Other              23%
                         better off                         worse off                                     Unaligned            13%
NDP Personal Impact: Increased taxes and a lack of fiscal responsibility                                                                                              73

are the top reasons people say they’d be worse off under the NDP
     And how do you think you would be better/worse off?
 Q   [asked of all respondents; better n=248; worse n=236]

                                          Better                                                                        Worse
                 Working for the people /cares/equality                          23%                                  Increased taxes                           25%

          Better government-policies/balanced/good for
                                                                            21%
                           economy                                                         Not fiscally responsible/reckless spending                     20%

                        Improved support
                                                                           19%          Poor government- policies/lack balance/bad
              programs/benefits/funding/social services                                                                                             12%
                                                                                                     for economy
          Improved health care/dental/education/public
                                                                     11%
                            services                                                    Do not like their political view/too much like
                                                                                                                                                   10%
                                                                                                           liberals
                Get rid of Liberal government/time for a
                                                                6%
                            change/new ideas
                                                                                        NDP does not have the experience/ability to
                                                                                                                                               8%
                                                                                                      run a country
                        Better leader-leadership/values      5%
                                                                                       Only cares for the poor/inequality/take from
                                                                                                                                              6%
                                                                                                          the rich
                    Reduce taxes/fairer taxation system    3%

                                                                                       Don't like the leader/lack leadership/integrity        6%
                                                  Other           8%

                                                                                                                                Other               11%
                                                  None     2%

                                   Don't know/Refused      3%                                                   Don't know/Refused       2%
Green Personal Impact: Almost 3-in-10 (29%) say they are worse off                                                                                  74

if the Green party were to form the next government
     If The Green Party were to form the next government or hold the balance of power in a minority         Segmentation
Q    government, do you think you personally would be better off or worse off?                              Those who say ‘Better Off’
     [showing those asked about the Green Party; n=1,007]                                                                  Age-Gender
                                                                                                              M 18-34           14%
                                                                                                              M 35-54           14%           13%
                                                                                                               M 55+           10%
                                                                                                              W 18-34           15%
                                                -16%                                                          W 35-54          11%            12%
                                                  Net                                                          W 55+           10%
                                               Better Off                                                                    Region
                                                                                                                     BC          17%
         12% Better off                                        29% Worse off                                    Alberta        10%
                                                                                                                Prairies      6%
                                                                                                                Ontario         14%
                                                 35%                                                           Quebec          10%
                                                                                            24%        Atlantic Canada         12%
                                                              13%            16%                                            Party ID
                              8%                                                                         Conservative         5%
          4%                                                                                                  Liberal         6%
                                                                                                                 NDP                   28%
                                                                                                                 Bloc          9%
    Much better off       Somewhat            No impact     Somewhat     Much worse off   Don’t know
                                                                                                         Green/Other                    34%
                          better off                         worse off                                     Unaligned           8%
Green Personal Impact: More than half who say they’d be better off                                                                                          75

under the Greens say it is because of environmental benefits
    And how do you think you would be better/worse off?
Q   [asked of all respondents; better n=122; worse n=288]

                                          Better                                                               Worse
              Environment benefits e.g. more action on                         Party lacks experience/disorganized/policies
                                                                       61%                                                                            30%
                          climate change                                                          unclear

                                                                                    Worse off for the economy e.g. job loss                     18%
                  Better off/like party/leader - General         16%

                    Care/advocate for all sectors of the                     Attention only given to one issue/environment                11%
                                                             6%
                              community
                                                                                    Disagree with party/ policies unrealistic             11%
           Party lacks experience/disorganized/policies
                                                            6%
                              unclear
                                                                                    Worse off/dislike party/leader -General            10%
                   Increased taxes/higher cost of living    2%
                                                                                       Increased taxes/higher cost of living          7%

                Disagree with party/ policies unrealistic   2%
                                                                                                           Party is unknown     3%

                                                  Other     4%
                                                                                                                      Other          6%

                                                   None     1%
                                                                                                                       None     1%

                                   Don't know/Refused       3%                                         Don't know/Refused        3%
Bloc Québécois Personal Impact: 1-in-5 say they are better off with                                                                             76

Bloc Québécois; highest among older respondents
     If The Bloc Québécois Party were to form the next government or hold the balance of power in a       Segmentation
Q    minority government, do you think you personally would be better off or worse off?                   Those who say ‘Better Off’
     [showing those asked about the Bloc Quebecois; n=229]                                                             Age-Gender
                                                                                                            M 18-34          16%
                                                                                                            M 35-54          15%          21%

                                                +3%                                                           M 55+               28%
                                                 Net                                                        W 18-34         9%
                                              Better Off                                                                                  19%
                                                                                                            W 35-54           17%

          20% Better off                                        17% Worse off                                 W 55+               24%
                                                 42%                                                                   Party ID
                                                                                                        Conservative       9%
                                                                                             21%             Liberal      5%
         11%                  9%                                7%            10%                              NDP          13%
                                                                                                                Bloc                41%

    Much better off       Somewhat            No impact      Somewhat     Much worse off   Don’t know   Green/Other         12%
                          better off                          worse off                                   Unaligned       5%
Canada Wide Impact: For Canada as a whole, respondents are split on                                                                                                           77

how they feel with the 3 main parties forming the next government
       If [PARTY] were to form the next government or hold the balance of power in a minority government, do you think Canada as a whole would be
       better off or worse off?
       [each respondent asked of the party they would vote for and two random parties]

                                                                                                                                                                  Net Favourable

                                                                                                       y
    The New Democratic Party             10%               15%                             32%                        10%         12%                  21%            +3%

             The Liberal Party           8%             14%                                    41%                          9%          13%                 15%        0%

x

          The Bloc Quebecois                11%          7%                              40%                          10%         11%                 22%             -2%

       The Conservative Party               11%               13%                        27%                    12%               18%                      18%        -6%

              The Green Party          5%         8%                         31%                     12%                17%                        27%                -16%

            Much better off             Somewhat better off              No impact         Somewhat worse off          Much worse off         Don’t know
Liberal National Impact: For Canada as a whole, respondents are                                                                                       78

split on how they feel with the Liberals forming the next government
     If The Liberal Party were to form the next government or hold the balance of power in a                  Segmentation
Q    minority government, do you think Canada as a whole would be better off or worse off?                    Those who say ‘Better Off’
     [showing those asked about the Liberal Party; n=1,125]                                                                  Age-Gender
                                                                                                                M 18-34           12%
                                                                                                                M 35-54             21%         22%
                                                                                                                 M 55+                30%
                                                                                                                W 18-34           14%
                                                   0%                                                           W 35-54            16%          22%
                                                   Net                                                           W 55+                31%
                                                Better Off                                                                     Region
                                                                                                                       BC           20%
          22% Better off                                                                                          Alberta          20%
                                                                 22% Worse off                                    Prairies          21%
                                                   41%                                                            Ontario            26%
                                                                                                                 Quebec           12%
                                                                                                         Atlantic Canada             26%
                                                                                              15%                             Party ID
                              14%                                              13%                                              6%
          8%                                                     9%                                        Conservative
                                                                                                                Liberal                   41%
                                                                                                                   NDP           15%
                                                                                                                   Bloc        4%
    Much better off       Somewhat              No impact     Somewhat     Much worse off   Don’t know
                                                                                                           Green/Other          9%
                          better off                           worse off                                     Unaligned          10%
Liberal National Impact: The top concern about a Liberal government                                                                                        79

is reckless spending and higher taxes
    And how do you think Canada would be better/worse off?
Q   [asked of all respondents; better n=242; worse n=245]

                                          Better                                                                Worse
                  Based on current/past
                                                                             25%
            experiences/handling of COVID-19                                                Reckless spending/higher taxes                           34%
           Better off/like party/leader-general                        16%
                                                                                    Worse off/dislike party/leader -General                    23%
               Attention given to marginalized
                                                                   14%
                           groups
                                                                                                    Dishonest party/leader               14%
               Quick to deal with social issues                   13%
                                                                                               Based on current/past
             In agreement with party's policies                                                                                     8%
                                                            7%                           experiences/handling of COVID-19

            Good for the economy/job market                 6%                        Divide amongst Canadians/exclusion            7%

             Opposed to other parties being in
                                                       4%                               Better off/like party/leader-general   2%
                         power
               Worse off/dislike party/leader -
                                                   3%
                          General                                                  Opposed to other parties being in power     2%
                                         Other                   11%
                                                                                                                      Other          10%
                                         None     1%
                                                                                                                      None     1%
                          Don't know/Refused      1%
Conservative National Impact: 1-in-4 say Canada would be better off                                                                                            80

with the Conservatives forming the next gov’t; higher among men
     If The Conservative Party were to form the next government or hold the balance of power in a                  Segmentation
Q    minority government, do you think Canada as a whole would be better off or worse off?                         Those who say ‘Better Off’
     [showing those asked about the Conservative Party; n=1,089]                                                                  Age-Gender
                                                                                                                     M 18-34            19%
                                                                                                                     M 35-54             25%             29%
                                                                                                                      M 55+                 39%
                                                                                                                     W 18-34           12%
                                                 -6%                                                                 W 35-54             23%             20%
                                                  Net                                                                 W 55+              23%
                                               Better Off                                                                           Region
          24% Better off                                                                                                    BC           23%
                                                                     30% Worse off                                     Alberta               44%
                                                                                                                       Prairies           28%
                                                                                                                       Ontario           22%
                                                                                                                      Quebec            18%
                                                  27%                                                         Atlantic Canada            22%
                                                                                    18%            18%                             Party ID
         11%                 13%                                     12%                                        Conservative                       68%
                                                                                                                     Liberal         7%
                                                                                                                        NDP          6%
                                                                                                                        Bloc          11%
    Much better off       Somewhat             No impact           Somewhat     Much worse off   Don’t know
                                                                                                                Green/Other              26%
                          better off                                worse off                                     Unaligned          8%
Conservative National Impact: The top reason people say Canada                                                                                                 81

would be better off with the CPC is their fiscal management
    And how do you think Canada would be better/worse off?
Q   [asked of all respondents; n= better n=265; worse n=329]

                                         Better                                                                  Worse
              Fiscal management-lower spending/taxes                       30%        Only care about themselves/big business                            26%
            Better/practical governance/leadership/get                                        Austerity/cuts to social services                    20%
                                                                     12%
                      country back on track
                                                                                                Bad/regressive policies/values               13%
                                        Economy/jobs                9%
                                                                                                       Poor leadership/record           7%
                            Better/new policies/values          8%
                                                                                 Climate change/environment would get worse            6%
                          Control debt/balance budget          7%
                                                                                   They would undo initiatives/progress made       3%
                                     Balance of power          7%                                 Don't like/trust leader/party    3%
              Help all of Canada/provinces/Canada first        6%                                              Worse-general       3%
                         Honesty/trustworthiness/less                                         Hard to work with other parties
                                                               5%                                                                 3%
                             corruption/scandals
                                        Better-general                                      Too far right/too much like Trump     3%
                                                           4%
                                                                                                       Bad for Canada's image     2%
                           Trudeau/Liberals need to go     3%
                                                                                                                  No platform     2%
                                                 Other         7%
                                                                                                                         Other         6%
                                                 None     1%
                                                                                                                         None     2%
                                           Don't Know     0%                                                       Don't Know     1%
                                               Refused    2%                                                          Refused     1%
You can also read