HOSPITAL SURVEY ON PATIENT SAFETY CULTURE - 2018 User Database Report - Surveys on Patient Safety - AHRQ
←
→
Page content transcription
If your browser does not render page correctly, please read the page content below

HOSPITAL SURVEY
ON PATIENT
SAFETY
CULTURE
2018User
Database
Report

  Surveys on
  Patient Safety
  Culture™         PATIENT
                   SAFETY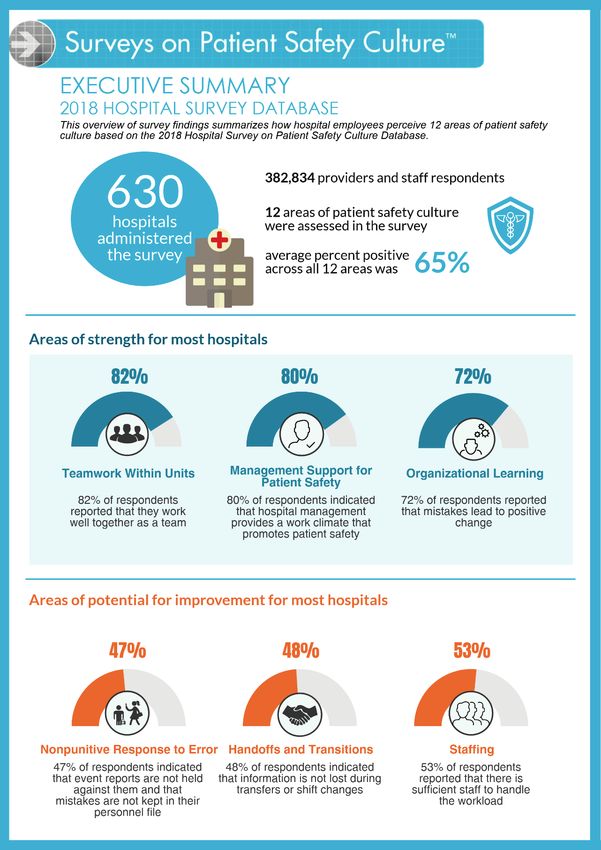
The authors of this report are responsible for its content. Statements in the report should not
be construed as endorsement by the Agency for Healthcare Research and Quality or the U.S.
Department of Health and Human Services.
Hospital Survey on Patient Safety Culture:
2018 User Database Report

Prepared for:

Agency for Healthcare Research and Quality
U.S. Department of Health and Human Services
5600 Fishers Lane
Rockville, MD 20857
www.ahrq.gov

Contract No. HHSA 290201300003C

Managed and prepared by:

Westat, Rockville, MD

Theresa Famolaro, M.P.S., M.S., M.B.A.
Naomi Dyer Yount, Ph.D.
Ryan Hare
Shakia Thornton
Kristi Meadows
Lei Fan M.D., Ph.D.
Rebecca Birch M.P.H
Joann Sorra, Ph.D.

AHRQ Publication No. 18-0025-EF
March 2018

This document is in the public domain and may be used and reprinted without permission except
those copyrighted materials noted for which further reproduction is prohibited without specific
permission of copyright holders.

Suggested Citation:

Famolaro T, Yount N, Hare, R, et al. Hospital Survey on Patient Safety Culture 2018 User
Database Report. (Prepared by Westat, Rockville, MD, under Contract No. HHSA
290201300003C). Rockville, MD: Agency for Healthcare Research and Quality; 2018. AHRQ
Publication No. 18-0025-EF.

Surveys on Patient Safety Culture™ and SOPS™ are registered trademarks of AHRQ.

The authors of this report are responsible for its content. Statements in the report should
not be construed as endorsement by the Agency for Healthcare Research and Quality or
the U.S. Department of Health and Human Services.

No investigators have any affiliations or financial involvement (e.g., employment,
consultancies, honoraria, stock options, expert testimony, grants or patents received or
pending, or royalties) that conflict with material presented in this report.

                                               ii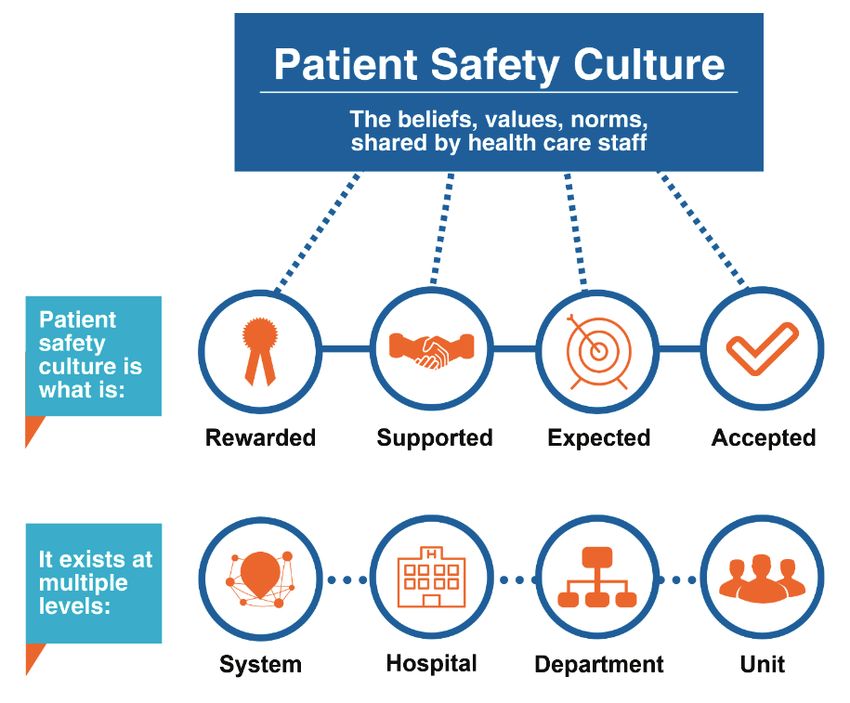
Table of Contents
Executive Summary .........................................................................................................................v
Purpose and Use of This Report ......................................................................................................1
Chapter 1. Introduction ....................................................................................................................1
   Survey Content...........................................................................................................................3
Chapter 2. Survey Administration Statistics ....................................................................................5
   Overall Hospital Statistics..........................................................................................................5
Chapter 3. Hospital Characteristics..................................................................................................7
Chapter 4. Respondent Characteristics ............................................................................................9
Chapter 5. Overall Results .............................................................................................................13
   Composite and Item-Level Charts ...........................................................................................14
Chapter 6. Comparing Your Results ..............................................................................................21
   Composite and Item-Level Tables ...........................................................................................22
Chapter 7. Trending: Comparing Results Over Time ....................................................................29
   Composite and Item-Level Trending Results ..........................................................................32
   Bar Charts of Trending Results................................................................................................38
Chapter 8. What’s Next? Action Planning for Improvement ........................................................41
   AHRQ Action Planning Tool...................................................................................................41
   Resource List for Users of the AHRQ Hospital Survey ..........................................................42
References ......................................................................................................................................42
Notes: Description of Data Cleaning and Calculations, and Data Limitations..............................43
   Data Cleaning...........................................................................................................................43
   Response Rates ........................................................................................................................43
   Calculation of Percent Positive Scores ....................................................................................43
   Item-Level Percent Positive Response.....................................................................................44
   Composite-Level Percent Positive Response...........................................................................44
   Item and Composite Percent Positive Scores...........................................................................44
   Standard Deviation...................................................................................................................47
   Percentiles ................................................................................................................................47
   Description of Trending Statistics ...........................................................................................50
   Data Limitations.......................................................................................................................51
Appendixes A and B: Overall Results by Hospital and Respondent Characteristics ....................52
   Highlights From Appendix A: Overall Results by Hospital Characteristics ...........................52
   Highlights From Appendix B: Overall Results by Respondent Characteristics ......................53
Appendixes C and D: Trending Results by Hospital and Respondent Characteristics..................55
   Highlights From Appendix C: Trending Results by Hospital Characteristics .........................55
   Highlights From Appendix D: Trending Results by Respondent Characteristics ...................56

List of Figures
Figure 1. Definition of Patient Safety Culture .................................................................................3

List of Tables
Table 1-1. Patient Safety Culture Composites and Definitions .......................................................4
Table 2-1. Trending and Nontrending Overall Statistics—2018 Database Hospitals .....................5

                                                                       iii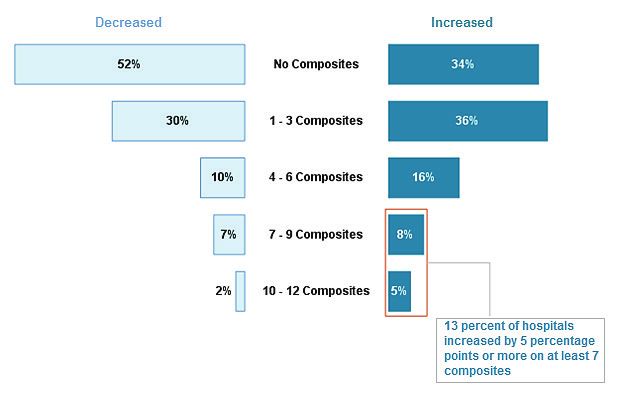
Table 2-2. Average Survey Administration Statistics—2018 Database Hospitals ..........................5
Table 2-3. Survey Administration Mode Statistics—2018 Database Hospitals ..............................6
Table 3-1. Distribution of 2018 Database Hospitals and Respondents Compared With AHA-
   Registered Hospitals ..................................................................................................................8
Table 4-1. Distribution of 2018 Database Hospitals by Respondent Characteristics ......................9
Table 6-1. Composite-Level Results for the 2018 Database .........................................................23
Table 6-2. Item-Level Results for the 2018 Database (Page 1 of 4)..............................................24
Table 6-3. Percentage of Respondents Giving Their Work Area/Unit Patient Safety Grade—2018
   Database Hospitals ...................................................................................................................28
Table 6-4. Percentage of Respondents Reporting One or More Events in the Past 12 Months—
   2018 Database Hospitals ..........................................................................................................28
Table 7-1. Trending: Response Rate Statistics—2018 Database Hospitals ..................................30
Table 7-2. Distribution of 2018 Trending and Nontrending Hospitals ..........................................30
Table 7-3. Trending: Composite-Level Results—2018 Database Hospitals .................................32
Table 7-4. Trending: Item-Level Results—2018 Database Hospitals (Page 1 of 4) .....................33
Table 7-5. Trending: Distribution of Work Area/Unit Patient Safety Grades—2018 Database
   Hospitals ..................................................................................................................................37
Table 7-6. Trending: Distribution of Number of Events Reported in the Past 12 Months—2018
   Database Hospitals ...................................................................................................................37
Table N1. Example of Computing Item and Composite Percent Positive Scores .........................45
Table N2. Example of Computing Patient Safety Grade and Number of Events Reported ..........46
Table N3. Data Table for Example of How To Compute Percentiles ...........................................48
Table N4. Interpretation of Percentile Scores ................................................................................49
Table N5. Sample Percentile Statistics ..........................................................................................49
Table N6. Example of Trending Statistics .....................................................................................50
Table N7. Example of Other Trending Statistics ...........................................................................50

List of Charts
Chart 5-1. Composite-Level Average Percent Positive Response – 2018 Database Hospitals .....15
Chart 5-2. Item-Level Average Percent Positive Response – 2018 Database Hospitals ...............16
Chart 5-3. Average Percentage of 2018 Database Respondents Giving Their Work Area/Unit a
   Patient Safety Grade ................................................................................................................20
Chart 5-4. Average Percentage of 2018 Database Respondents Reporting Events in the Past 12
   Months .....................................................................................................................................20
Chart 7-1. Trending: Percentage of 2018 Hospitals That Either Increased or Decreased, by 5
   Percentage Points, or Did Not Change on Each Composite. ...................................................39
Chart 7-2. Trending: Percentage of 2018 Hospitals That Increased, Decreased, or Did Not
   Change on Work Area/Unit Patient Safety Grade of “Excellent” or “Very Good” (E1) and
   Number of Events Reported as 1 or more events (G1) ............................................................40
Chart 7-3. Trending: Distribution of 2018 Hospitals by Number of Composites That Increased or
   Decreased by 5 Percentage Points or More .............................................................................40

               Appendixes cited in this report are provided electronically at
    https://www.ahrq.gov/sops/quality-patient-safety/patientsafetyculture/hospital/hosp-
                                       reports.html.

                                                                       iv
Executive Summary
Surveys on Patient Safety Culture
EXECUTIVE SUMMARY
2018 HOSPITAL SURVEY DATABASE
This overview of surveys findings summarizes how hospital employees perceive 12 areas of
patient safety culture based on the 2018 Hospital Survey on Patient Safety Culture
Database.
382,834 providers and staff respondents.
630
hospitals
12 areas of patient safety culture were assessed in the
administered survey.
the survey
Average percent positive across all 12 areas was 65%
Areas of Strength for most hospitals
82% 80% 72%
Teamwork Within Management Support Organizational
Units for Patient Safety Learning
82% of respondents 80% of respondents 72% of respondents
reported that they indicated that hospital reported that mistakes
work well together management provides a lead to positive
as a team. work climate that change.
promotes patient safety.
Areas of potential for improvement for most hospitals
47% 48% 53%
Nonpunitive Response Handoffs and Staffing
to Error Transitions
53% of respondents
47% of respondents 48% of respondents reported that there is
indicated that event indicated that sufficient staff to
reports are not held information is not lost handle the workload.
against them and that during transfers or shift
mistakes are not kept in changes.
their personnel file.
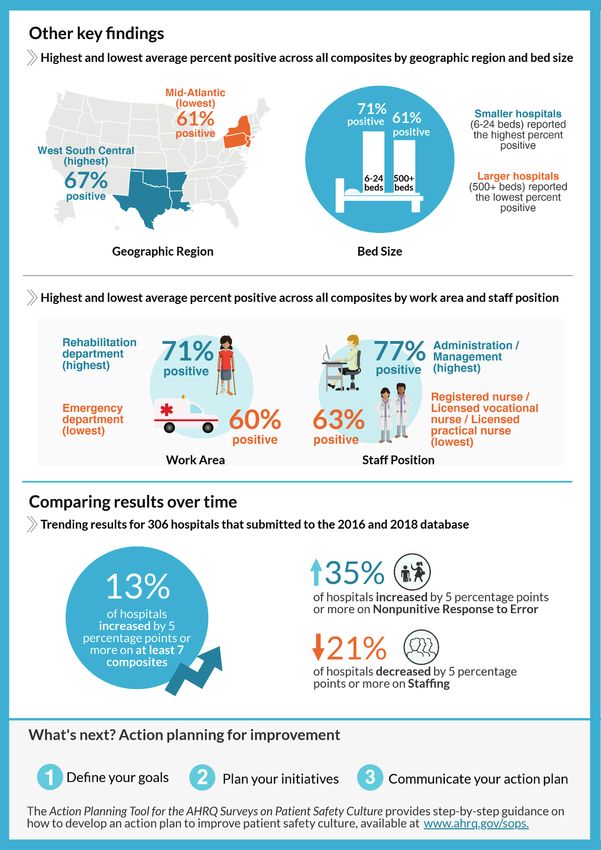
vOther Key Findings
Highest and lowest average percent positive across all composite by geographic region and bed size.
Smaller hospitals
Geographic Region Bed Size
(6-24 beds)
reported the highest
Mid-Atlantic (lowest) 6-24 beds: 71% percent positive.
61% positive. Positive.
Larger hospitals
West South Central 500+ beds 61% (500+ beds)
(highest) 67% positive. postive reported the lowest
percent positive.
Highest and lowest average percent positive across all composites by work area and staff position
Staff Position
Work Area
Administration / Management (highest).
Rehabilitation department 77% positive.
(highest). 71% Positive.
Registered nurse/ Licensed vocational
Emergency department (lowest). nurse/ Licensed practical nurse
60% positive. (lowest). 63% positive.
Comparing results over time
Trending results for 306 hospitals that submitted to the 2016 and 2018 database.
13% of hospitals Up. 35% of hospitals increased by 5
increased by 5 percentage points or more on
percentage points Nonpunitive Response to Error.
or more on at least
7 composites Down. 21% of hospitals decreased by
5 percentage points or more on
Staffing.
What’s next? Action planning for improvement.
1. Define your goals
2. Plan your initiatives
3. Communicate your action plan
The Action Planning Tool for the AHRQ Surveys on Patient Safety Culture provides step-by-step
guidance on how to develop an action plan to improve patient safety culture, available at www.ahrq.gov/
sops.
viPurpose and Use of This Report
In response to requests from hospitals interested in comparing their results with those of other
hospitals on the Surveys on Patient Safety CultureTM (SOPSTM) Hospital Survey, the Agency for
Healthcare Research and Quality (AHRQ) established the Hospital Survey on Patient Safety
Culture database. The submission period for the hospital database occurs every 2 years.
The report presents statistics (averages, standard deviations, minimum and maximum scores, and
percentiles) on the patient safety culture composites and items from the survey. This report also
includes a trending chapter that describes patient safety culture change over time.
This report has four appendixes:
• Appendix A presents results by hospital characteristics (bed size, teaching status,
ownership, and geographic region).
• Appendix B presents results by respondent characteristics (hospital work area/unit, staff
position, interaction with patients, and tenure in work area/unit).
• Appendix C presents trend results by hospital characteristics (bed size, teaching status,
ownership, and geographic region).
• Appendix D presents trend results by respondent characteristics (hospital work area/unit,
staff position, interaction with patients, and tenure in work area/unit).
1This page is intentionally blank.
Chapter 1. Introduction
Organizational culture refers to the beliefs, values, and norms shared by staff throughout the
organization that influence their actions and behaviors. Patient safety culture is the extent to
which these beliefs, values, and norms support and promote patient safety. Patient safety culture
can be measured by determining what is rewarded, supported, expected, and accepted in an
organization as it relates to patient safety.
Figure 1. Definition of Patient Safety Culture

Survey Content
The Agency for Healthcare Research and Quality (AHRQ) funded the development of the
Hospital Survey on Patient Safety Culture. The survey includes 42 items that measure 12
composites of patient safety culture. The 12 patient safety culture composites are listed and
defined in Table 1-1.

                                                 3
Table 1-1. Patient Safety Culture Composites and Definitions
Patient Safety Culture Composite Definition: The extent to which…
1. Communication openness Staff freely speak up if they see something that may
negatively affect a patient and feel free to question those with
more authority.
2. Feedback and communication about Staff are informed about errors that happen, are given
error feedback about changes implemented, and discuss ways to
prevent errors.
3. Frequency of events reported Mistakes of the following types are reported: (1) mistakes
caught and corrected before affecting the patient, (2)
mistakes with no potential to harm the patient, and (3)
mistakes that could harm the patient but do not.
4. Handoffs and transitions Important patient care information is transferred across
hospital units and during shift changes.
5. Management support for patient Hospital management provides a work climate that promotes
safety patient safety and shows that patient safety is a top priority.
6. Nonpunitive response to error Staff feel that their mistakes and event reports are not held
against them and that mistakes are not kept in their
personnel file.
7. Organizational learning—Continuous Mistakes have led to positive changes and changes are
improvement evaluated for effectiveness.
8. Overall perceptions of patient safety Procedures and systems are good at preventing errors and
there is a lack of patient safety problems.
9. Staffing There are enough staff to handle the workload and work
hours are appropriate to provide the best care for patients.
10. Supervisor/manager expectations Supervisors/managers consider staff suggestions for
and actions promoting patient safety improving patient safety, praise staff for following patient
safety procedures, and do not overlook patient safety
problems.
11. Teamwork across units Hospital units cooperate and coordinate with one another to
provide the best care for patients.
12. Teamwork within units Staff support each other, treat each other with respect, and
work together as a team.
The survey also includes two questions that ask respondents to provide an overall grade on
patient safety for their work area/unit and to indicate the number of events they reported over the
past 12 months. In addition, respondents are asked to provide limited background demographic
information.
4Chapter 2. Survey Administration Statistics
This chapter presents descriptive information on how the 2018 database hospitals administered
the survey.
Highlights
• The 2018 database consists of data from 382,834 hospital respondents across 630
hospitals.
• The average hospital response rate was 54 percent, with an average of 608 completed
surveys per hospital.
• Most hospitals (83 percent) administered web surveys, which resulted in lower
response rates compared with response rates from both paper and web (61 percent) and
paper only survey administration (57 percent).
Overall Hospital Statistics
Overall statistics included in the 2018 database are shown in Tables 2-1, 2-2, and 2-3.
Table 2-1. Trending and Nontrending Overall Statistics—2018 Database Hospitals i
Nontrending Hospitals Trending Hospitals
2018
Hospitals
2018 1st Time Submitting Trending Total
Overall Statistic Submitters 2007-2014 2016-2018 Database
Number of hospitals 190 134 306 630
Number of survey respondents 81,647 72,757 228,430 382,834
Table 2-2. Average Survey Administration Statistics—2018 Database Hospitals
Response Rate Information Rate
Average number of respondents per hospital (range: 16 to 6,139) 608
Average number of surveys administered per hospital (range: 18 to 9,973) 1,337
Overall average hospital response rate (range: 6% to 100%) 54%
i The number of trending hospitals and respondents shown as trending in Table 2-1 represent hospitals that participated
consecutively in the 2016 and 2018 databases.
5Table 2-3. Survey Administration Mode Statistics—2018 Database Hospitals
Average Mode
Database Hospitals Database Respondents Response Rate
Survey Administration
Mode Number Percent Number Percent Percent
Paper only 24 4% 4,514 1% 57%
Web only 525 83% 338,603 88% 53%
Both paper and web 81 13% 39,717 10% 61%
Total 630 100% 382,834 100% N/A
Note: Percentages may not add to 100 due to rounding.
6Chapter 3. Hospital Characteristics
This chapter presents information about the distribution of database hospitals by bed size,
teaching status, ownership, and geographic region. Although the hospitals that voluntarily
submitted data to the database do not constitute a statistically selected sample, the
characteristics of these hospitals are fairly consistent with the distribution of hospitals
registered with the American Hospital Association (AHA).
The characteristics of database hospitals by bed size, teaching status, ownership, geographic
region, and health care system status are presented in the following tables and are compared
with the distribution of AHA-registered hospitals included in the 2015 AHA Annual Survey
of Hospitals. ii
Highlights
• Most database hospitals ranged from 25-299 beds (72 percent).
• Most database hospitals were nonteaching (64 percent)
• Most database hospitals were nongovernment not for profit (78 percent).
• Database hospitals represented all geographic regions in the United States. The South
Atlantic/Associated Territories region had the most hospitals (24 percent).
• Characteristics of database hospitals are fairly consistent with the distribution of
hospitals registered with the American Hospital Association.
ii Data for U.S. and U.S. territory AHA-registered hospitals were obtained from the 2015 AHA Annual Survey of Hospitals
Database, © 2015 Health Forum, LLC, an affiliate of the American Hospital Association. Hospitals not registered with AHA
were asked to provide information on their hospital’s characteristics, such as bed size, teaching status, and ownership.
7Table 3-1. Distribution of 2018 Database Hospitals and Respondents Compared With AHA-
Registered Hospitals
AHA-Registered Database
Hospitals Database Hospitals Respondents
Hospital Characteristics (N = 6,251) (N = 630) (N = 382,834)
Bed Size Number Percent Number Percent Number Percent
6-24 beds 770 12% 34 5% 2,558 1%
25-49 beds 1,445 23% 96 15% 13,360 3%
50-99 beds 1,237 20% 102 16% 23,967 6%
100-199 beds 1,263 20% 156 25% 79,082 21%
200-299 beds 646 10% 102 16% 75,910 20%
300-399 beds 368 6% 57 9% 50,639 13%
400-499 beds 201 3% 34 5% 41,249 11%
500 or more beds 321 5% 49 8% 96,069 25%
Teaching Status Number Percent Number Percent Number Percent
Teaching 2,087 33% 226 36% 216,301 56%
Nonteaching 4,164 67% 404 64% 166,533 44%
Ownership Number Percent Number Percent Number Percent
Government (Federal and 1,476 24% 77 12% 31,996 8%
non-Federal)
Nongovernment not for profit 3,099 50% 489 78% 318,376 83%
Investor owned (for profit) 1,676 27% 64 10% 32,462 8%
Region Number Percent Number Percent Number Percent
New England 251 4% 33 5% 17,378 5%
Mid-Atlantic 552 9% 61 10% 53,492 14%
South Atlantic/Associated 1,009 16% 151 24% 107,584 28%
Territories
East North Central 912 15% 144 23% 86,680 23%
East South Central 501 8% 27 4% 15,304 4%
West North Central 789 13% 73 12% 30,230 8%
West South Central 1,066 17% 85 13% 33,861 9%
Mountain 521 8% 20 3% 13,436 4%
Pacific/Associated Territories 650 10% 36 6% 24,869 6%
Note: Percentages may not add to 100 due to rounding. States and territories are categorized into AHA-defined regions as
follows:
• New England: CT, MA, ME, NH, RI, VT
• Mid-Atlantic: NJ, NY, PA
• South Atlantic/Associated Territories: DC, DE, FL, GA, MD, NC, SC, VA, WV, Puerto Rico, Virgin Islands
• East North Central: IL, IN, MI, OH, WI
• East South Central: AL, KY, MS, TN
• West North Central: IA, KS, MN, MO, ND, NE, SD
• West South Central: AR, LA, OK, TX
• Mountain: AZ, CO, ID, MT, NM, NV, UT, WY
• Pacific/Associated Territories: AK, CA, HI, OR, WA, American Samoa, Guam, Marshall Islands, Northern Mariana
Islands
8Chapter 4. Respondent Characteristics
This chapter describes respondent characteristics within the participating hospitals.
Highlights
• The top three respondent work areas were:
o Other (30 percent).
o Medicine (13 percent).
o Surgery (10 percent).
• The top three respondent staff positions were:
o Registered nurse or licensed vocational nurse/licensed practical nurse (37 percent).
o Other (21 percent).
o Technician (e.g., EKG, Lab, Radiology) (11 percent).
• Most respondents (78 percent) indicated they had direct interaction with patients.
• More than half (52 percent) of respondents have worked in their hospital for 6 years
or more.
Table 4-1. Distribution of 2018 Database Hospitals by Respondent Characteristics
Respondent Characteristics Database Respondents
Work Area Number Percent
Other 113,133 30%
Medicine (non-surgical) 49,105 13%
Surgery 37,946 10%
Intensive care unit (any type) 25,274 7%
Many different hospital units/No specific unit 24,779 7%
Emergency department 23,692 6%
Radiology 20,060 5%
Laboratory 17,241 5%
Rehabilitation 16,037 4%
Obstetrics 15,120 4%
Pharmacy 11,727 3%
Psychiatry/mental health 8,057 2%
Pediatrics 7,307 2%
Anesthesiology 2,607 1%
Total 372,085 100%
Missing 10,749 N/A
Overall 382,834 N/A
Note: Percentages may not add to 100 due to rounding.
9Table 4-1. Distribution of 2018 Database Hospitals by Respondent Characteristics (continued)
Respondent Characteristics Database Respondents
Staff Position Number Percent
Registered nurse (RN) or licensed vocational nurse (LVN)/licensed 126,390 37%
practical nurse (LPN)
Other position 73,598 21%
Technician (EKG, Lab, Radiology) 38,512 11%
Administration/management 23,959 7%
Patient care assistant/hospital aide/care partner 21,964 6%
Attending/staff physician, resident physician/physician in training, or 18,557 5%
physician assistant (PA)/nurse practitioner (NP)
Unit assistant/clerk/secretary 16,944 5%
Therapist (respiratory, physical, occupational, or speech) 17,325 5%
Pharmacist 6,750 2%
Dietitian 1,851 1%
Total 345,850 100%
Missing 36,984 N/A
Overall 382,834 N/A
Interaction With Patients Number Percent
YES, have direct patient interaction 277,498 78%
NO, do NOT have direct patient interaction 80,059 22%
Total 357,557 100%
Missing 25,277 N/A
Overall 382,834 N/A
Tenure With Current Hospital Number Percent
Less than 1 year 43,180 14%
1 to 5 years 105,747 34%
6 to 10 years 54,684 18%
11 to 15 years 38,600 12%
16 to 20 years 26,367 8%
21 years or more 43,451 14%
Total 312,029 100%
Missing 70,805 N/A
Overall 382,834 N/A
Tenure in Current Work Area Number Percent
Less than 1 year 56,984 17%
1 to 5 years 135,427 41%
6 to 10 years 57,370 17%
11 to 15 years 35,666 11%
16 to 20 years 22,113 7%
21 years or more 25,314 8%
Total 332,874 100%
Missing 49,960 N/A
Overall 382,834 N/A
Note: Percentages may not add to 100 due to rounding.
10Respondent Characteristics Database Respondents
Tenure in Current Specialty or Profession Number Percent
Less than 1 year 25,725 8%
1 to 5 years 91,279 28%
6 to 10 years 58,035 18%
11 to 15 years 41,458 13%
16 to 20 years 35,997 11%
21 years or more 76,937 23%
Total 329,431 100%
Missing 53,403 N/A
Overall 382,834 N/A
Hours Worked Per Week Number Percent
Less than 20 hours per week 17,026 5%
20 to 39 hours per week 132,587 40%
40 to 59 hours per week 159,901 48%
60 to 79 hours per week 13,892 4%
80 to 99 hours per week 7,170 2%
100 hours per week or more 1,484This page is intentionally blank.
12Chapter 5. Overall Results
This chapter presents the overall survey results for the database, showing the average percentage
of positive responses across the database hospitals on each of the survey’s items and composites.
Reporting the average across hospitals ensures that each hospital receives an equal weight that
contributes to the overall average. Reporting the data at the hospital level in this way is important
because culture is considered to be a group characteristic and is not considered to be a solely
individual characteristic.
An alternative method would be to report a straight percentage of positive responses across all
respondents, but this method would give greater weight to respondents from larger hospitals (i.e.,
300 beds or more). Almost half of respondents (49 percent) are from hospitals with 300 beds or
more but these hospitals only make up 22 percent of the database.
Highlights
• The areas of strength or the composites with the highest average percent positive
responses were:
o Teamwork Within Units (82 percent positive).
o Supervisor/Manager Expectations and Actions Promoting Patient Safety (80
percent positive).
o Organizational Learning—Continuous Improvement (72 percent positive).
• The areas with potential for improvement or the composites with the lowest average
percent positive responses were:
o Nonpunitive Response to Error (47 percent positive).
o Handoffs and Transitions (48 percent positive).
o Staffing (53 percent positive).
• On average, most respondents within hospitals (78 percent) gave their work area or
unit a grade of “Excellent” (35 percent) or “Very Good” (43 percent) on patient
safety.
• On average, less than half of respondents within hospitals (45 percent) reported at
least one event in their hospital over the past 12 months. It is likely that this finding
represents underreporting of events.
13Composite and Item-Level Charts
This section provides the overall composite-and item-level results. The method for calculating
the percent positive scores at the item and composite level is described in the Notes section of
this report.
Composite-Level Results
Chart 5-1 shows the average percent positive response for each of the 12 patient safety culture
composites across hospitals in the database. iii The patient safety culture composites are shown in
order from the highest average percent positive response to the lowest.
Item-Level Results
Chart 5-2 shows the average percent positive response for each of the 42 survey items. The
survey items are grouped by the patient safety culture composite they are intended to measure.
Within each composite, the items are presented in the order in which they appear in the survey.
Overall Patient Safety Grade
Chart 5-3 shows the results from the item that asks respondents to give their hospital work
area/unit an overall rating on patient safety.
Number of Events Reported
Chart 5-4 shows the results from the item that asks respondents the number of patient safety
reports they personally filled out and submitted in the past year.
iii Some hospitals excluded one or more survey items and are therefore excluded from composite-level calculations when the
omitted items pertain to a particular composite. For the 2018 report, 11 hospitals were excluded from one or more composite-
level calculations for this reason.
14Chart 5-1. Composite-Level Average Percent Positive Response – 2018 Database Hospitals
Composite Average % Positive Response
Teamwork Within Units 82
Supv/Mgr Expectations & Actions 80
Promoting Patient Safety
Organizational Learning – Continuous 72
Improvement
Management Support for Patient Safety 72
Feedback & Communication About Error 69
Frequency of Events Reported 67
Overall Perceptions of Patient Safety 66
Communication Openness 66
Teamwork Across Units 62
Staffing 53
Handoffs & Transitions 48
Nonpunitive Response to Error 47
Average across composites 65
15Chart 5-2. Item-Level Average Percent Positive Response – 2018 Database Hospitals (Page 1 of 4)
Survey Items by Composite Average % Positive Response
1. Teamwork Within Units
People support one another in this unit. (A1) 88%
When a lot of work needs to be done quickly, 87%
we work together as a team to get the work
done. (A3)
In this unit, people treat each other with 82%
respect. (A4)
When one area in this unit gets really busy, 72%
others help out. (A11)
2. Supervisor/Manager Expectations & Actions Promoting Patient Safety
My supv/mgr says a good word when he/she 79%
sees a job done according to established
patient safety procedures. (B1)
My supv/mgr seriously considers staff 80%
suggestions for improving patient safety. (B2)
Whenever pressure builds up, my supv/mgr 79%
wants us to work faster, even if it means
taking shortcuts. (B3R)
My supv/mgr overlooks patient safety 80%
problems that happen over and over. (B4R)
3. Organizational Learning—Continuous Improvement
We are actively doing things to improve 84%
patient safety. (A6)
Mistakes have led to positive changes here. 63%
(A9)
After we make changes to improve patient 70%
safety, we evaluate their effectiveness. (A13)
Note: The item’s survey location is shown to the right in parentheses. An “R” indicates a negatively worded item, where the
percent positive response is based on those who responded “Strongly disagree” or “Disagree,” or “Never” or “Rarely” (depending
on the response category used for the item).
16Chart 5-2. Item-Level Average Percent Positive Response – 2018 Database Hospitals (Page 2 of 4)
Survey Items by Composite Average % Positive
4. Management Support for Patient Safety
Hospital mgmt provides a work climate that 81%
promotes patient safety. (F1)
The actions of hospital mgmt show that 76%
patient safety is a top priority. (F8)
Hospital mgmt seems interested in patient 59%
safety only after an adverse event happens.
(F9R)
5. Feedback & Communication About Error
We are given feedback about changes put 61%
into place based on event reports. (C1)
We are informed about errors that happen in 69%
this unit. (C3)
In this unit, we discuss ways to prevent errors 76%
from happening again. (C5)
6. Frequency of Events Reported
When a mistake is made, but is caught and 62%
corrected before affecting the patient, how
often is this reported? (D1)
When a mistake is made, but has no potential 63%
to harm the patient, how often is this
reported? (D2)
When a mistake is made that could harm the 76%
patient, but does not, how often is this
reported? (D3)
Note: The item’s survey location is shown to the right in parentheses. An “R” indicates a negatively worded item, where the
percent positive response is based on those who responded “Strongly disagree” or “Disagree,” or “Never” or “Rarely” (depending
on the response category used for the item).
17Chart 5-2. Item-Level Average Percent Positive Response – 2018 Database Hospitals (Page 3 of 4)
Survey Items by Composite Average % Positive
7. Overall Perceptions of Patient Safety
It is just by chance that more serious mistakes 62%
don’t happen around here. (A10R)
Patient safety is never sacrificed to get more 64%
work done. (A15)
We have patient safety problems in this unit. 65%
(A17R)
Our procedures and systems are good at 74%
preventing errors from happening. (A18)
8. Communication Openness
Staff will freely speak up if they see something 79%
that may negatively affect patient care. (C2)
Staff feel free to question the decisions or 50%
actions of those with more authority. (C4)
Staff are afraid to ask questions when 68%
something does not seem right. (C6R)
9. Teamwork Across Units
Hospital units do not coordinate well with each 49%
other. (F2R)
There is good cooperation among hospital 62%
units that need to work together. (F4)
It is often unpleasant to work with staff from 63%
other hospital units. (F6R)
Hospital units work well together to provide 72%
the best care for patients. (F10
Note: The item’s survey location is shown to the right in parentheses. An “R” indicates a negatively worded item, where the
percent positive response is based on those who responded “Strongly disagree” or “Disagree,” or “Never” or “Rarely” (depending
on the response category used for the item).
18Chart 5-2. Item-Level Average Percent Positive Response – 2018 Database Hospitals (Page 4 of 4)
Survey Items by Composite Average % Positive
10. Staffing
We have enough staff to handle the workload. 52%
(A2)
Staff in this unit work longer hours than is best 48%
for patient care. (A5R)
We use more agency/temporary staff than is 64%
best for patient care. (A7R)
We work in “crisis mode” trying to do too 50%
much, too quickly. (A14R)
11. Handoffs & Transitions
Things “fall between the cracks” when 42%
transferring patients from one unit to another.
(F3R)
Important patient care information is often lost 53%
during shift changes. (F5R)
Problems often occur in the exchange of 47%
information across hospital units. (F7R)
Shift changes are problematic for patients in 48%
this hospital. (F11R)
12. Nonpunitive Response to Error
Staff feel like their mistakes are held against 53%
them. (A8R)
When an event is reported, it feels like the 50%
person is being written up, not the problem.
(A12R)
Staff worry that mistakes they make are kept 39%
in their personnel file. (A16R)
Note: The item’s survey location is shown to the right in parentheses. An “R” indicates a negatively worded item, where the
percent positive response is based on those who responded “Strongly disagree” or “Disagree,” or “Never” or “Rarely” (depending
on the response category used for the item).
19Chart 5-3. Average Percentage of 2018 Database Respondents Giving Their Work Area/Unit a
Patient Safety Grade
AChart 5-4. Average Percentage of 2018 Database Respondents Reporting Events in the Past 12
Months
Note: Percentages may not add to 100 due to rounding.
20Chapter 6. Comparing Your Results
To compare your hospital’s survey results with the results from the database, you will need to
calculate your hospital’s percent positive response on the survey’s 12 composites and other
survey items, including the two questions on patient safety grade and number of events reported.
The Notes section at the end of this report describes how to calculate these percent positive
scores, as well as a number of other statistics to facilitate comparisons with the hospital database.
You can then compare your hospital’s results with the database averages and examine the
percentile scores to place your hospital’s results relative to the distribution of database hospitals.
When comparing your hospital’s results with results from the database, keep in mind that the
database only provides relative comparisons. Even though your hospital’s survey results may be
better than the database statistics, you may still believe there is room for improvement in a
particular area within your hospital in an absolute sense.
As you will notice from the database results, there are some patient safety composites that even
the highest scoring hospitals could improve on. Therefore, the data provided in this report should
be used to supplement your hospital’s own efforts to identify areas of strength and areas on
which to focus patient safety culture improvement efforts.
Highlights
• The Nonpunitive Response to Errors composite showed the largest variability across
hospitals, ranging from 20 percent positive to 87 percent positive.
• Patient safety grade had a wide range of responses, from 41 percent of the respondents
giving their work area/unit a rating of “Excellent” or “Very Good” to 100 percent.
• Number of events reported also had a wide range of responses, from 19 percent of
respondents who reported at least one event over the past 12 months to 89 percent.
21Composite and Item-Level Tables
Table 6-1 presents statistics (average percent positive and standard deviation, minimum and
maximum scores, and percentiles) for each of the 12 patient safety culture composites.
Table 6-2 presents statistics for each of the 42 survey items. The survey items are grouped by the
patient safety culture composite they are intended to measure. Within each composite, the items are
presented in the order in which they appear in the survey.
Table 6-3 presents statistics for respondents’ patient safety grade of their work area/unit within
the hospital. Results presented in the table represent average percent positive scores for hospital
respondents who answered “Excellent” or “Very Good.”
Table 6-4 presents statistics for whether respondents reported one or more events. Statistics
include average percent positive scores for hospital respondents who answered “1 to 2 events,”
“3 to 5 events,” “6 to 10 events,” “11 to 20 events,” or “21 or more events.”
22Table 6-1. Composite-Level Results for the 2018 Database
Composite % Positive Response
Average Median/
% 10th 25th 50th 75th 90th
Patient Safety Culture Composites Positive s.d. Min %ile %ile %ile %ile %ile Max
1. Teamwork Within Units 82% 5.37% 40% 76% 79% 83% 86% 89% 99%
2. Supervisor/Manager Expectations & Actions 80% 6.25% 39% 73% 76% 80% 84% 87% 96%
Promoting Patient Safety
3. Organizational Learning—Continuous 72% 6.92% 39% 64% 68% 73% 77% 80% 91%
Improvement
4. Management Support for Patient Safety 72% 8.82% 40% 61% 67% 73% 78% 82% 96%
5. Feedback & Communication About Error 69% 7.81% 38% 59% 64% 69% 73% 79% 90%
6. Frequency of Events Reported 67% 6.90% 40% 58% 62% 67% 72% 76% 91%
7. Overall Perceptions of Patient Safety 66% 8.21% 38% 56% 61% 66% 71% 77% 88%
8. Communication Openness 66% 6.77% 38% 57% 61% 66% 70% 74% 87%
9. Teamwork Across Units 62% 9.68% 34% 50% 55% 62% 68% 75% 88%
10. Staffing 53% 8.93% 27% 43% 47% 53% 59% 65% 85%
11. Handoffs & Transitions 48% 10.48% 22% 35% 40% 46% 54% 62% 85%
12. Nonpunitive Response to Error 47% 8.69% 20% 37% 41% 47% 53% 59% 87%
23Table 6-2. Item-Level Results for the 2018 Database (Page 1 of 4)
Survey Item % Positive Response
Median/
Average % 10th 25th 50th 75th 90th
Item Survey Items by Composite Positive s.d. Min %ile %ile %ile %ile %ile Max
1. Teamwork Within Units
A1 People support one another in this unit. 88% 5.16% 41% 82% 85% 88% 91% 93% 100%
A3 When a lot of work needs to be done quickly, 87% 5.34% 40% 81% 85% 88% 91% 93% 100%
we work together as a team to get the work
done.
A4 In this unit, people treat each other with 82% 6.28% 36% 74% 79% 83% 86% 89% 100%
respect.
A11 When one area in this unit gets really busy, 72% 6.86% 42% 64% 68% 72% 77% 81% 95%
others help out.
2. Supervisor/Manager Expectations & Actions Promoting Patient Safety
B1 My supv/mgr says a good word when he/she 79% 6.70% 40% 71% 76% 80% 83% 87% 100%
sees a job done according to established
patient safety procedures.
B2 My supv/mgr seriously considers staff 80% 6.77% 40% 72% 77% 81% 85% 88% 100%
suggestions for improving patient safety.
B3R Whenever pressure builds up, my supv/mgr 79% 7.46% 13% 70% 74% 79% 84% 87% 97%
wants us to work faster, even if it means
taking shortcuts.
B4R My supv/mgr overlooks patient safety 80% 7.07% 13% 72% 76% 80% 84% 87% 100%
problems that happen over and over.
3. Organizational Learning—Continuous Improvement
A6 We are actively doing things to improve 84% 6.51% 40% 75% 80% 84% 88% 91% 100%
patient safety.
A9 Mistakes have led to positive changes here. 63% 7.81% 27% 53% 58% 64% 68% 72% 85%
A13 After we make changes to improve patient 70% 8.48% 39% 60% 65% 71% 76% 80% 93%
safety, we evaluate their effectiveness.
Note: The item’s survey location is shown to the left. An “R” indicates a negatively worded item, where the percent positive response is based on those who responded “Strongly
disagree” or “Disagree,” or “Never” or “Rarely” (depending on the response category used for the item).
24Table 6-2. Item-Level Results—2018 Database Hospitals (Page 2 of 4)
Survey Item % Positive Response Percentiles
Average Median/
% 10th 25th 50th 75th 90th
Item Survey Items by Composite Positive s.d. Min %ile %ile %ile %ile %ile Max
4. Management Support for Patient Safety
F1 Hospital mgmt provides a work climate that 81% 8.87% 41% 70% 76% 83% 88% 91% 100%
promotes patient safety.
F8 The actions of hospital mgmt show that 76% 9.04% 42% 64% 71% 77% 82% 85% 98%
patient safety is a top priority.
F9R Hospital mgmt seems interested in patient 59% 9.77% 18% 47% 53% 59% 66% 72% 93%
safety only after an adverse event happens.
5. Feedback & Communication About Error
C1 We are given feedback about changes put 61% 9.36% 30% 49% 55% 61% 66% 73% 88%
into place based on event reports.
C3 We are informed about errors that happen in 69% 8.19% 34% 59% 65% 70% 75% 80% 95%
this unit.
C5 In this unit, we discuss ways to prevent errors 76% 7.61% 42% 67% 71% 76% 81% 85% 96%
from happening again.
6. Frequency of Events Reported
D1 When a mistake is made, but is caught and 62% 8.03% 39% 52% 57% 62% 68% 72% 87%
corrected before affecting the patient, how
often is this reported?
D2 When a mistake is made, but has no potential 63% 7.78% 34% 53% 58% 63% 68% 73% 93%
to harm the patient, how often is this
reported?
D3 When a mistake is made that could harm the 76% 6.11% 38% 68% 72% 76% 80% 83% 94%
patient, but does not, how often is this
reported?
Note: The item’s survey location is shown to the left. An “R” indicates a negatively worded item, where the percent positive response is based on those who responded “Strongly
disagree” or “Disagree,” or “Never” or “Rarely” (depending on the response category used for the item).
25Table 6-2. Item-Level Results—2018 Database Hospitals (Page 3 of 4)
Survey Item % Positive Response Percentiles
Average Median/
% 10th 25th 50th 75th 90th
Item Survey Items by Composite Positive s.d. Min %ile %ile %ile %ile %ile Max
7. Overall Perceptions of Patient Safety
A10 It is just by chance that more serious mistakes 62% 9.61% 20% 50% 55% 61% 69% 74% 90%
R don’t happen around here.
A15 Patient safety is never sacrificed to get more 64% 8.81% 38% 54% 58% 64% 70% 77% 91%
work done.
A17 We have patient safety problems in this unit. 65% 9.91% 17% 54% 58% 65% 72% 78% 94%
R
A18 Our procedures and systems are good at 74% 8.31% 37% 63% 69% 75% 79% 83% 96%
preventing errors from happening.
8. Communication Openness
C2 Staff will freely speak up if they see 79% 6.65% 38% 71% 75% 79% 83% 87% 96%
something that may negatively affect patient
care.
C4 Staff feel free to question the decisions or 50% 7.72% 21% 40% 45% 50% 55% 60% 75%
actions of those with more authority.
C6R Staff are afraid to ask questions when 68% 7.98% 13% 59% 63% 68% 73% 77% 93%
something does not seem right.
9. Teamwork Across Units
F2R Hospital units do not coordinate well with 49% 11.60% 19% 35% 41% 49% 56% 65% 85%
each other.
F4 There is good cooperation among hospital 62% 10.35% 33% 49% 55% 62% 69% 76% 94%
units that need to work together.
F6R It is often unpleasant to work with staff from 63% 9.19% 16% 52% 57% 63% 69% 75% 88%
other hospital units.
F10 Hospital units work well together to provide 72% 9.50% 41% 61% 66% 73% 78% 85% 100%
the best care for patients.
Note: The item’s survey location is shown to the left. An “R” indicates a negatively worded item, where the percent positive response is based on those who responded “Strongly
disagree” or “Disagree,” or “Never” or “Rarely” (depending on the response category used for the item).
26Table 6-2. Item-Level Results—2018 Database Hospitals (Page 4 of 4)
Survey Item % Positive Response Percentiles
Average Median/
Survey Items by Patient Safety Culture % 10th 25th 50th 75th 90th
Item Composite Positive s.d. Min %ile %ile %ile %ile %ile Max
10. Staffing
A2 We have enough staff to handle the workload. 52% 11.84% 13% 38% 44% 51% 59% 67% 92%
A5R Staff in this unit work longer hours than is 48% 9.31% 19% 37% 42% 48% 54% 61% 94%
best for patient care.
A7R We use more agency/temporary staff than is 64% 9.73% 10% 52% 58% 64% 70% 76% 93%
best for patient care.
A14 We work in “crisis mode” trying to do too 50% 11.11% 19% 36% 41% 49% 56% 65% 90%
R much, too quickly.
11. Handoffs & Transitions
F3R Things “fall between the cracks” when 42% 11.71% 10% 29% 34% 41% 49% 59% 86%
transferring patients from one unit to another.
F5R Important patient care information is often lost 53% 9.90% 27% 41% 47% 53% 60% 66% 90%
during shift changes.
F7R Problems often occur in the exchange of 47% 11.05% 19% 33% 39% 45% 53% 63% 85%
information across hospital units.
F11R Shift changes are problematic for patients in 48% 11.18% 21% 35% 40% 47% 54% 64% 88%
this hospital.
12. Nonpunitive Response to Error
A8R Staff feel like their mistakes are held against 53% 9.46% 19% 42% 47% 53% 59% 65% 94%
them.
A12 When an event is reported, it feels like the 50% 8.70% 26% 39% 44% 50% 55% 61% 86%
R person is being written up, not the problem.
A16 Staff worry that mistakes they make are kept 39% 9.19% 16% 28% 33% 38% 45% 51% 81%
R in their personnel file.
Note: The item’s survey location is shown to the left. An “R” indicates a negatively worded item, where the percent positive response is based on those who responded “Strongly
disagree” or “Disagree,” or “Never” or “Rarely” (depending on the response category used for the item).
27Table 6-3. Percentage of Respondents Giving Their Work Area/Unit Patient Safety Grade—2018 Database Hospitals
Survey Item % Response Percentiles
Median/
Average 10th 25th 50th 75th 90th
Item Work Area/Unit Patient Safety Grade % s.d. Min %ile %ile %ile %ile %ile Max
E1 Excellent or Very Good 78% 8.93% 41% 66% 73% 79% 83% 88% 100%
Note: For the results for all response options, see Chart 5-3.
Table 6-4. Percentage of Respondents Reporting One or More Events in the Past 12 Months—2018 Database Hospitals
Survey Item % Response Percentiles
Median/
Average 10th 25th 50th 75th 90th
Item Events Reported in the Past 12 Months % s.d. Min %ile %ile %ile %ile %ile Max
G1 1 or more events 45% 10.17% 19% 32% 38% 44% 52% 58% 89%
Note: For results for all response options, see Chart 5-4.
28Chapter 7. Trending: Comparing Results Over Time
Many hospitals that administer the hospital survey have indicated that they intend to continue to
administer the survey on a regular basis and to track changes in patient safety culture over time.
While the overall results presented earlier in this report reflect only the most recent survey data
from all 630 participating hospitals, we have data from two administrations of the survey for 306
hospitals. These hospitals submitted to both the 2016 and 2018 databases, so we could examine
trends over time for them. We did not include hospitals that submitted to databases before 2016
in the trending database. This chapter presents trending results from these 306 hospitals.
Highlights
• Across the 306 trending hospitals, the Nonpunitive Response to Error composite
had the largest increase (3 percent) from the previous to the most recent database.
• Of those hospitals that increased on Patient Safety Grade, scores for “Excellent” or
“Very Good” increased on average 6 percent.
• For hospitals with increases in the number of respondents who reported at least one
event in the past 12 months, the average increase was 5 percent.
When reviewing the results in this chapter, keep in mind that survey scores might change, or not
change, over time for a number of complex reasons. Important factors to consider are whether
the hospital implemented patient safety initiatives or took actions between survey
administrations and the length of time between administrations.
Survey methodology issues can also play a big role in score changes. Low survey response rates
for the previous or most recent administration, changes in the number of staff asked to complete
the survey, or changes in the types of staff asked to complete the survey will make it difficult to
interpret changes in scores over time.
29Table 7-1. Trending: Response Rate Statistics—2018 Database Hospitals
Summary Statistic Most Recent Submission (2018) Previous Submission (2016)
Total number of respondents 228,430 212,674
Number of completed surveys per hospital Average: 747 Average: 695
Range: 22 – 6,139 Range: 27 – 6,262
Hospital response rate Average: 56% Average: 54%
Range: 12% – 100% Range: 7% – 100%
Note: Trending hospitals include hospitals that submitted to both the 2016 and 2018 databases.
Table 7-2. Distribution of 2018 Trending Hospitals
Trending Hospitals
Item Trending
2016-2018 AHA-Registered U.S. Hospitals
Bed Size Number Percent Number Percent
6-24 beds 11 4% 770 12%
25-49 beds 22 7% 1,445 23%
50-99 beds 55 18% 1,237 20%
100-199 beds 85 28% 1,263 20%
200-299 beds 57 19% 646 10%
300-399 beds 30 10% 368 6%
400-499 beds 17 6% 201 3%
500 or more beds 29 9% 321 5%
Total 306 100% 6,251 100%
Teaching Status Number Percent Number Percent
Teaching 123 40% 2,087 33%
Nonteaching 183 60% 4,164 67%
Total 306 100% 6,251 100%
Note: Percentages may not add to 100 due to rounding.
30Table 7-2. Distribution of 2018 Trending Hospitals (continued)
Trending Hospitals
Trending
2016-2018 AHA-Registered U.S. Hospitals
Ownership Number Percent Number Percent
Government (Federal or non-Federal) 42 14% 1,476 24%
Nongovernment (voluntary/nonprofit or 264 86% 4,775 76%
proprietary/investor owned)
Total 306 100% 6,251 100%
Region Number Percent Number Percent
New England 15 5% 251 4%
Mid-Atlantic 26 8% 552 9%
South Atlantic/Associated Territories 100 33% 943 15%
East North Central 68 22% 912 15%
East South Central 19 6% 501 8%
West North Central 15 5% 789 13%
West South Central 23 8% 1,066 17%
Mountain 18 6% 521 8%
Pacific/Associated Territories 22 7% 647 10%
Total 306 100% 6,182 100%
Note: Percentages may not add to 100 due to rounding. States and territories are categorized into AHA-defined regions as follows:
• New England: CT, MA, ME, NH, RI, VT
• Mid-Atlantic: NJ, NY, PA
• South Atlantic/Associated Territories: DC, DE, FL, GA, MD, NC, SC, VA, WV, Puerto Rico, Virgin Islands
• East North Central: IL, IN, MI, OH, WI
• East South Central: AL, KY, MS, TN
• West North Central: IA, KS, MN, MO, ND, NE, SD
• West South Central AR, LA, OK, TX
• Mountain: AZ, CO, ID, MT, NM, NV, UT, WY
• Pacific/Associated Territories: AK, CA, HI, OR, WA, American Samoa, Guam, Marshall Islands, Northern Mariana Islands
31Composite and Item-Level Trending Results
Table 7-3. Trending: Composite-Level Results—2018 Database Hospitals
Composite % Positive Response
Most Maximum Maximum Average Average
Patient Safety Culture Composites Recent Previous Change Increase Decrease Increase Decrease
1. Teamwork Within Units 82% 82% 0% 20% -13% 3% -3%
2. Supervisor/Manager Expectations & Actions 80% 78% 2% 57% -26% 4% -3%
Promoting Patient Safety
3. Organizational Learning—Continuous 73% 73% 0% 18% -39% 3% -4%
Improvement
4. Management Support for Patient Safety 73% 73% 0% 19% -24% 5% -5%
5. Feedback & Communication About Error 69% 68% 1% 16% -40% 4% -4%
6. Frequency of Events Reported 67% 66% 1% 23% -23% 4% -4%
7. Overall Perceptions of Patient Safety 66% 66% 0% 28% -20% 4% -4%
8. Communication Openness 66% 64% 2% 22% -23% 4% -3%
9. Teamwork Across Units 62% 61% 1% 24% -16% 5% -4%
10. Staffing 54% 54% 0% 23% -26% 5% -5%
11. Handoffs & Transitions 48% 47% 1% 20% -19% 5% -5%
12. Nonpunitive Response to Error 48% 45% 3% 25% -15% 5% -4%
Note: Based on data from 306 trending hospitals that had composite-level scores; the number of respondents was 228,430 for the most recent results and 212,674 for the previous
results.
32You can also read