Pathways to Sustainable Growth for Rwanda's Coffee Sector - Feed the Future Africa Great Lakes Region Coffee Support Program (AGLC) Policy Roundtable
←
→
Page content transcription
If your browser does not render page correctly, please read the page content below
Pathways to Sustainable Growth for
Rwanda’s Coffee Sector
Feed the Future Africa Great Lakes Region Coffee Support Program
(AGLC) Policy Roundtable
March 2017 Kigali, Rwanda
Roundtable
Introduction

               2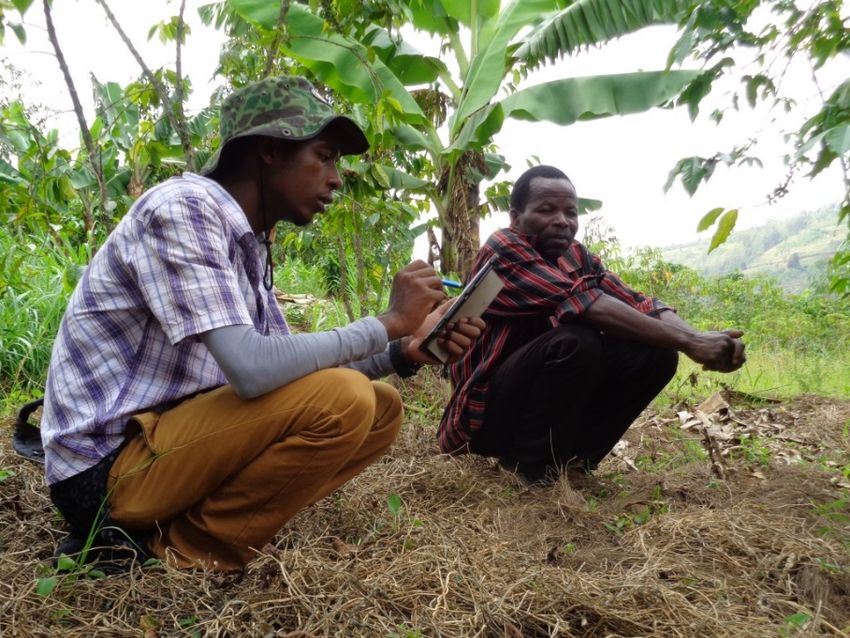
AGLC Background
• AGLC is a 3-year USAID-funded initiative that
  addresses 2 major challenges in the coffee sector in
  Rwanda (and the Africa Great Lakes region)
   • Reduce antestia bug/potato taste defect (PTD)
   • Raise coffee productivity
• Partners
   • Rwanda: Inst. of Policy Analysis and Research (IPAR)
     and Univ. of Rwanda (UR)
   • USA: Michigan State University (MSU) and Global
     Knowledge Initiative (GKI)
   • Numerous public and private sector partners
• Components: • applied research • policy engagement
  • capacity building
                                                            3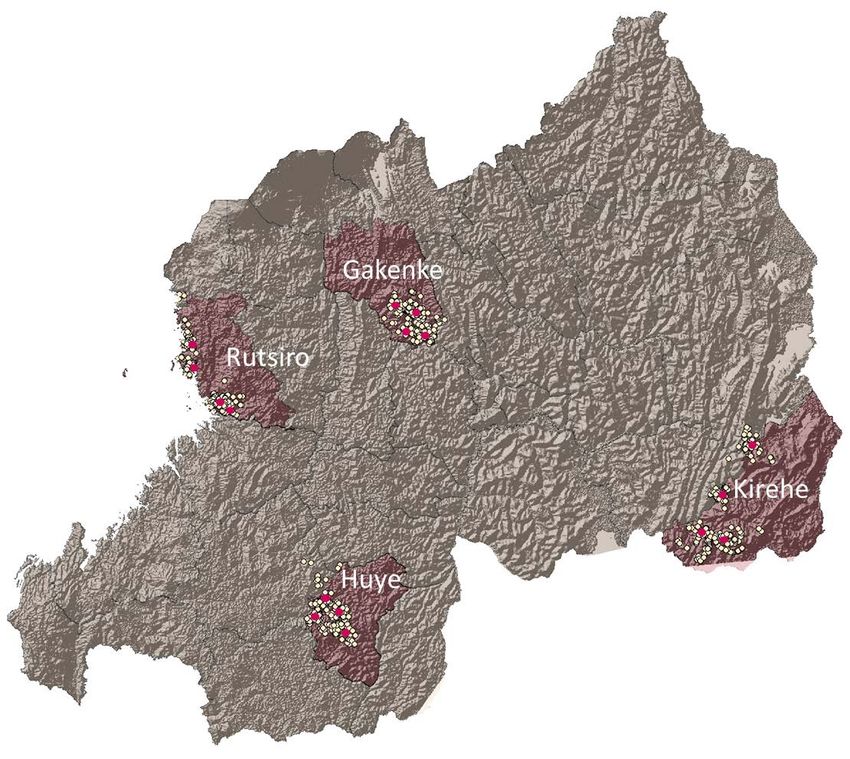
Applied research component
• AGLC draws upon a broad mix of quantitative and
  qualitative methodologies, including:
  •   Coffee farmer/household surveys (and CWS survey)
  •   Experimental field/plot level data collection
  •   Key Informant Interviews
  •   Focus Group Discussions
• Comprehensive coffee sector data base
  • Goal to integrate information from these four data
    collection activities
  • Provide empirical basis for policy engagement and
    farmer capacity building

                                                         4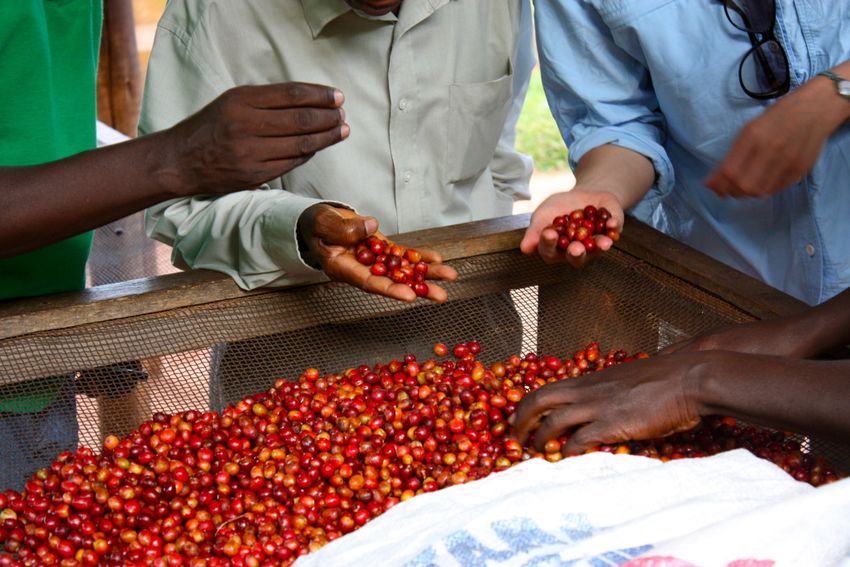
Guiding questions:
• How might we promote the long-term
  sustainability of Rwanda’s coffee sector?
• As a pillar of long-term sustainability, how might
  we motivate coffee producers to invest more in
  their plantations?

                                                       5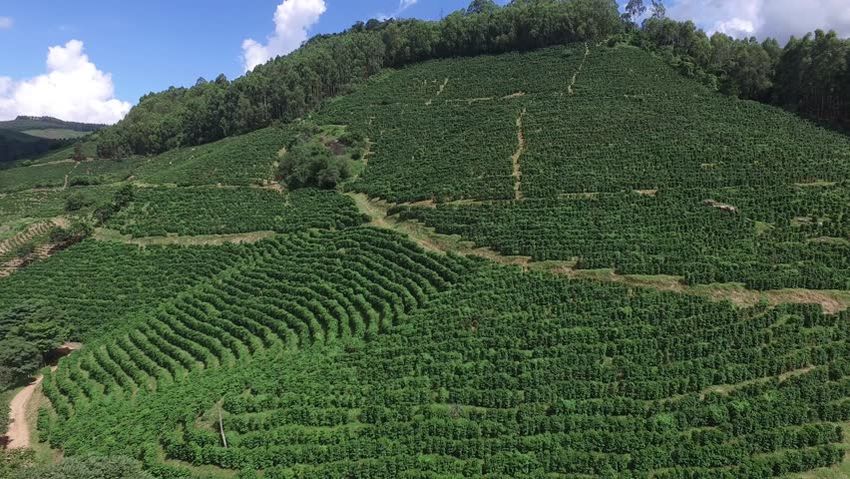
Methodology

              6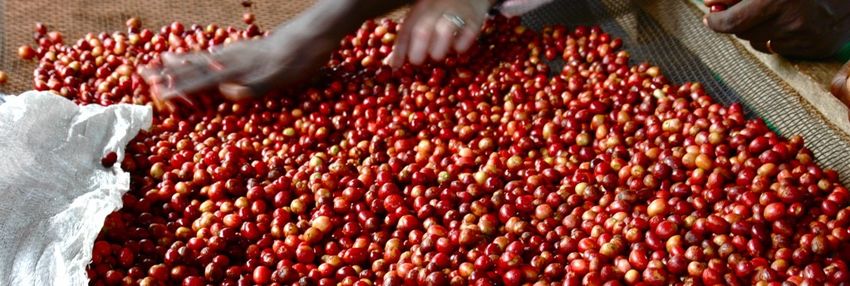
Baseline/Midline Survey of coffee growers
• Geographically dispersed
  sample across four coffee
  growing districts: Rutsiro,
  Huye, Kirehe and Gakanke.
• 4 CWSs in each District (2
  cooperatives, 2 private)
• 64/32 HHs randomly
  selected from listings of
  each of the 16 CWSs
 • Baseline (64 x 16 = 1,024 HHs)
 • Midline (32 x 16 = 512 HHs)

                                            7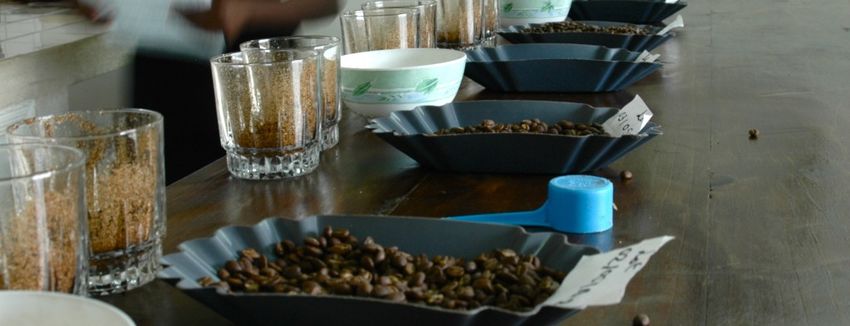
Baseline & midline survey, cont.
• Focus on fully-washed coffee. Sample does not include
  HHs not on CWS listings
   • Advantage: In depth focus on core of Rwanda’s coffee sector
     strategy (Fully-washed coffee)
   • Disadvantage: Ordinary coffee (parchment) producers
     underrepresented
• Survey instrument includes diversity of topics:
   • coffee growing practices • antestia control practices • cost of
   production • coffee field characteristics • cherry production &
   cherry sales • basic household demographics • effects of
   zoning policy • coffee risk relative to other crops • food
   security • climate change
• Programmed (in CSPro) on 7” tablets for data
  collection
• 10 enumerators (working in 2 teams of 5)

                                                                   8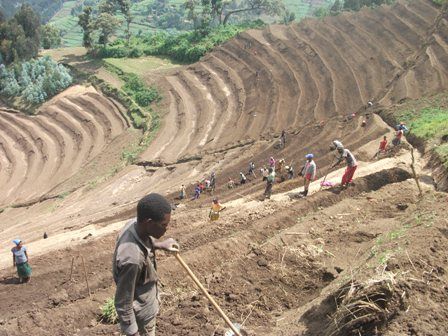
Qualitative Data
• Key informant interviews
  • Key coffee sector leaders including public sector
    representatives, farmer organizations, and private
    sector stakeholders.
  • Focused on challenges identified by stakeholders and
    provided insights into critical areas of convergence
    and disagreement among various specialty coffee
    sector stakeholder groups.
• Focus group discussions
  • Held with major coffee stakeholder groups including
    coffee farmers, washing station managers, coffee
    exporters, others.
  • Groups of 5-7 members of each stakeholder group.
                                                           9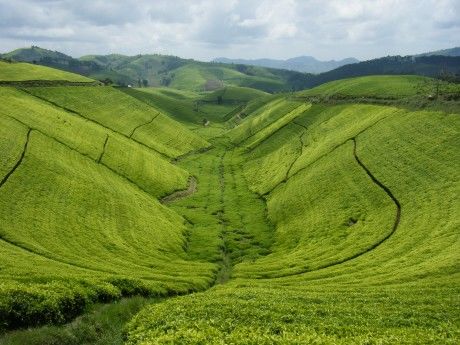
Fieldwork

                           Focus group discussion
                           with farmers at Buf Café
                           washing station

AGLC Baseline survey
interview with farmer in
Gakenke

                                                      10
Research Findings
11Recap of what we learn from 2015 findings
1. Low and stagnating coffee production coming up short of our
targets for growth
2. Producer prices 25-30% below other coffee producing countries in
the region
3. Lower productivity (Kg/tree) than others in the region
4. Cost of production is high relative to returns so that a large
proportion of growers suffer net losses in coffee.
5. Incentives and capacity diffs among larger and smaller producers
6. Importance of prices and price stability for farmer investment in
higher production and productivity
7. Low farmer investment has contributed weak and old trees
yielding low quality coffee and has invited antestia/PTD
12Farmer investments in coffee (per tree)
13Productivity
2015 2016
14Gross margins (profits)
2015 2016*
*2016 gross margin based on 2015 costs to
harvest cherry which are likely higher than
actual cost due to ~23% lower production in
2016.
1516
17
Low and unstable cherry prices reported as the most
important barriers to investment in coffee
                                  Low and Unstable Cherry Prices Reported by
                                  Farmers as Barriers to Investment in Coffee
                                         by Number of Trees on Farm

                                               Low cherry          Unstable
                                               prices are a cherry prices
                                                  barrier to are a barrier to
                              Trees on farm    investment        investment        N
Premium Payments to Farmers in 2015 and 2016
Payments and productivity 2015 2016
Promised premium % "Yes" 31.4% 68.8%
Received premium % "Yes" 26.8% 35.4%
N 1,016 512
Premium received (RWF/Kg) Mean 16.4 21.9
Median 15.0 20.0
Premium received (Total RWF) Mean 11,721 23,431
Median 7,000 10,000
N* 274 181
Cherry prices received by farmers Mean 198 172
Median 200 160
N 1,022 502
Increase in productivity (Kg/tree)
% 29.2% 8.2%
associated with premium (ANOVA)
N 1,016 510
*Among those receiving a premium
19Observations on the long-term sustainability of
Rwanda’s coffee sector
1. Coffee sector cannot be sustainable unless producers are
motivated to invest in their plantations.
2. Coffee prices and bonuses (and their stability) are by far
the most important incentives to farmer investment.
3. Coffee value chain is fragile and risks collapse if steps are
not taken to support producers and to bring in a younger
generation of coffee farmers.
4. Needs much public and private sector support.
20How might we promote the long-term sustainability of
Rwanda’s coffee sector?
• There are many priorities in Rwanda agriculture but coffee is not high on
the list
• Coffee is given secondary status in the Rwanda National Agriculture
Policy 2030,
• MINAGRI Strategic Plan (PSTA III)
• Project for Rural Income through Exports (PRICE)
• Focus on building capacity (production side) with no mention of
incentives
• It is not a CIP crop so does not receive that level of investment from public
resources.
• Coffee is not given the level of policy attention given to other crops
• But it should be…
21Why should coffee be a top national priority for
Rwanda?
1. For many reasons:
• Agronomic
• Economic
• Environmental
• Socio-cultural
2. Comparatively, few crops in Rwanda hold the
breadth of importance or long-term potential of
coffee
3. A closer look as some of them…
22Reason #1. Coffee is historically Rwanda’s top source of
export earnings and economic growth
• Production tradition and know-how
• Processing infrastructure
• Institutional capacity
• But its importance is declining
23Reason #2. Coffee affects over 450,000 farmers and
their families.
• Major source of income for producers
24Coffee income used for vital goods & services…
25Reason #3. Specialty coffee is in high and growing
demand worldwide
26Reason #4. Specialty coffee has price stability in
international markets (compared to ordinary)
• Given the
premium value,
specialty growers
can be somewhat
insulated from
price fluctuations
• African specialty
coffee is
becoming
“decoupled”
from the NY C
price
27Reason #5. Rwanda has international comparative
advantage in specialty coffee
• Ideal agroecology for growing coffee:
• High elevation mountain agriculture
• Tropical climate with good rainfall
• Good soils
• Source of prized Bourbon varieties
• Labor availability
• Strong market appeal
• History and compelling story
• Cooperative tradition
• Smallholder farmers
28Reason #6. Environmentally superior to most other crops
• Grows well on steep hillsides
• Mulching decomposition adds needed organic matter to
soils
• Does not need expensive terraces (a major cost savings)
• Coffee controls soil erosion better than any other crop
• Root structure
• Canopy
• No exposed soils due to tillage
• Heavily mulched
• Combined, these factors bring low erosivity…
29Coffee has exceptionally low erosivity
30Coffee’s low erosivity eliminates the need for high-cost
bench terrace construction and maintenance in steep slopes
• Cost per hectare to construct
bench terraces: 2500-3000
US$*
• Annual maintenance cost per
hectare for bench terraces:
~150 $US
• 91,000 Ha constructed (2012-
2016), 37,5% of land suitable
for terraces
• Construction costs largely
subsidized through
government programs
(MINAGRI)
*Source: A R Bizoza, J B Nkurikiye, P Byishimo.
Farmers’ Perspectives of Climate Change Adaption
and Resilience in Rwanda, Administratio Publica,
Vol 24 No 4 December 2016.
31Tea plantation in Rwanda on slopes Coffee plantation in Brazil on slopes that
that would otherwise be terraced would otherwise be terraced
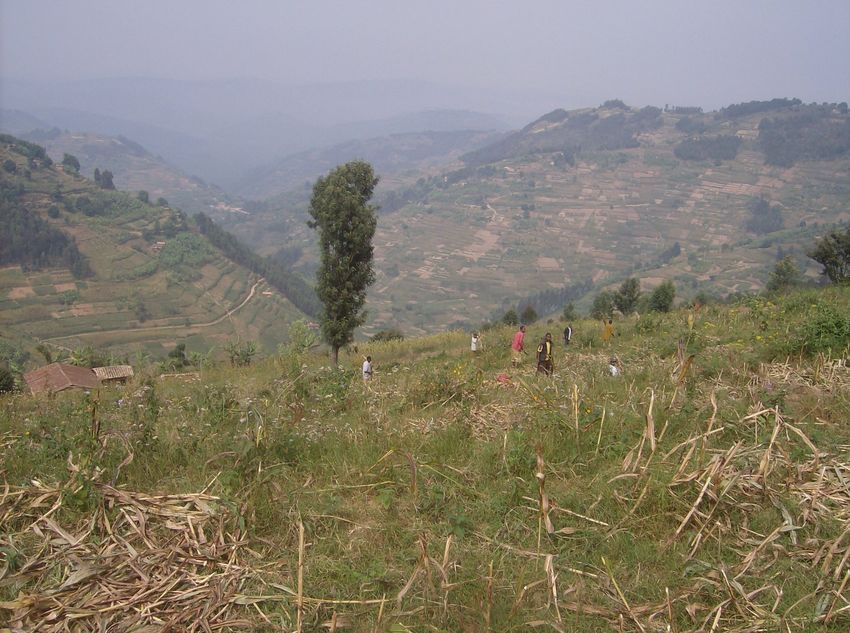
32• Typical steep hillsides
in Rwanda that need
either terraces or
coffee (or tea or fruit
trees) to be
sustainable in the long
term.
• Coffee may be the
best option for many.
• It will take a concerted
effort by the
stakeholders in the
coffee value chain to
realize such a vision.
• It will also require
motivated farmers.
33Reason #7. Coffee is less vulnerable to risks of droughts,
floods, and pests/diseases compared to several other
priority crops.
34Reason #8. Dedicated coffee producing households
have better food security
Logistic Regression Model: Household Experienced Long-term Food Shortfall
(> 1 month) by Coffee Income Share and Selected Covariates
Inverse
Odds
Regressors B S.E. Wald df Sig. Exp(B) Ratio‡
Coffee share (% ) of total HH Income -1.077 0.421 6.524 1 0.011** 0.341 2.93
Member of coop -0.289 0.200 2.085 1 0.149 0.749 1.34
Total land owned (Ha) -0.297 0.110 7.325 1 0.007*** 0.743 1.35
Income 2015 (not including coffee) 0.000 0.000 3.884 1 0.049** 1.000 1.00
Gender of HH head 0.866 0.265 10.680 1 0.001*** 2.377 -
Age of HH head 0.000 0.010 0.000 1 0.994 1.000 -
Active adults in HH 0.081 0.066 1.511 1 0.219 1.084 -
Education of HH head -0.209 0.096 4.776 1 0.029** 0.811 1.23
Years growing coffee 0.011 0.009 1.477 1 0.224 1.012 -
Elevation of HH (m) 0.000 0.001 0.268 1 0.605 1.000 1.00
Constant 0.608 1.182 0.265 1 0.607 1.837 -
*, **, *** indicates significance at the 10% , 5% and 1% levels, respectively.
‡ For ease of interpretation inverse odds ratio computed for covariates with negative log odds (B).
N=508 housholds
35Summary & discussion
points
36Recap of challenge and findings
1. Long-term success of the coffee sector (all stakeholders)
depends on growth in production and productivity
2. Farmer investment in productivity is the critical factor
3. Farmer incentives to invest are the key to higher investment and
productivity
4. Coffee is stagnant and vulnerable but has high potential for
long term growth and sustainability due to:
• Trends in specialty coffee markets are promising (growing
and becoming detached from NY C price)
• Exceptional comparative advantage based on agronomic,
economic, environmental and socio-cultural factors
5. Despite vulnerability and potential, coffee has not received the
level of policy attention needed to be successful in the long
term
37Discussion questions
1. What else do we conclude from the data?
2. What are the major policy levers that can help motivate farmers to
invest in coffee?
3. What steps can be taken to elevate coffee in our strategic thinking
and actions?
• How to best communicate the importance and potential of coffee
(the 8 points)?
4. Are there specific actions that can be taken to provide incentives for
farmers to invest?
• When to set and announce cherry prices?
• How to stabilize cherry prices from year to year?
• How to better use media to inform and engage farmers?
5. How can we better articulate the challenge and what else do we
need to know?
38Thank You!
39www.feedthefuture.gov
40You can also read