Vulnerability Assessment of the Irish Dairy Sector - YOUR ASSOCIATION. YOUR VOICE.
←
→
Page content transcription
If your browser does not render page correctly, please read the page content below
YOUR ASSOCIATION.
                                  YOUR VOICE.

Vulnerability Assessment
of the Irish Dairy Sector

January 2021

www.ifa.ie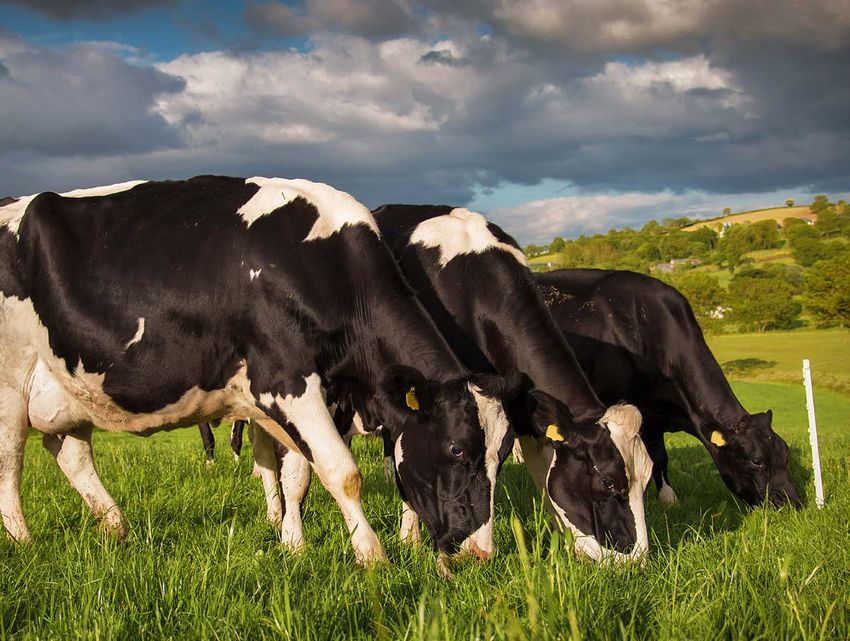
“The economic viability of many rural towns and
 villages is dependent on the dairy sector. For the
 industry to thrive, we must ensure that dairy
 farmers are economically sustainable. The industry
 is extremely vulnerable to milk price reductions and
 increased costs associated with excessive regulation.
These risks leave many farming families exposed
 and facing uncertainty about their future. The sector
 must ensure that farmers, as the primary producers,
 do not bear the financial brunt of these risks”

Tom Phelan, IFA Dairy Chairman

IFA : Vulnerability Assessment of the Irish Dairy Sector 3 P3
Introduction
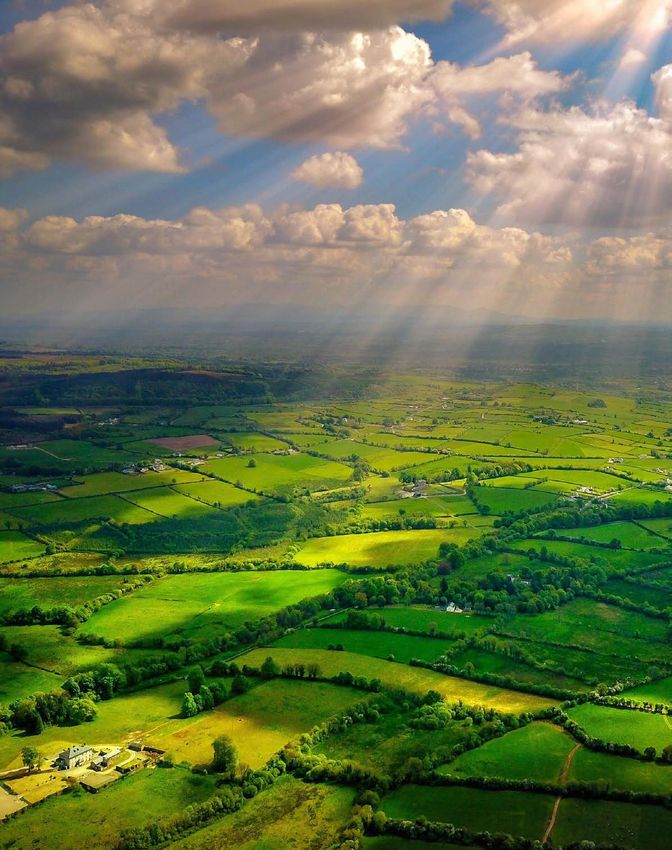
The dairy sector in Ireland is robust, supporting almost 17,000 farm families. In the last five years, the dairy sector has undergone
significant expansion. As a direct consequence of this expansion, numerous revenue streams have developed throughout the rural
economy. In 2019 alone, dairy farmers invested on average €34,221 in their farms1.
The purpose of this paper is to:
• Highlight the gains achieved by the sector in the past ten years;
• Demonstrate how profits at the farm level remain modest;
• Outline the vulnerability of farms to factors such as reductions in milk price and costs associated with environmental or other
restrictions.
Industry gains
Food Harvest 20202 outlined an ambitious 50% growth in milk production by 2020 for the dairy sector, with associated downstream
benefits to the broader economy.
Irish dairy farmers delivered on this target ahead of schedule. In so doing, they contributed real long-term economic benefits to the
Irish economy, including an increase in export value of €2.9bn over the last decade.3
Table 1: Summary of achieved targets set out in Food Harvest 2020
Food Harvest 2020 Goal Achievement in 2020
Increase milk production by 50% (2007-2009 average milk
67% growth in milk production achieved4
production as a baseline)
Achieve 42% increase in dairy exports Dairy exports grew by 134%5
Reduce emission per litre of milk reduced 7% reduction in carbon intensity between 2013 and 20196
Predicted investment by industry of €400m See Appendix I
Source: CSO, Bord Bia, National Farm Survey
Impact of the dairy sector on the rural economy
There are 17,000 dairy farmers in Ireland. Associated with the sector are approximately 40,0007 indirect jobs in processing, haulage,
sales and services. Crucially, this employment is in areas throughout the country where employment prospects are limited and
purchasing power is lower.
In Ireland, those living in rural areas have, on average, half the purchasing power of those in urban areas8. Therefore, both at the
primary and processor level, investment by the dairy sector has played a vital role in somewhat rebalancing fiscal development in
the Irish economy.
Since 2015, over €2.2bn was invested by dairy farmers9 and over €1.3bn invested by milk processors (see Appendix I) in the sector.
This investment has had knock-on benefits to the broader economy. Crucially, for every €1 of dairy product exported, 90c is spent
within the Irish economy. In contrast, 10c per euro exported by the multinational sector is reinvested in the Irish economy10. In 2020,
dairy exports amounted to €5.2bn.
Appendix I outlines seven of Ireland's largest milk processors and their contribution to the local economy.
1 Teagasc National Farm Survey 2019: https://www.teagasc.ie/media/website/publications/2020/Teagasc-National-Farm-Survey-2019.pdf
2 Food Harvest 2020: https://www.gov.ie/en/publication/5a0f2-food-harvest-2020/
3 Bord Bia Performance and Prospects Reports: https://www.bordbia.ie/industry/insights/performance-and-prospects/previous-performance-prospects/
4 CSO milk statistics: https://www.cso.ie/en/statistics/agriculture/milkstatistics/
5 Bord Bia Performance and Prospects Reports: https://www.bordbia.ie/industry/insights/performance-and-prospects/previous-performance-prospects/
6 National Farm Survey 2019 Sustainability Report: https://www.teagasc.ie/media/website/publications/2020/NFS-2019-Sustainability-Report.pdf
7 Teagasc, Dairy in the Irish Economy: https://www.teagasc.ie/media/website/publications/2019/Dairy-in-the-Irish-economy.pdf
8 EU Commission: https://ec.europa.eu/info/sites/info/files/food-farming-fisheries/key_policies/documents/cap-strategic-plans-c2020-846-swd-ie_en.pdf
9 National Farm Survey: https://www.teagasc.ie/rural-economy/rural-economy/national-farm-survey/national-farm-survey-reports/
10 Teagasc, Dairy in the Irish Economy: https://www.teagasc.ie/media/website/publications/2019/Dairy-in-the-Irish-economy.pdfP4 4 IFA : Vulnerability Assessment of the Irish Dairy Sector
Dairy farm income comparison
As referenced previously, the 2015-2019 period saw a substantial increase in Irish milk production, with on-farm production
increasing by almost 50% and average herd size increasing from 67 cows to 86 cows.
However, during this time, we have not seen a corresponding increase in dairy farm incomes. Based on the National Farm Survey
analysis, dairy incomes for 2019 were lower than those in 2014.
Much of this is related to a lower milk price prevailing in 2019. Even accounting for this, farm net margins have not kept pace with
expansion.
Table 2: Dairy Family Farm income (FFI) analysis
2014 2019 % Change
Dairy FFI (€) 67,598 65,828 -3%
Milk production (litres) 308,661 456,354 +48%
Family Labour input (labour units) 0.36 0.37 +3%
Dairy income (€) (wage attributed to family labour) 49,704 48,049 -3%
Average full-time industrial wage (€) 44,829 48,946 +9%
Dairy Farmer Income/Ave Full-time industrial wage 1.11 0.98 -12%
Source: Teagasc, National Farm Survey, CSO
On the face of it, even though incomes have not increased in the 2015-2019 period, income levels in dairy farming appear high
relative to other agricultural sectors and indeed the wider economy. However, as the National Farm Survey confirms, there is a
substantial level of unpaid family labour evident on Irish dairy farms. When this labour input is accounted and an appropriate cost
attributed to it, average dairy farm incomes in 2019 were actually lower than the equivalent Irish full-time average industrial wage.
In addition to rewarding a farmer for their labour input, the income derived from farming is also required for much more than that.
Firstly, it is what remains to give a farmer an entrepreneurial return for the risk’s farmers take in running a self-employed business
along with employing very substantial assets on ongoing basis. Secondly, from this income farmers are also required to service
capital repayments on bank finance they have in place. As the following table illustrates, many dairy farmers have significant levels
of borrowings which require servicing.
Table 3: Percentage of Irish Farms with Borrowings and Average Debt 201911
Enterprise Farms with Borrowings (%) Average Debt (€)
Dairy 64% €117,039
Cattle Rearing 30% €26,301
Cattle Other 34% €35,072
Sheep 25% €27,835
Tillage 32% €60,901
All 37% €61,237
Source: National Farm Survey
11 National Farm Survey: https://www.teagasc.ie/rural-economy/rural-economy/national-farm-survey/national-farm-survey-reports/IFA : Vulnerability Assessment of the Irish Dairy Sector 5 P5
Assessment of factors that could impact farm
incomes
Dairy Sector Vulnerabilities impact of a drop in milk price or drop on stocking rate on farm income.
Based on the National Farm Survey analysis, the average milk price paid to farmers in 2019 was 34.5 cent/litre. A key feature of
dairy farming over the past number of years has been milk price volatility.
At current levels, dairy farmer net margins are susceptible to any significant milk price drop.
For example, a two-cent drop in milk price would reduce the average dairy net margin by approximately €9,300 and reduce the
average dairy farmer income (after accounting for family labour input) to c. €41,200.
Furthermore, if implemented, the EU Green Deal proposals will reduce artificial nitrogen usage levels for dairy farmers. A recent
analysis by Teagasc12 has shown that a 20% reduction in inorganic nitrogen usage would reduce dairy farm net margins by c. 10%.
Irish dairy farm net margins are vulnerable to both adverse milk price movements and increased fertiliser restrictions.
Return on assets
The recent Teagasc/CIT study13 on Irish dairy farms post-quota
Table 4: Return on Asset Rates for Dairy outlined that Irish dairy farm businesses have the highest net
Farms in different EU Member States and margins in Europe.
the UK.
While an important measure, net margin is one of several
Selected EU Member Return on comparative benchmarks used to assess a business's financial
States and UK Asset (%) performance. Another widely used method is Return on Asset (ROA)
Italy 8.9 – the percentage return the business owner is getting for the assets
they have tied up in their business.
France 8.8
Using 2018 Farm Accountancy Data Network14 (FADN), it is possible
Belgium 6.9
to compare Irish dairy farms' performance from an ROA perspective
Germany 5.7 relative to their European counterparts.
Finland 5.0 As this table shows, ROA achieved on Irish dairy farms in 2018 (4.4%)
Ireland 4.4 was lower than the European average (5.3%). So, while Irish dairy
United Kingdom 3.6 farmers appear to be achieving relatively higher margins than their
European neighbours, the overall percentage return they are earning
Denmark 2.9 on their asset base is still below the European average.
Sweden 2.2
The above ROA calculation does not account for labour input. If we
Netherlands 2.1 attribute Ireland's average industrial wage for the farmers' labour
EU/UK Average 5.3 input, the percentage return on asset reduces to 1.4%, outlining the
low return dairy farmers in Ireland (and other EU countries) receive
Source: 2018 FADN data for their business investment.
12 Teagasc, Review of the Influence of Chemical Nitrogen Application Rate, Soil Type and Agroclimate Location on Grass Production, Feed Budgets, Nitrogen Use
Efficiency, Environmental Impact and Farm Profitability: https://www.teagasc.ie/publications/2020/review-of-the-influence-of-chemical-nitrogen-applica-
tion-rate-soil-type-and-agroclimate-location-on.php
13 Teagasc, An Analysis of the Irish Dairy Sector Post Quota: Lowest Milk Price but Highest Margin: https://www.teagasc.ie/news--events/news/2020/irish-
dairy-sector-.php
14 FADN: https://ec.europa.eu/info/food-farming-fisheries/farming/facts-and-figures/farms-farming-and-innovation/structures-and-economics/economics/fadn_enP6 6 IFA : Vulnerability Assessment of the Irish Dairy Sector
Conclusion
The expansion in milk production has delivered substantial economic benefits to the broader Irish economy, both in terms of
employment and net foreign earnings associated with the processing sector, and the economic activity generated from the on-
farm investment.
There is no doubt that dairy expansion has provided many Irish farmers with the opportunity to increase their overall farm profitability.
However, it must also be recognised that dairy farm incomes remain modest when compared with the average industrial wage.
Furthermore, dairy farm margins are vulnerable to a downward movement in milk price and increased fertiliser usage restrictions
and other costs.
Similarly, in a European context, the actual return dairy farmers receive on the substantial assets tied up in their business is below
the EU average.
While Irish dairy farming net margins are more favourable than our EU counterparts, other considerations put these apparent high
margins into a more appropriate context.
Tadhg Buckley BAgrSc., MBA, QFA Aine O’Connell, BSc., PhD
Director of Policy/Chief Economist Dairy Policy ExecutiveIFA : Vulnerability Assessment of the Irish Dairy Sector 7 P7
Appendix I
Economic footprint of Irish Dairy Industry
• Employ 300 people in West Cork
• €78m capital investment for Mozarella cheese processing – 250 local contractors
• Process 567m litres milk which is exported to 50 countries
• Total revenue €434m
• Employ 275 people in Sligo, Roscommon and Donegal
• Subcontract 19 haulage companies for the collection and supply of dairy goods
• Process 500m litres which is exported to 50 countries
• €37m investment in dairy processing capacity
• 34 retail stores
• Total revenue €446m
• Over 2,000 employees
• Collects milk from 17 counties
• Process almost three billion litres from 4,800 milk suppliers
• Milk payments surpassed €1bn in 2019
• Invested over €343 million since 2015 in processing facilities
• 52 agri-branches in Ireland
• Export to over 100 countries
• Annual revenue of €1.9 billion
• Employ over 1,000 people.
• Process 1.85bn litres of milk from 3,200 suppliers.
• Group Revenues (2019) €1.03bn.
• 8 facilities (Food Ingredients, Foodservice, Consumer, Agribusiness)
• Exporting over 200 dairy products to 80+ markets worldwide.
• €550m in milk payments to dairy farmers (2019) across 16 counties
• €185m invested in milk processing capacity since 2015
• Employ 1,300 people across Kerry, Limerick, Clare and North Cork.
• 3000 Milk Suppliers across 6 counties.
• 3 Primary Dairy Manufacturing sites – Listowel, Charleville & Newmarket
• 32 Farm & Home Stores and Compound Feed Mill, Farranfore, Co. Kerry
• €200m invested in Dairy sites since 2013.
• Milk payments exceeded €441m in 2019.
• Process 440 million litres
• Annual revenue of €270m
• Milk payments of €140m
• 420 direct employees
• €63 million investment in past five years
• Process 1.42 billion litres of milk from 2,700 milk suppliers across Munster
• Milk payments of €490m
• Employ 1,150 in Munster
• €450m investment in milk processing
• Group Revenue (2019) €1.02bn
• Employ 2,400 globally
• 12 production facilities and 9 innovation centres
• Owner of Kerrygold, Ireland’s only €1 billion food brand
• 340,000MT of product sold through Ornua’s value-added routes to market in 2019
• Group Revenue of €2.4bnYOUR ASSOCIATION.
YOUR VOICE.
www.ifa.ie
www.ifa.ieYou can also read