PEDESTRIAN SAFETY NHTSA Needs to Decide Whether to Include Pedestrian Safety Tests in Its New Car Assessment Program
←
→
Page content transcription
If your browser does not render page correctly, please read the page content below
United States Government Accountability Office
             Report to the Ranking Member,
             Committee on Environment and Public
             Works, U.S. Senate

             PEDESTRIAN
April 2020

             SAFETY

             NHTSA Needs to
             Decide Whether to
             Include Pedestrian
             Safety Tests in Its
             New Car Assessment
             Program

GAO-20-419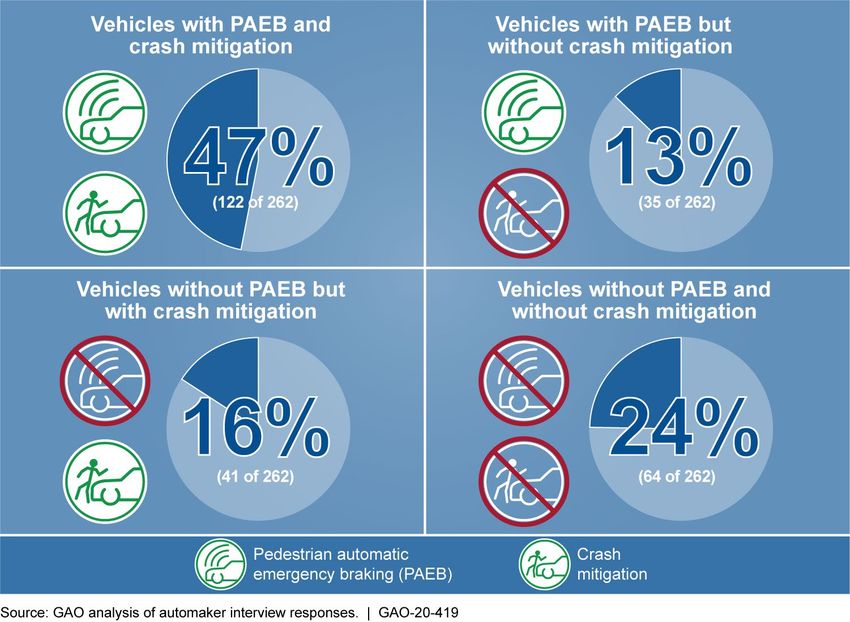
April 2020

                                             PEDESTRIAN SAFETY
                                             NHTSA Needs to Decide Whether to Include
                                             Pedestrian Safety Tests in Its New Car Assessment
                                             Program
Highlights of GAO-20-419, a report to the
Ranking Member, Committee on Environment
and Public Works, U.S. Senate

Why GAO Did This Study                       What GAO Found
In 2018, about 6,300 pedestrians—17          National Highway Traffic Safety Administration (NHTSA) data show that certain
per day—died in collisions with motor        vehicle characteristics related to age, body type, and the speed of the vehicle at
vehicles in the United States, up from       the time of the crash are associated with increases in pedestrian fatalities from
about 4,400 in 2008. Many factors            2008 to 2018. Specifically, the number of pedestrian fatalities during this time
influence pedestrian fatalities, including   period increased more for crashes involving vehicles that were:
driver and pedestrian behavior. Vehicle
characteristics are also a factor. NHTSA     •   11 years old or older compared to newer vehicles,
tests and rates new vehicles for safety      •   sport utility vehicles compared to other passenger vehicles, and
and reports the results to the public        •   traveling over 30 miles per hour compared to vehicles traveling at lower
through its NCAP. Currently, pedestrian          speeds.
safety tests are not included in NCAP.
                                             GAO also found that NHTSA does not consistently collect detailed data on the
This report examines: (1) what is known      type and severity of pedestrian injuries, but began a pilot program in 2018 to
about the relationship between vehicle       improve its data collection efforts. NHTSA, however, lacks an evaluation plan
characteristics and pedestrian fatalities    with criteria to assess whether to expand the pilot program, as called for in
and injuries, (2) approaches automakers      leading practices. As a result, NHTSA lacks information to determine how and
have taken to address pedestrian             whether it should expand the pilot to meet the agency’s data needs.
safety, and (3) actions NHTSA has
taken to assess whether pedestrian           Automakers offer a range of approaches to address pedestrian safety. For
safety tests should be included in           example, pedestrian crash avoidance technologies use cameras or radar to
NCAP. GAO analyzed data on                   detect an imminent crash with a pedestrian and engage a vehicle’s brakes to
pedestrian fatalities and injuries from      avoid a crash. GAO found that about 60 percent of the model year 2019 vehicles
2008 through 2018 (the most recent           offered in the United States by 13 automakers had pedestrian crash avoidance
available data); reviewed NHTSA              technologies as standard or optional equipment.
reports; and interviewed NHTSA
officials. GAO also obtained information     Safety Features on Vehicles Include Pedestrian Detection to Help Avoid Crashes
about pedestrian safety features from 13
automakers that represented about 70
percent of new vehicle sales in the
United States in 2018, and compared
NHTSA’s actions with leading program
management practices.

What GAO Recommends
GAO is recommending that NHTSA (1)
develop an evaluation plan with criteria
for expanding its pilot program, (2) make    In 2015 NHTSA proposed pedestrian safety tests for its New Car Assessment
and communicate a decision about             Program (NCAP), but NHTSA has not decided whether it will include such tests
whether to include pedestrian safety         in the program. NHTSA has reported that crash avoidance technologies could
tests in NCAP, and (3) document the
                                             lead to a decrease in pedestrian fatalities. Nine automakers that GAO
process for making changes to NCAP.
                                             interviewed reported that NHTSA’s lack of communication about pedestrian
The Department of Transportation
concurred with our recommendations.
                                             safety tests creates challenges for new product development. NHTSA has also
                                             not documented a clear process for updating NCAP with milestones for
                                             decisions. NHTSA officials said that updating NCAP involves many actions and
                                             can take years. However, absent a final decision on whether to include
                                             pedestrian safety tests in NCAP and a documented process for making such
View GAO-20-419. For more information-
contact Andrew Von Ah at (202) 512-2834 or
                                             decisions, the public lacks clarity on NHTSA’s efforts to address safety risks.
VonAhA@gao.gov.

                                             ______________________________________ United States Government Accountability Office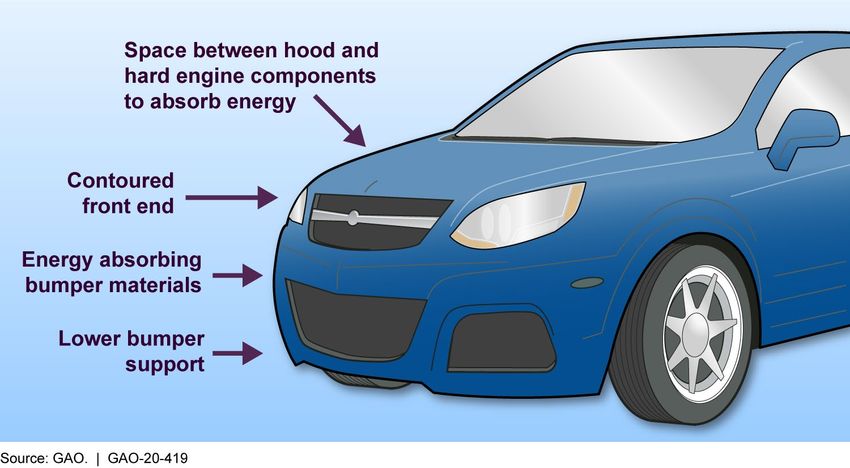
Contents

Letter                                                                                   1
               Background                                                               4
               Vehicle Age, Body Type, and Speed Are Associated with
                 Pedestrian Fatalities, But Gaps Remain in NHTSA’s Pedestrian
                 Injury Data                                                           12
               Automakers Reported That Various Pedestrian Safety Features
                 Are Commonly Available in New Vehicle Models and That All
                 Features Have Benefits and Challenges                                 23
               NHTSA Has Proposed Pedestrian Safety Tests for NCAP, but
                 Lacks a Clear Process for Updating the Program and Has Yet
                 to Make or Communicate a Decision                                     28
               Conclusions                                                             38
               Recommendations                                                         39
               Agency Comments and Our Evaluation                                      40

Appendix I     Objectives, Scope, and Methodology                                      41

Appendix II    Additional Data on Pedestrian Crashes in the United States, 2008
               through 2018                                                            51

Appendix III   Benefits and Challenges of Pedestrian-Motor-Vehicle Safety
               Features                                                                58

Appendix IV    Comments from the U.S. Department of Transportation                     62

Appendix V     GAO Contact and Staff Acknowledgments                                   64

Tables
               Table 1: Number of Pedestrian Fatalities by Body Type of the
                       Vehicle That Struck the Pedestrian, 2008 through 2018           15
               Table 2: List of Automakers Contacted by GAO Study                      46

               Page i                                          GAO-20-419 Pedestrian Safety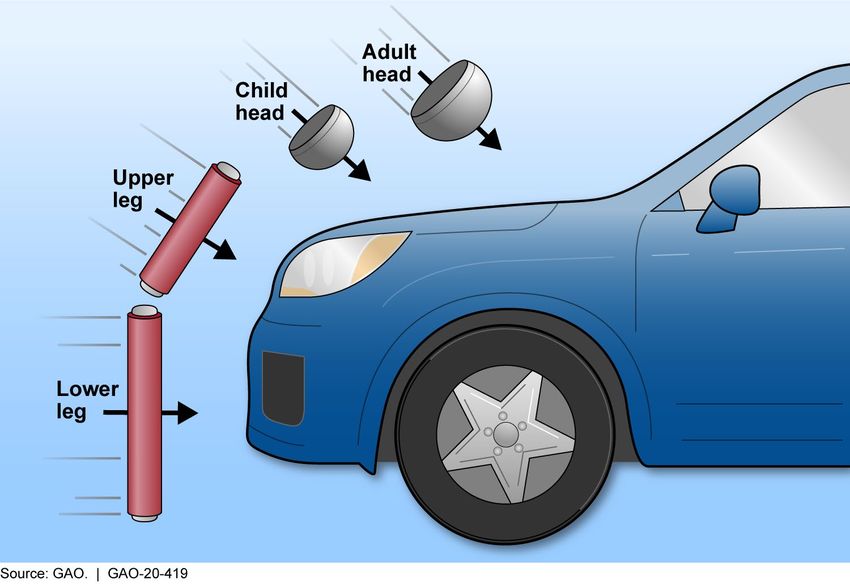
Table 3: List of Auto Equipment Suppliers and Trade Associations
                  Participating in GAO Study                                      48

Figures
          Figure 1: Total Highway and Pedestrian Fatalities and the
                   Percentage of Pedestrian Fatalities to Total Highway
                   Fatalities, 2008 through 2018                                   5
          Figure 2: Example of a Pedestrian Crash Avoidance System                 7
          Figure 3: Examples of Crash Mitigation Vehicle Components for
                   Pedestrian Protection                                           8
          Figure 4: Pedestrian Crash Avoidance Test with Child Running
                   Out From Parked Cars                                           11
          Figure 5: Illustration of Crash Mitigation Tests Designed to
                   Measure Potential Head and Leg Injuries                        12
          Figure 6: Percentage of Pedestrian Fatalities by the Age of
                   Vehicle That Struck the Pedestrian, 2008 through 2018          14
          Figure 7: Number of Pedestrian Fatalities by the Reported Speed
                   of Vehicle That Struck the Pedestrian, 2008 through 2018       17
          Figure 8: Model Year 2019 Vehicles Offering Pedestrian
                   Automatic Emergency Braking or Crash Mitigation
                   Features, as Reported by 13 Automakers                         24
          Figure 9: Model Year 2019 Vehicles Offering Combinations of
                   Pedestrian Automatic Emergency Braking (PAEB) and
                   Crash Mitigation Features, as Reported by 13
                   Automakers                                                     25
          Figure 10: Timeline of Selected NHTSA Actions Related to
                   Pedestrian Safety Tests Since 2008                             29
          Figure 11: Number of Pedestrian Fatalities by Light Condition,
                   2008 though 2018                                               51
          Figure 12: Number of Pedestrian Fatalities by Relation to
                   Intersection, 2008 through 2018                                52
          Figure 13: Number of Pedestrian Fatalities by Body Type of
                   Vehicle That Struck the Pedestrian, 2008 through 2018          53
          Figure 14: Estimated Number of Pedestrians Injured in the United
                   States, 2008 through 2018                                      54
          Figure 15: Estimated Number of Pedestrians Injured by Age of
                   Vehicle That Struck the Pedestrian, 2008 through 2018          55
          Figure 16: Estimated Number of Pedestrians Injured by Body
                   Type of Vehicle That Struck the Pedestrian, 2008 through
                   2018                                                           55

          Page ii                                         GAO-20-419 Pedestrian Safety
Figure 17: Estimated Number of Pedestrians Injured by Reported
        Speed of the Vehicle That Struck the Pedestrian, 2008
        through 2018                                                                      56
Figure 18: Estimated Number of Pedestrians with Suspected
        Serious or Fatal Injuries, 2008 through 2018                                      57

Abbreviations

AAA               American Automobile Association
APA               Administrative Procedure Act
CIREN             Crash Injury Research and Engineering Network
DOT               Department of Transportation
CRSS              Crash Report Sampling System
Euro NCAP         European New Car Assessment Programme
FARS              Fatality Analysis Reporting System
FMVSS             federal motor vehicle safety standards
HLDI              Highway Loss Data Institute
IIHS              Insurance Institute for Highway Safety
JNCAP             Japan New Car Assessment Program
MPH               miles per hour
NASS/GES          National Automotive Sampling System/General Estimates
                  System
NHTSA             National Highway Traffic Safety Administration
NTSB              National Transportation Safety Board
NCAP              New Car Assessment Program
OMB               Office of Management and Budget
PAEB              pedestrian automatic emergency braking
SUV               sport utility vehicle
VIN               vehicle identification number

This is a work of the U.S. government and is not subject to copyright protection in the
United States. The published product may be reproduced and distributed in its entirety
without further permission from GAO. However, because this work may contain
copyrighted images or other material, permission from the copyright holder may be
necessary if you wish to reproduce this material separately.

Page iii                                                     GAO-20-419 Pedestrian Safety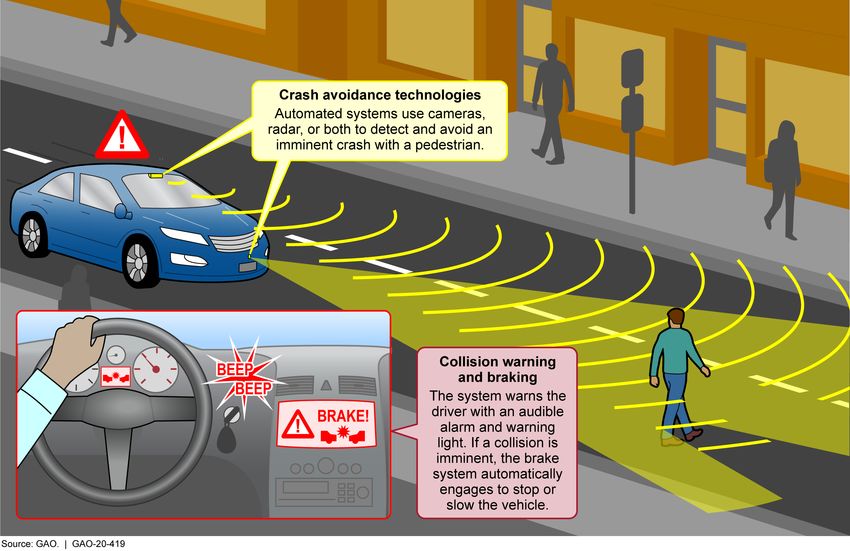
Letter

441 G St. N.W.
Washington, DC 20548

                       April 23, 2020

                       The Honorable Thomas R. Carper
                       Ranking Member
                       Committee on Environment and Public Works
                       United States Senate

                       Dear Senator Carper:

                       The number of pedestrians killed annually in motor vehicle crashes in the
                       United States has increased from about 4,400 in 2008 to almost 6,300 in
                       2018—a roughly 43 percent increase. On average, 17 pedestrians a day
                       died in motor vehicle crashes in 2018, up from 12 a day in 2008. At the
                       same time, overall fatalities on the nation’s roadways have generally been
                       decreasing. Many factors can affect pedestrian fatalities and injuries,
                       including driver and pedestrian behavior, distraction, and roadway and
                       vehicle design. U.S. Department of Transportation (DOT) officials told us
                       vehicle size class is also a contributing factor, and an increasing share of
                       sport utility vehicles (SUVs) in the U.S. vehicle fleet may be responsible
                       for some of the increases in pedestrian fatalities. For example, in May
                       2018 the Insurance Institute for Highway Safety (IIHS), an independent
                       nonprofit scientific and educational organization sponsored by the auto
                       insurance industry, reported that pedestrian fatalities associated with
                       SUVs had increased substantially in recent years and that crashes are
                       increasingly more likely to involve SUVs and higher horsepower
                       vehicles. 1

                       The National Highway Traffic Safety Administration (NHTSA) within DOT
                       is the federal agency responsible for motor vehicle policy, regulation, and
                       safety enforcement. The agency’s mission is to save lives, prevent
                       injuries, and reduce the economic costs associated with road traffic
                       crashes; NHTSA seeks to accomplish this mission through education,
                       research, safety standards, and enforcement activity. NHTSA’s New Car
                       Assessment Program (NCAP) provides consumers with comparative
                       information on the safety of new vehicles to assist in vehicle purchasing

                       1Insurance   Institute for Highway Safety, Status Report: On Foot, At Risk, Vol. 53, No. 3
                       (May 8, 2018). According to IIHS’s Highway Loss Data Institute, an SUV is generally a
                       vehicle built on a heavy duty chassis capable of off-road use, although they may be built
                       on passenger car platforms.

                       Page 1                                                        GAO-20-419 Pedestrian Safety
decisions and NCAP encourages motor vehicle manufacturers to make
vehicle safety improvements through testing and rating of new vehicles.

You asked that we review issues related to pedestrian safety and motor
vehicles. This report: (1) Examines what is known about the relationship
between motor vehicles’ characteristics and pedestrian fatalities and
injuries; (2) Describes approaches automakers have taken to address
pedestrian safety and discusses stakeholder perspectives on these
approaches; and (3) Evaluates actions NHTSA has taken to assess
whether pedestrian safety testing should be incorporated into the NCAP.

To examine what is known about the relationship between motor vehicles’
characteristics and pedestrian fatalities and injuries, we analyzed data
from three NHTSA databases for the period of 2008 through 2018 (the
most recent complete year of data at the time of our review). These
include: (1) Fatality Analysis Reporting System (FARS); (2) Crash Report
Sampling Systems (CRSS); and (3) National Automotive Sampling
System/General Estimates System (NASS/GES). FARS data are derived
from a census of fatal motor vehicle traffic crashes within the 50 states,
Puerto Rico, and the District of Columbia. CRSS is a sample of police-
reported motor vehicle crashes that involve all types of motor vehicles,
pedestrians, and cyclists and that is used to develop national estimates of
the number of injuries associated with motor vehicle crashes, among
other things. NASS/GES preceded CRSS and similarly obtained its data
from a nationally representative probability sample of police accident
reports. Additional information about these databases is included in
appendix I. We interviewed NHTSA officials about pedestrian safety data.
We also interviewed selected academic researchers with expertise in
human-vehicle interaction and selected automakers about pedestrian
safety and data needs. We discuss the selection of automakers below.
We reviewed documents related to a pilot program NHTSA recently
initiated to assess data collection for pedestrian injuries and discussed
this program with NHTSA officials. We assessed this program using
criteria for designing successful pilot programs developed in prior GAO
work. 2

To describe how automakers are addressing pedestrian safety and to
discuss stakeholder perspectives on these approaches, we obtained

2GAO,   Data Act: Section 5 Pilot Design Issues Need to Be Addressed to Meet Goal of
Reducing Recipient Reporting Burden, GAO-16-438 (Washington, D.C.: Apr. 19, 2016).
This report identified five leading practices that, taken together, form a framework for
effective pilot design. We evaluated NHTSA’s pilot program against all five criteria.

Page 2                                                       GAO-20-419 Pedestrian Safety

information from 13 automakers that sold vehicles in the United States.
The 13 automakers represented about 70 percent of new vehicles sold in
the United States in 2018. We used a semi-structured interview format to
obtain information from the 13 automakers about the pedestrian safety
features included on their model year 2019 vehicles sold in the United
States and the benefits and challenges of these features. We did not
assess the effectiveness of these features. Results of these interviews
are not generalizable to the universe of automakers that may sell vehicles
in the United States. We also interviewed representatives of five
companies identified by an auto industry trade association that supply
pedestrian safety related equipment, as well as officials from auto
industry trade associations, and NHTSA. Finally, we reviewed relevant
federal motor vehicle regulations related to pedestrian safety.

To evaluate NHTSA’s actions related to pedestrian safety and NCAP, we
reviewed applicable federal laws and regulations, requests for comments
published in the Federal Register on proposed NCAP changes, 3 and
NHTSA NCAP program documents. We reviewed studies and
presentations on NHTSA’s work related to pedestrian safety, including
potential pedestrian safety tests and their applicability to the U.S. vehicle
fleet, the use of various test tools, and the potential safety effects
associated with technologies intended to avoid crashes with pedestrians.
We also visited NHTSA’s Vehicle Research and Test Center in East
Liberty, Ohio, and the IIHS Vehicle Research Center in Ruckersville,
Virginia, and interviewed NHTSA and IIHS officials, respectively, at those
locations. Further, we interviewed NHTSA officials about NHTSA’s
process for making changes to NCAP and communicating decisions to
stakeholders. We also interviewed the automakers and auto industry
equipment suppliers discussed above, and IIHS officials about
incorporating pedestrian safety tests into NCAP. We evaluated NHTSA’s
process for deciding whether to make changes to NCAP using practices
in the Project Management Institute, Inc., The Standard for Program
Management, and GAO’s Standards for Internal Control in the Federal

3According  to NHTSA officials, although NCAP is not a regulation, NHTSA generally
follows the processes in the Administrative Procedure Act for informal rulemaking to
update NCAP through the notice, comment, and decision process in the Federal Register
for transparency.

Page 3                                                    GAO-20-419 Pedestrian Safety
Government. 4 Appendix I provides a detailed discussion of our scope and
             methodology.

             We conducted our work from February 2019 to April 2020 in accordance
             with generally accepted government auditing standards. Those standards
             require that we plan and perform the audit to obtain sufficient, appropriate
             evidence to provide a reasonable basis for our findings and conclusions
             based on our audit objectives. We believe that the evidence obtained
             provides a reasonable basis for our findings and conclusions based on
             our audit objectives.

             Since 2008, both the number of pedestrian fatalities and the share of
Background   pedestrian fatalities as a percentage of overall highway fatalities have
             increased (see fig. 1). In 2008, pedestrian fatalities represented about 12
             percent of overall highway fatalities, while in 2018 they represented about
             17 percent. In addition to fatalities, the estimated number of pedestrians
             injured in crashes has increased from about 71,000 in 2008 to about
             79,800 in 2018. 5

             4Project Management Institute, Inc., The Standard for Program Management, Fourth
             Edition (2017) and GAO, Standards for Internal Control in the Federal Government,
             GAO-14-704G (Washington, D.C.: Sept. 2014).
             5The 95 percent confidence interval for the estimated number of pedestrians injured in
             crashes is (61,800, 80,300) in 2008 and (65,700, 93,900) in 2018. Additional information
             on the estimated number of pedestrians injured from 2008 through 2018 is in appendix II.

             Page 4                                                      GAO-20-419 Pedestrian Safety
Figure 1: Total Highway and Pedestrian Fatalities and the Percentage of Pedestrian Fatalities to Total Highway Fatalities, 2008
through 2018
A range of factors can influence pedestrian fatalities including exposure of
pedestrians to crashes, roadway characteristics, and driver and
pedestrian behavior. According to DOT officials, there is little nationwide
information about pedestrian exposure to potential crashes and that data
may be more available on the state or local level. Some national data,
however, shows that there may have been some change in people
walking. For example, the U.S. Census Bureau’s American Community
Survey estimated that in 2018, 4 million people reported walking to work
compared with an estimated 3.8 million people in 2010. 6 Regarding
roadways, in 2018 the National Transportation Safety Board (NTSB)
reported that most pedestrian fatalities occur in urban areas on principal
arterial roads that carry high volumes of traffic, traveling at the highest
6The 95 percent confidence interval for the 2018 estimate is (3,540,900, 4,498,800); and
for 2010 is (3,377,500, 4,291,200). The American Community Survey collects information
on social, economic, housing, and demographic characteristics of the nation’s population.
The number of people reported walking to work may be underestimated since the survey
asks respondents to only choose the primary means of how they got to work in the
previous week and does not include recreation or other trips. If a respondent used more
than one means of transportation, they are to select the mode used for most of the
distance and any walking they did would be unaccounted for.
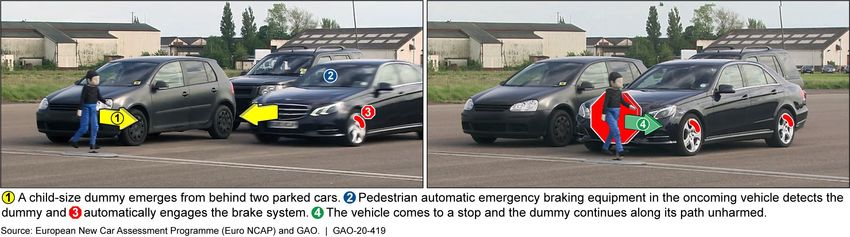
Page 5 GAO-20-419 Pedestrian Safetyspeeds. 7 In 2015, we noted that behavior such as distracted driving, walking, and cycling may contribute to pedestrian and cyclist fatalities. 8 When drivers and pedestrians use cell phones or are otherwise distracted, they may be less aware of their surroundings and more likely to be involved in a crash. 9 Finally, NHTSA data shows that most pedestrian fatalities occurred after dark and at places other than intersections. Specifically, in 2018, of the 6,300 reported fatalities, over 4,700 pedestrians (about 75 percent) were killed after dark and about 4,600 pedestrians (about 73 percent) were killed at non-intersection locations. See appendix II for additional information on pedestrian fatalities from 2008 through 2018. Automakers have developed vehicle features intended to avoid pedestrian crashes and mitigate the extent of injury to pedestrians. Crash avoidance features (also known as “active” safety features) rely on cameras, radar, and other devices to detect a pedestrian and then act to alert a driver to take action, or automatically apply a vehicle’s brakes to slow or stop the vehicle to avoid striking a pedestrian (see fig. 2). One pedestrian crash avoidance system is referred to as pedestrian automatic emergency braking, which uses a camera, radar, or a combination, to automatically apply brakes to avoid a collision. 7NationalTransportation Safety Board, Special Investigation Report: Pedestrian Safety, NTSB/SIR-18/03, PB2018-101632, Notation 58357 (Washington, D.C.: Adopted Sept. 25, 2018). The National Transportation Safety Board is an independent federal agency dedicated to promoting aviation, railroad, highway, marine, and pipeline safety. 8GAO, Pedestrians and Cyclists: Cities, States, and DOT Are Implementing Actions to Improve Safety, GAO-16-66 (Washington, D.C.: Nov. 19, 2015). 9We have recently initiated new work focused on the behaviors of various road users and their influence on pedestrian and cyclist safety that will look at some of these issues and plan to issue that work in 2021. Page 6 GAO-20-419 Pedestrian Safety
Figure 2: Example of a Pedestrian Crash Avoidance System

                                       Crash mitigation features (also known as “passive” safety features)
                                       generally involve the use of pedestrian-friendly vehicle components that
                                       are designed to reduce the severity of injuries should a pedestrian be hit.
                                       Passive safety features can include energy absorbing bumper material,
                                       hoods that provide space between the hood and the hard components in
                                       the engine compartment, and contoured vehicle front-ends intended to
                                       reduce harm to pedestrians (see fig. 3).

                                       Page 7                                             GAO-20-419 Pedestrian Safety
Figure 3: Examples of Crash Mitigation Vehicle Components for Pedestrian
Protection
In executing its mission, NHTSA administers NCAP and issues federal
motor vehicle safety standards (FMVSS) and the federal bumper
standard, among other things. In general, NCAP tests supplement safety
standards established in law or regulation.
• NCAP. Created in 1978, this program tests new vehicles to determine
how well they protect drivers and passengers during a crash (front
and side) and how well vehicles resist rollovers. NHTSA tests and
rates vehicles using a five-star safety rating system with five stars
being the highest safety rating and one star the lowest. NHTSA
communicates the results of its vehicle tests through window labels on
new vehicles and on its website. In 2010, NHTSA also began
recommending various safety technologies for consumers to consider
when purchasing vehicles. Recommended technologies include such
things as forward collision warning (an alert that warns drivers to
brake or steer to avoid a crash if they are too close to a car in front of
them); lane departure warning (an alert that warns drivers of
unintentional lane shifts); and automatic emergency braking, which
can automatically activate a vehicle’s brakes if a driver takes no action
to avoid an imminent crash with a preceding vehicle. NHTSA has not
yet included pedestrian automatic emergency braking systems as
recommended technologies. Recommended technologies are not
included in star ratings, but rather are features NHTSA believes
Page 8 GAO-20-419 Pedestrian Safetyconsumers may wish to look for in new vehicles. Pedestrian safety
tests are not currently part of NCAP.
• FMVSS. These are minimum performance standards established in
regulation for new motor vehicles and items of motor vehicle
equipment. According to NHTSA officials, FMVSS have test
procedures and performance criteria with minimum thresholds for
motor vehicles and motor vehicle equipment, such as minimum light
intensity requirements for headlamps.
• Bumper standard. In addition, while not in the FMVSS, NHTSA’s
bumper standard prescribes performance requirements in regulation
for passenger cars in low-speed front-end and rear collisions. 10
According to NHTSA officials, the bumper standard is intended to
prevent damage to the car body and safety related equipment at
speeds equivalent to a 5 miles-per-hour (mph) crash into a parked
vehicle of the same weight. The standard applies to front and rear
bumpers on passenger cars, but not to other multipurpose passenger
vehicles, such as SUVs, minivans, or pickup trucks. 11
The United States is also involved with pedestrian safety internationally.
In June 1998, the United States signed an international agreement
administered by the United Nations concerning the establishment of
global technical regulations for motor and other wheeled vehicles. 12 The
purpose of the agreement was to establish a global process for jointly
developing technical regulations regarding such things as safety,
environmental protection, and energy efficiency of vehicles. As part of this
agreement, in 2008, Global Technical Regulation No. 9 was established
to improve pedestrian safety by requiring vehicle hoods and bumpers to
absorb energy more efficiently when impacted in a vehicle-to-pedestrian
collision. 13 This international standard has two sets of performance
criteria: head impact requirements that ensure vehicle hoods provide
1049 C.F.R. Part 581. According to NHTSA, the bumper standard applies to front and rear
bumpers on passenger cars to prevent damage to the car body and safety related
equipment at a barrier impact speed of 2.5 miles per hour across the full width of the
bumper and 1.0 mph at the corners.
1149 C.F.R. § 581.3.
12United Nations Economic Commission for Europe, Agreement Concerning the
Establishment of Global Technical Regulations for Wheeled Vehicles, Equipment and
Parts Which Can Be Fitted and/or Be Used on Such Wheeled Vehicles (June 1998).
13United Nations Economic Commission for Europe, Global Technical Regulation Number
9, Pedestrian Safety, ECE/TRANS/180/Add.9 (Nov. 12, 2008).
Page 9 GAO-20-419 Pedestrian Safetyprotection to a pedestrian’s head when impacted; and leg protection requirements for the front bumper that would require bumpers to subject pedestrians to lower impact forces. According to NHTSA, as a signatory to the 1998 agreement, the United States is obligated to consider adopting global technical regulations, but is not obligated to adopt them. NHTSA officials told us the agency has not yet initiated the rulemaking process for Global Technical Regulation No. 9. 14 Although pedestrian safety testing is not currently a part of the U.S. NCAP, it is a part of similarly established new car assessment programs in other countries. For example, since 2016 both the European New Car Assessment Programme (Euro NCAP) and a program in Japan (known as the Japan New Car Assessment Program (JNCAP)) have tested vehicle pedestrian crash avoidance systems using a variety of scenarios and vehicle speeds. 15 Euro NCAP tests include an adult dummy walking or running perpendicular to a test vehicle and walking parallel to a vehicle. Tests are also conducted with a child dummy running out from parked cars (see fig. 4). Euro NCAP tests are also conducted in daylight and at night. In the United States, two nongovernmental organizations have also conducted pedestrian safety testing. IIHS began a program to test pedestrian crash avoidance systems on 2018 and 2019 vehicles, and in 2020 began using the results to help determine its Top Safety Pick awards. The American Automobile Association (AAA) also recently conducted tests of crash avoidance systems. 16 1465 Fed. Reg. 44565 (July 18, 2000). 15Similar to the U.S., both Europe and Japan use a star rating system to indicate test results, with five stars being the highest and one star the lowest. Stars are determined based on points earned on test results. 16AAA is a not-for-profit organization that offers its members with travel, insurance, financial, and automotive services and information. It also advocates for the safety of travelers. Page 10 GAO-20-419 Pedestrian Safety
Figure 4: Pedestrian Crash Avoidance Test with Child Running Out From Parked Cars

                                       Moreover, crash mitigation tests that measure the potential for head and
                                       leg injuries resulting from pedestrian-motor vehicle crashes have been in
                                       place for many years in Europe and Japan. Euro NCAP began head and
                                       leg testing in 1997 and Japan began pedestrian head protection testing in
                                       2003 and pedestrian leg protection testing in 2011. In general, these tests
                                       launch projectiles designed to simulate a person’s legs or head into
                                       various locations on a vehicle’s hood and bumper to assess the
                                       effectiveness in limiting pedestrian injury (see fig. 5).

                                       Page 11                                           GAO-20-419 Pedestrian Safety
Figure 5: Illustration of Crash Mitigation Tests Designed to Measure Potential Head
and Leg Injuries
We found that several vehicle characteristics including the age and body
Vehicle Age, Body type of the vehicle and the speed at which the vehicle was being driven at
Type, and Speed Are the time of the crash are associated with the increase in pedestrian
fatalities from 2008 through 2018. However, NHTSA lacks complete data
Associated with on the relationship between vehicle characteristics and pedestrian
Pedestrian Fatalities, injuries, including detailed information on injury type and severity.
Although NHTSA initiated a pilot program to improve its data collection
But Gaps Remain in protocol for pedestrian injuries, NHTSA lacks a plan for this program to
NHTSA’s Pedestrian evaluate its results and determine whether and how it should be
expanded.
Injury Data
Page 12 GAO-20-419 Pedestrian SafetyThe Number of Reported Through FARS, NHTSA annually collects and analyzes data on all
Pedestrian Fatalities crashes involving pedestrian fatalities, including vehicle-related
characteristics. Based on these data and relevant research, we analyzed
Increased for Crashes
the relationship between pedestrian fatalities and the age, body type, and
Involving Older Vehicles, speed of vehicles. 17 Our analysis of FARS data shows that from 2008
SUVs, and Vehicles through 2018, the number of pedestrian fatalities increased more for
Traveling at Higher crashes involving vehicles that were:
Speeds
• 11 years old or older (123 percent increase) compared with newer
vehicles (9 percent increase);
• SUVs (68 percent increase) compared with other light trucks (25
percent increase), and passenger cars (47 percent increase); and
• traveling at reported speeds 31 mph and above (45 percent increase),
compared to vehicles traveling at lower speeds (28 percent
increase). 18
Vehicle Age The number of pedestrians struck and killed by vehicles 11 years old or
older (older vehicles) increased more relative to the number of
pedestrians struck and killed by vehicles 10 years old or newer (newer
vehicles). In 2008, 1,139 pedestrian fatalities involved older vehicles,
which represented about a quarter (26 percent) of reported pedestrian
fatalities (see fig. 6). By 2018, that number more than doubled to 2,537
pedestrian fatalities, or 40 percent of reported pedestrian fatalities. Over
that same time period, the number of pedestrian fatalities involving newer
vehicles also increased from 2,800 in 2008 to 3,044 in 2018. However,
this increase was less than fatalities involving older vehicles, and the
overall share of pedestrian fatalities involving newer vehicles decreased
from 63 to 48 percent over that period.
17Due to the numerous potential factors involved in motor vehicle crashes, these data
cannot be used to determine the cause of a particular crash or fully explain the rise in
pedestrian fatalities since 2008. Our analysis looked at bivariate relationships between the
number of fatalities and vehicle characteristics. We did not examine which of these factors
or combination of factors contributed most to the rise in pedestrian fatalities.
18Although we recognize that speed can reflect driver’s behavior (e.g. was the driver
exceeding the posted speed limit), we considered speed a physical characteristic of the
vehicle at the time of the crash since speed could influence the severity of pedestrian
injuries.
Page 13 GAO-20-419 Pedestrian SafetyFigure 6: Percentage of Pedestrian Fatalities by the Age of Vehicle That Struck the Pedestrian, 2008 through 2018 The rise in the number of older vehicles involved in pedestrian fatalities may reflect the rise in the average age of vehicles in operation. 19 According to data from DOT’s Bureau of Transportation Statistics, 20 the average age of all vehicles in operation in the United States increased by about 1.5 years from 10.1 years old in 2008 to 11.7 years old in 2018. In comparison, the average age of passenger vehicles that struck and killed pedestrians increased by roughly 2 years from 8.1 years in 2008 to 10 years in 2018. Another possible contributing factor to the increased share of pedestrian fatalities resulting from crashes with older vehicles may be the prevalence of safety features in newer vehicles compared with older vehicles. As discussed below, vehicle manufacturers are offering new 19The term “vehicles in operation” refers to passenger cars, light trucks, SUVs, and vans. 20The Bureau of Transportation Statistics within DOT provides statistics on transportation economics to decision makers and the public. Page 14 GAO-20-419 Pedestrian Safety
vehicles with pedestrian safety features such as pedestrian crash
                    avoidance and crash mitigation systems, which may reduce pedestrian
                    injuries and fatalities.

Vehicle Body Type   The number of pedestrian fatalities where passenger cars, SUVs, or other
                    light trucks were reported as striking vehicles all increased from 2008 to
                    2018 (see table 1). However, the number of SUVs involved in fatal
                    pedestrian crashes increased by a higher percentage than passenger
                    cars and other light trucks. As table 1 shows, pedestrian fatalities
                    involving SUVs increased by about 68 percent, while pedestrian fatalities
                    involving passenger cars increased by 47 percent and light trucks and
                    vans increased by 25 percent. Additionally, although the number of SUVs
                    involved in pedestrian fatalities increased the most in this timeframe,
                    passenger cars still accounted for the largest share of fatalities.

                    Table 1: Number of Pedestrian Fatalities by Body Type of the Vehicle That Struck
                    the Pedestrian, 2008 through 2018

                     Year                                                     Passenger                Sport utility                Light trucks
                                                                                   carsa            vehicles (SUV)b                   and vansc
                     2008                                                             1,800                            729                      1,075
                     2009                                                             1,693                            683                      1,066
                     2010                                                             1,757                            740                      1,083
                     2011                                                             1,859                            752                      1,072
                     2012                                                             2,090                            815                      1,140
                     2013                                                             1,962                            811                      1,161
                     2014                                                             2,055                            850                      1,227
                     2015                                                             2,383                            955                      1,252
                     2016                                                             2,573                         1,149                       1,400
                     2017                                                             2,557                         1,223                       1,331
                     2018                                                             2,651                         1,222                       1,346
                     Total 2008 through 2018                                        23,380                          9,929                      13,153
                     Total Percentage of Passenger                                      50.3                          21.4                       28.3
                     Vehicle Fatalities 2008 through
                     2018
                     Percentage Change in Fatalities                                    47.3                          67.6                       25.2
                     from 2008 to 2018
                    Source: GAO Analysis of National Highway Transportation Safety Administration Fatality Analysis Reporting System Data. |
                    GAO-20-419
                    a
                     For our analysis, we used NHTSA’s classifications for vehicle body types. NHTSA considers
                    passenger cars as light vehicles such as sedans, hatchbacks, coupes, and convertibles that are
                    designed primarily to transport eight or fewer persons.
                    b
                     NHTSA considers SUVs or utility vehicles as multipurpose vehicles with increased ground clearance
                    and strong frames, which are generally designed for carrying persons and off-road capabilities.

                    Page 15                                                                                  GAO-20-419 Pedestrian Safety
c
NHTSA considers light trucks and vans as including light conventional trucks, such as pickup trucks
and other vehicles designed with small passenger cabs, large hoods, and an open cargo area, or
van-based light trucks, such as minivans and other vehicles designed to maximize enclosed cargo
and passenger areas, and other light trucks, which are based on conventional light pickup frames, but
may include commercial or recreational vehicle body features
Data on the growth of SUVs within the U.S. vehicle fleet and academic
research identify potential contributing factors as to why the number of
SUVs involved in pedestrian fatalities increased between 2008 and 2018:
• Increasing SUV market share. SUVs represent a growing share of
the total U.S. vehicle fleet. According to the Highway Loss Data
Institute, 21 the share of new vehicles in the United States that were
SUVs grew from 30 percent in model year 2008 to 48 percent in
model year 2018. In addition, 11 of the 13 auto manufacturers we
interviewed stated that SUV sales, either market-wide or at their
company, increased relative to passenger car sales in the United
States since 2008.
• Increased risk of injuries based on vehicle size and weight.
Research suggests that if a pedestrian is struck by a vehicle with
greater mass the crash is more likely to result in serious injuries or a
fatality than if the pedestrian is struck by a lower-mass vehicle. For
example, one study we reviewed that cited work from five other
studies found that the chief determinants for the severity of injuries in
motor vehicle collisions are vehicle size and weight. 22 According to
one NHTSA-funded study, 23 which used information from NHTSA’s
Pedestrian Crash Data Study, 24 researchers found that the probability
of death for pedestrians struck by light trucks (including SUVs) was
3.4 times higher than for pedestrians struck by passenger cars.
21The Highway Loss Data Institute supports IIHS by studying insurance claim data,
collected from IIHS member organizations, to understand the human and economic losses
resulting from the ownership and operation of different types of vehicles.
22 E. Desapriya, S. Subzwari, D. Sasges, A. Basic, A. Alidina, K. Turcotte, and I. Pike “Do
Light Truck Vehicles (LTV) Impose Greater Risk of Pedestrian Injury Than Passenger
Cars? A Meta-analysis and Systematic Review,” Traffic Injury Prevention, vol. 11, no. 1,
(2010): pp 48-56.
23B.S. Roudsari, C. N. Mock, R. Kaufman, D. Grossman, B. Y. Henary, J. Crandal,
“Pedestrian Crashes: Higher Injury Severity and Mortality Rate for Light Truck Vehicles
Compared with Passenger Vehicles.” Injury Prevention, 2004, vol. 10: pg. 154-158.
24This study was conducted by NHTSA between 1994 and 1998 to collect detailed
pedestrian crash data based on reconstructions of crashes.
Page 16 GAO-20-419 Pedestrian SafetyVehicle Speed Between 2008 and 2018, the number of pedestrian fatalities involving
higher speeds (31 mph and above) at the time of the crash increased
more sharply than the number involving lower speeds (30 mph and
below). Although vehicle speed was missing or not reported for 62
percent of pedestrian fatalities (as discussed below), our analysis of
FARS data showed that when speed data are recorded, the number of
pedestrian fatalities involving vehicles reportedly travelling at higher
speeds increased from 1,315 to 1,912 (45 percent) between 2008 and
2018 (see fig. 7). The number of pedestrian fatalities involving vehicles
reportedly traveling at lower speeds also increased, but at a smaller
percentage (28 percent) than vehicles at higher-speed. During this time
period, about 79 percent of pedestrian fatalities involved vehicles
travelling 31 mph and above, and about 21 percent involved vehicles
traveling at lower speeds.
Figure 7: Number of Pedestrian Fatalities by the Reported Speed of Vehicle That
Struck the Pedestrian, 2008 through 2018
Note: Fatal pedestrian crashes where speed was missing or not reported are not shown in this figure.
Multiple studies have found that when vehicles travel at higher speeds
and strike pedestrians, they are more likely to kill or severely injure the
pedestrian. For example, the NTSB reported in 2018 that the relationship
Page 17 GAO-20-419 Pedestrian Safetybetween speed and the severity of injuries is consistent and direct—
higher crash speeds result in injuries that are more severe. 25 The NTSB
added that the effect of speed is especially critical for pedestrians
because they lack protection. In addition, according to a 2019 report from
the National Cooperative Highway Research Program, a pedestrian’s risk
of fatality is 90 percent when struck by vehicles travelling between 54 and
63 mph compared with a 10 percent risk of fatality between 24 and 33
mph. 26
We also found that between 2008 and 2018, the speed of the striking
vehicle was not reported for about 62 percent of pedestrian fatalities. This
omission is likely because it is difficult for police officers to determine a
vehicle’s speed after a crash occurs. Further, some organizations we
spoke with told us that low speed collisions were typically underreported.
According to NHTSA officials, the speed recorded is generally up to the
discretion of the responding police officer.
NHTSA Lacks Complete NHTSA officials and other stakeholders we interviewed identified
Data on the Relationship limitations in NHTSA’s data on the relationship between vehicle
characteristics and pedestrian injuries. These include (1) incomplete and
between Vehicle
inconsistent injury designations, (2) crash and vehicle information not
Characteristics and linked to medical data, and (3) outdated pedestrian crash investigation
Pedestrian Injuries data.
• Incomplete and inconsistent injury information. Within CRSS,
NHTSA relies on information provided in police reports to determine
national estimates of injured pedestrians. 27 According to NHTSA
officials, data from the police reports are typically after-the-fact
descriptions of events and NHTSA conducts little, or no, follow up
investigations of these reports. As a result, CRSS data may not
include the cause of crashes or pedestrian injuries, and for some
crashes it may be missing detailed information on specific
characteristics of the striking vehicle. In addition, there may be
25National Transportation Safety Board, Special Investigation Report: Pedestrian Safety.
26The National Academies of Sciences, Engineering, and Medicine. Pedestrian Safety
Relative to Traffic-Speed Management (Washington, DC: The National Academies Press,
2019).
27NHTSA officials noted there are other datasets, including the Crash Investigation
Sampling System and National Automotive Sampling System/Crashworthiness Data
System that include pedestrian injury information. However, the officials agreed these
investigation-based datasets are primarily focused on vehicle occupants, not pedestrians.
Page 18 GAO-20-419 Pedestrian Safetyinconsistencies in pedestrian injury information. 28 NHTSA’s injury
severity data rely on reporting from states and localities, which may
define injury severity differently, year-to-year. As we have reported,
NHTSA standardized the injury severity definitions nationally in April
2019; however, it will take time for states to adopt this standard. 29
• Crash and vehicle data are not linked to medical records.
According to NTSB and some researchers we spoke with, the five
point injury severity scale used on police crash reports does not
effectively capture injury severity or actual injury outcomes because
NHTSA does not link crash data with medical and hospital records. 30
Without crash and vehicle information linked to medical records,
researchers cannot crosscheck injury severity designations with
actual injury outcomes or identify specific injury types. NHTSA
previously sponsored a program to help link crash data with injury
data contained in medical records, but federal funding for the program
was discontinued in 2013. 31
• Outdated pedestrian crash investigation data. NHTSA last
collected detailed data on pedestrian crash and injury characteristics
from 1994 to 1998. The Pedestrian Crash Data Study collected
information from over 500 pedestrian crashes, including data on
pedestrian injury types, severity, and potential causation. The study
also reported the vehicle’s type and the part of the vehicle that caused
the injury, such as the front bumper. In its 2018 report, NTSB stated
that while this study was the most complete set of pedestrian crash
data available in the United States, the data are over 20 years old.
NTSB recommended that NHTSA develop a detailed and current
pedestrian crash data set for local and state analysis and to model
and simulate pedestrian collision avoidance systems. As of February
2020, however, NHTSA had not fully implemented the
recommendation. Some automakers and equipment suppliers we
28Police use a 5-point scale, known as the KABCO scale, to designate injuries. These
include fatal (K), serious (A) minor (B), possible (C), or no injury (O).
29GAO, Traffic Safety: Improved Reporting Could Clarify States’ Achievement of Fatality
and Injury Targets, GAO-20-53 (Washington, D.C.: Oct. 22, 2019).
30National Transportation Safety Board, Special Investigation Report: Pedestrian Safety.
31This program, known as the Crash Outcome Data Evaluation System, was a state-
based program sponsored by NHTSA from 1992 to 2013 that used a statistical linkage
process to combine information from crash reports, hospital records, and other sources to
better improve the completeness and accuracy of motor vehicle crash information, as well
as analyze crashes, injury diagnoses, and severity.
Page 19 GAO-20-419 Pedestrian Safetyspoke with noted that improved real world injury data would help them
better develop pedestrian safety features.
NHTSA has recognized that it needs to collect more detailed and
complete data on pedestrian injuries. For example, in a 2011 report to
Congress on the agency’s data gaps, NHTSA noted that internal
stakeholders (those within NHTSA) requested an updated Pedestrian
Crash Data Study with crashes involving late-model-year vehicles and
detailed injury data on the body region impacted rather than the vehicle’s
point of contact. 32 Further, in its 2016 to 2020 strategic plan, NHTSA
stated that it would work to improve the quality, timeliness and relevance
of safety data collected. 33
NHTSA Has Begun a Pilot In 2018, NHTSA initiated a pilot program to evaluate existing and new
Program to Improve Its protocols for collecting pedestrian crash and injury data as part of its
Crash Injury Research and Engineering Network (CIREN). 34 The purpose
Data Collection Protocol
of this pilot program is to develop a data collection protocol and collect
for Pedestrian Injuries, but preliminary data for pedestrian-motor vehicle crashes, including analysis
Lacks a Plan to Evaluate on injury causation. Further, NHTSA stated that it intends to use this
Results protocol and data as the foundation for subsequent pedestrian crash
studies such as research related to injury trends and testing tools.
NHTSA officials also told us that the pilot will help update and build upon
the data collection and analysis protocols for pedestrian-motor vehicle
crashes used in the 1990s in the Pedestrian Crash Data Study. According
to NHTSA officials, the pilot will collect data on nine cases from two
hospitals. A third hospital will provide engineering support. NHTSA
officials stated that they limited the pilot study to nine cases so they would
be able to act quickly on the pilot to determine if a full project was worth
32U.S.Department of Transportation, National Highway Traffic Safety Administration,
Report to Congress: NHTSA’s NASS Data Needs August 2011, DOT HS 811 889.
(February 2014).
33U.S. Department of Transportation, National Highway Traffic Safety Administration, “The
Road Ahead: National Highway Traffic Safety Administration Strategic Plan 2016 – 2020,
DOT HS 812 343 (October 2016).
34According to NHTSA, the CIREN process combines prospective data collection with
professional multidisciplinary analysis of medical and engineering evidence to help
determine injury causation in crash investigations. NHTSA first established CIREN in
1997. The CIREN program primarily focuses on vehicle occupant injuries and is a more in-
depth evaluation of crashes than FARS or CRSS.
Page 20 GAO-20-419 Pedestrian Safetypursuing and to avoid delays. 35 According to NHTSA officials, they expect initial results to be available by fall 2020. We have reported that a well-developed and documented pilot program can help ensure that agency assessments produce information needed to make effective program and policy decisions. 36 Well-designed pilot programs use five leading practices including: 1. establishing clear, appropriate, and measurable objectives; 2. articulating an assessment methodology and data gathering strategy; 3. developing a data analysis and evaluation plan to track pilot performance and implementation; 4. identifying criteria for determining whether and how to scale the pilot and integrate it into overall efforts; and 5. ensuring two-way stakeholder communication through the pilot program. Through our review of the CIREN pedestrian pilot program documentation, we determined that NHTSA met most of the criteria for a well-developed pilot program, but not all. Specifically, NHTSA documented clear, appropriate, and measureable project objectives; identified an assessment methodology and data gathering strategy; developed a data analysis plan; and communicated with stakeholders. NHTSA, however, did not establish an evaluation plan that includes criteria to determine if the pilot program’s data collection and analysis protocol should or could be continued or expanded, once the data have been collected from the nine cases. Although NHTSA officials reported that they had a plan to review and evaluate individual cases, NHTSA does not have an evaluation plan for the pilot program that includes criteria or standards for identifying lessons learned or determining whether the new data collection and analysis procedures would satisfy data needs related to pedestrian’s injuries. 35NHTSA officials told us that, pursuant to the Paperwork Reduction Act of 1995, the agency must undergo a lengthy process to obtain Office of Management and Budget (OMB) approval when interviewing or collecting information from the public for any more than nine cases. See 44 U.S.C. § 3507. 36GAO-16-438. Page 21 GAO-20-419 Pedestrian Safety
NHTSA officials told us that they did not develop an evaluation plan or
criteria for determining the success or scalability of the pedestrian pilot
program because they were not required to create one. 37 They also said
they did not have enough information to tell if the pilot program should be
integrated into overall efforts, although they expect the tools developed by
the pilot to be incorporated into later efforts to increase the number of
pedestrian crashes reviewed under the CIREN program.

Without a documented evaluation plan that includes criteria for
determining whether and how to scale the pilot program, NHTSA will lack
the necessary information to determine if the program should be
expanded to include more cases or whether expanding the program will
fill its current data gaps and future data needs related to pedestrian
injuries and vehicle characteristics. An evaluation plan could help NHTSA
ensure that the data collected fulfills the goal of the pilot program, which
is to build a foundation for subsequent research on pedestrian injury
trends, potential causation, and vehicle design

37According to NHTSA officials, there is no documented NHTSA or DOT guidance on
creating pilot programs or on how they are to be structured.

Page 22                                                 GAO-20-419 Pedestrian Safety
Automakers Reported
That Various
Pedestrian Safety
Features Are
Commonly Available
in New Vehicle
Models and That All
Features Have
Benefits and
Challenges
Most Automakers           Pedestrian crash avoidance and crash mitigation safety features are
Reported Offering         commonly available on many 2019 model year vehicles offered in the
                          United States, according to the 13 automakers we interviewed. As
Pedestrian Crash
                          previously discussed, crash avoidance features rely on cameras or radar
Avoidance or Mitigation   or both to detect a pedestrian and take action to avoid a crash. Crash
Safety Features           mitigation generally involves use of pedestrian-friendly vehicle
                          components (such as energy absorbing bumper components or hoods)
                          that are designed to reduce the severity of injuries should a pedestrian be
                          hit.

                          The 13 automakers we interviewed responded that they, collectively,
                          offered 262 model year 2019 vehicles for sale in the United States. Of
                          those vehicle models, almost 60 percent included pedestrian automatic
                          emergency braking as either a standard or an optional feature (see fig. 8).
                          About 62 percent of their model year 2019 vehicles had some type of
                          standard pedestrian crash mitigation feature. 38 In total, 12 of 13
                          automakers that we interviewed responded that they offered one or more
                          2019 model year vehicles with pedestrian automatic emergency braking
                          as either a standard or optional feature; similarly, 12 of 13 automakers
                          told us they offered crash mitigation features in at least one of their 2019
                          model year vehicles.

                          38In2019, the 13 automakers that we interviewed reported vehicles with crash mitigation
                          features as either standard or not available, as these features were not offered as optional
                          equipment.

                          Page 23                                                       GAO-20-419 Pedestrian Safety
Figure 8: Model Year 2019 Vehicles Offering Pedestrian Automatic Emergency Braking or Crash Mitigation Features, as Reported by 13 Automakers Some stakeholders we interviewed told us that a combination of crash avoidance and crash mitigation features can be effective in minimizing pedestrian injury. For example, NHTSA officials told us that crash avoidance features, such as pedestrian automatic emergency braking can slow a vehicle to a speed where it will be less damaging to a pedestrian once struck, and if the vehicle also has crash mitigation features the impact of the crash can be further mitigated. We found that almost half of 2019 vehicle models had some combination of both pedestrian automatic emergency braking and crash mitigation features. For example, about 47 percent of 2019 vehicle models had pedestrian automatic emergency braking as either standard or optional equipment along with crash mitigation features, such as softer hoods. However, 24 percent of vehicle models had neither of these (see fig. 9). Page 24 GAO-20-419 Pedestrian Safety
Figure 9: Model Year 2019 Vehicles Offering Combinations of Pedestrian Automatic
Emergency Braking (PAEB) and Crash Mitigation Features, as Reported by 13
Automakers

Officials from the 13 automakers we interviewed identified a variety of
factors that influenced their decisions to offer vehicles with pedestrian
safety features in the United States. These include a desire to achieve
high safety ratings for their vehicles, as well as the following:

•   New car assessment programs: New car assessment programs in
    the United States and other countries also influence why automakers
    may offer pedestrian safety features. For example, officials from nine
    of 10 automakers that responded to this question in our interview
    replied that Euro NCAP was a major factor to them in providing
    pedestrian safety features, while seven of 10 automakers responded
    that JNCAP was a major factor. 39 In contrast, three of 11 automakers
    responded that the U.S. NCAP was a major factor in their decisions to

39Not all 13 automakers addressed all of our interview questions. When there were fewer
than 13 respondents, we identify the total number of automakers that responded to that
particular question. For additional information on our methodology, see appendix 1.

Page 25                                                    GAO-20-419 Pedestrian Safety
offer vehicles with pedestrian safety features. As previously
discussed, the United States, unlike the European Union and Japan,
does not incorporate pedestrian safety tests into its NCAP.
• Independent safety testing: Independent safety testing was also a
factor in why automakers may offer pedestrian safety features on
vehicles. For example, officials from five automakers said that they
considered IIHS safety ratings to be a major factor in their company’s
decision to offer pedestrian safety features on vehicles sold in the
United States. 40 As previously discussed, IIHS began testing
pedestrian crash avoidance systems on 2018 and 2019 vehicles.
These tests are known as pedestrian automatic emergency braking
tests and in 2020 IIHS began using the results to help determine their
Top Safety Pick awards. Officials from two automakers said a
company’s goal is to earn an IIHS top safety-pick rating for each of
their models.
• Cost: Cost appeared to be less of a factor influencing whether
pedestrian safety features were offered on vehicles. Officials from
seven of eight automakers who responded to this question replied that
costs either were a minor factor, or did not apply, in their decisions to
offer vehicles with pedestrian safety features. However, officials from
four automakers told us that, in general, while customers want safer
vehicles, automakers have to consider what safety features could be
included without increasing the overall cost. Further, one automaker’s
representative said that as more manufacturers and customers are
buying crash avoidance systems the costs are decreasing.
The future availability of crash avoidance features may depend on several
factors. Specifically, in 2016, 20 automakers voluntarily committed to
making automatic emergency braking systems standard in vehicles sold
in the United States by 2022. Officials from three automakers said that
they planned to incorporate pedestrian automatic emergency braking into
their vehicles’ automatic emergency braking systems as part of this
commitment.
Another factor is customer demand. One automaker said that the number
of models that include pedestrian safety features in the future would
depend on consumer demand or changes in regulation. Officials from
another automaker said their customers often ask for features they see in
40Automakers voluntarily provided this response during our interviews. We did not identify
IIHS as a factor that automakers could identify as a factor in providing pedestrian safety
features in our initial interviews.
Page 26 GAO-20-419 Pedestrian SafetyYou can also read