Information Sciences - Birmingham City University
←
→
Page content transcription
If your browser does not render page correctly, please read the page content below

Information Sciences 625 (2023) 553–577

                                                      Contents lists available at ScienceDirect

                                                       Information Sciences
                                         journal homepage: www.elsevier.com/locate/ins

WhatsUp: An event resolution approach for co-occurring events
in social media
Hansi Hettiarachchi ⇑, Mariam Adedoyin-Olowe, Jagdev Bhogal, Mohamed Medhat Gaber
School of Computing and Digital Technology, Birmingham City University, Birmingham, UK

a r t i c l e        i n f o                         a b s t r a c t

Article history:                                     The rapid growth of social media networks has resulted in the generation of a vast data
Received 10 November 2021                            amount, making it impractical to conduct manual analyses to extract newsworthy events.
Received in revised form 21 November 2022            Thus, automated event detection mechanisms are invaluable to the community. However,
Accepted 1 January 2023
                                                     a clear majority of the available approaches rely only on data statistics without considering
Available online 7 January 2023
                                                     linguistics. A few approaches involved linguistics, only to extract textual event details
                                                     without the corresponding temporal details. Since linguistics define words’ structure and
Keywords:
                                                     meaning, a severe information loss can happen without considering them. Targeting this
Word embedding
Dendrograms
                                                     limitation, we propose a novel method named WhatsUp to detect temporal and fine-
Clustering                                           grained textual event details, using linguistics captured by self-learned word embeddings
Social media                                         and their hierarchical relationships and statistics captured by frequency-based measures.
                                                     We evaluate our approach on recent social media data from two diverse domains and com-
                                                     pare the performance with several state-of-the-art methods. Evaluations cover temporal
                                                     and textual event aspects, and results show that WhatsUp notably outperforms state-of-
                                                     the-art methods. We also analyse the efficiency, revealing that WhatsUp is sufficiently fast
                                                     for (near) real-time detection. Further, the usage of unsupervised learning techniques,
                                                     including self-learned embedding, makes our approach expandable to any language, plat-
                                                     form and domain and provides capabilities to understand data-specific linguistics.
                                                     Ó 2023 The Author(s). Published by Elsevier Inc. This is an open access article under the CC
                                                                                         BY license (http://creativecommons.org/licenses/by/4.0/).

1. Introduction

    Social media services such as Twitter and Facebook generate increasing volumes of data with their growing popularity
[1]. These data contain different information ranging from personal updates and general discussions to breaking news. Also,
social media platforms support fast information dispersal using their large user bases spread around the world [2,3]. There is
also evidence of situations when social media broadcast news faster than traditional news media [4]. The other advantage of
social media data is that they highlight the public opinion [5]. Considering these facts, there is a high tendency at present to
refer to social media data to acquire newsworthy contents [6]. However, due to the vast volume and high dynamicity of data,
it is impractical to analyse them manually to extract important or newsworthy content [7,8]. Therefore, the requirement of
automated intelligent processes for event resolution from social media data is crucial for effective utilisation of data and
information extraction [9]. Such an automated system will be beneficial for multiple parties, including the general public

 ⇑ Corresponding author.
    E-mail address: Hansi.Hettiarachchi@mail.bcu.ac.uk (H. Hettiarachchi).

https://doi.org/10.1016/j.ins.2023.01.001
0020-0255/Ó 2023 The Author(s). Published by Elsevier Inc.
This is an open access article under the CC BY license (http://creativecommons.org/licenses/by/4.0/).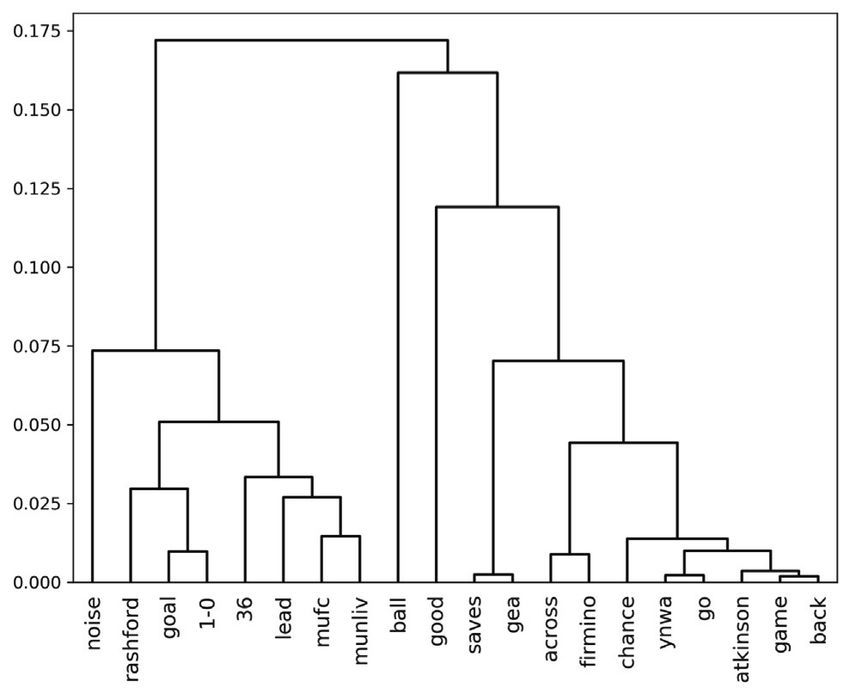
H. Hettiarachchi, M. Adedoyin-Olowe, J. Bhogal et al.                                          Information Sciences 625 (2023) 553–577

to receive interesting event updates, companies to be aware of their product demands or faults and rescue teams to get quick
updates on crises.
    Considering the importance of automated event resolution in social media, various approaches have been proposed by
previous research involving different techniques, as further discussed in Section 2. These approaches can mainly be divided
into three types based on the targeted event output: text, text and time, and time. The text-targeted systems are designed to
identify all topics/events in a given corpus similar to topic modelling [10,11]. The text and time-targeted systems capture
both event text and time by processing a data stream either offline (as a whole) [12] or online (as documents arrive)
[13]. Unlike them, the time-targeted systems are designed as notification systems to notify the event occurred times
[14,8]. Among these different types, we found that the online text and time-targeted systems are more useful in event detec-
tion, considering their informative output and user requirements. Analysing the used approaches to develop such systems,
we noticed that apart from a few notable exceptions, most of the approaches rely only on data statistics without considering
linguistics, specifically semantics. Since semantics describe the connections between words and their meanings, a serious
information loss can happen without considering them. Further analysing the few methods which involved semantics, we
recognised that they also use semantics to extract only the event text. Commonly, these methods used rule-based and
prediction-based approaches to capture semantics. Among them, rule-based approaches (e.g. semantic class extraction
[15], named entity extraction [16]) mainly targeted filtering important terms without focusing on their relationships. Also,
they are less expandable due to language dependencies. The prediction-based approaches mostly used word embeddings
considering their ability in capturing linguistic relationships between words [17,18]. However, to the best of our knowledge,
all the available word embedding-based approaches use pre-trained models incapable of capturing linguistics specific to the
underlying corpus, such as modified or misspelt words. Furthermore, the usage of pre-trained models limits the expandabil-
ity depending on the model availability.
    Focusing on the limitations in available approaches, in this research, we propose a novel method named WhatsUp, which
involves statistics and linguistics to extract both event text and time. Rather than go for fully online processing, we select an
intermediate level. We use the concept of time windows, which processes a set of documents that arrive during a period at
once. Since different domains have different evolution rates, time windows allow the user to customise the system depend-
ing on the targeted domain. To identify event time (windows), we utilised the idea proposed by Embed2Detect [8], consid-
ering its promising results. However, as illustrated in Fig. 1, there is a clear distinction between Embed2Detect and WhatsUp.
Briefly, Embed2Detect targets notifying users about events by recognising event windows, but WhatsUp targets extracting
event windows along with their co-occurred event details. Embed2Detect utilises temporal variations of self-learned word
embeddings and hierarchical clusters to detect event windows. Following this idea, we propose different strategies which
improve the performance of event window identification along with WhatsUp, including an advanced text similarity mea-
sure named Local Dendrogram Level Similarity and a similarity change calculation technique named Positive Similarity Change.
To extract fine-grained event text, we propose a novel clustering algorithm that identifies the co-occurred events in each
event window. For clustering, we involve linguistical features captured using self-learned word embeddings and their hier-
archical relationships in dendrograms and statistical features captured using token frequency-based measures. In summary,
WhatsUp considers all the important features in textual data: statistics and linguistics (syntax and semantics) to detect event
time and text of co-occurred events effectively.1 Also, the usage of self-learned word embeddings allows capturing of the lin-
guistics specific to the underlying corpus. Further, we preserve the universality of our approach by only using unsupervised
learning techniques independent of language, platform and domain.
    We evaluated the proposed approach in two diverse domains, sports and politics using Twitter Event Data 2019 [8]. Con-
sidering the novelty of the event resolution proposed by this research, we designed a comprehensive set of metrics that auto-
matically evaluate temporal and textual event details based on widely used evaluation metrics to measure performance.
According to the comparisons with state-of-the-art methods, our method outperformed all of them with promising event
detection. Further, we analysed the efficiency, and according to the results, our approach is sufficiently fast for (near)
real-time detection.
    Our contributions can be summarised as follows:

1. We propose a novel method named WhatsUp which detects both temporal (event occurred time windows) and fine-
   grained textual (co-occurred event word groups within event windows) event details from social media data streams
   in (near) real-time, considering statistics and linguistics of underlying data.
2. We introduce a localised version of Dendrogram Level (DL) Similarity named Local Dendrogram Level (LDL) Similarity, a
   similarity change calculation technique named Positive Similarity Change and a novel clustering approach along with
   our approach, which can be used as sole components.
3. We utilise self-learned word embeddings and unsupervised learning techniques in WhatsUp to develop a more robust
   event resolution approach, overcoming the limitations: less semantic involvement, inability to capture linguistics of
   underlying data and less expandability to different languages, platforms and domains.

 1
     WhatsUp implementation is publicly available onhttps://github.com/HHansi/WhatsUp.

                                                                        554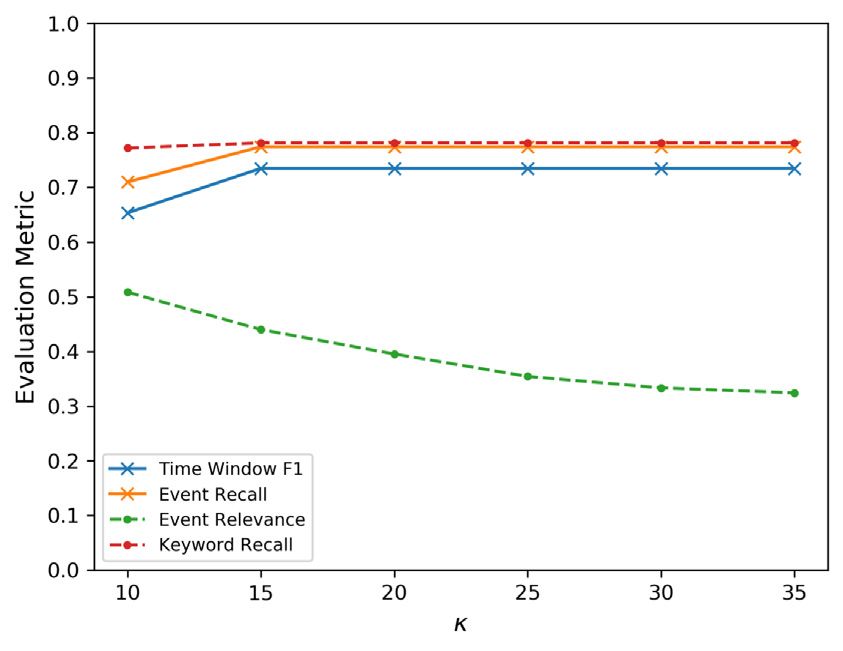
H. Hettiarachchi, M. Adedoyin-Olowe, J. Bhogal et al.                                                         Information Sciences 625 (2023) 553–577

                                                          Fig. 1. Embed2Detect vs WhatsUp.

4. We design a comprehensive set of metrics that automatically evaluate temporal and textual details of detected events
   and release its implementation, aiming to support related evaluations in a unified way.2

The rest of this paper is organised as follows. Section 2 discusses the previous work related to event detection in social
media. Section 3 describes the problem targeted by this research. Section 4 introduces the proposed approach: WhatsUp
for event detection in social media data streams. Section 5 comprehensively describes the conducted experiments and
obtained results. Finally, Section 6 concludes the paper with a discussion.

2. Related work

    Previous research has proposed various approaches for event detection in social media. Online clustering is a commonly
used technique to capture events, including text and time. However, considering some limitations associated with online
clustering, recent research focused more on approaches based on data bursts and dynamics targeting the detection of event
text, time or both. We further discuss these popularly focused areas below. Additionally, a recent survey study [19] can be
referred to for more details about available event detection approaches, including their comparisons.
    Online Clustering: Online/incremental clustering is the process of assigning each document to a cluster as documents
arrive [20]. The generated clusters provide the textual details of events, and the document which initiated the cluster
becomes the first story discussing a novel event that happened at that time. To represent documents during this process,
term and document frequency-based vectors [21,22,16] as well as vectors from word embedding models such as Word2Vec
[18,23] were commonly used. Since word embeddings capture the semantics of the text, they were found to be more effec-
tive than frequency-based vectors [17]. Additionally, different aspects of the events and social media documents were also
involved in the clustering process to improve its effectiveness. [15] suggested using semantic classes (proper noun, hashtag,
location, mention, common noun and verb) of incoming tweets to find the best cluster match considering their informative-
ness towards events. Focusing more on the social aspect, [13] proposed to represent a tweet as a social object, including user,
time and location details in addition to the textual content. However, it is time and space complex to compare a document
with all historic event clusters with increasing data volume. As a solution, a lifespan was defined for clusters so that the inac-
tive clusters can be removed [13,18]. Also, candidate cluster generation methods were suggested to reduce the number of
comparisons at a new document arrival. [15] used semantic term indexing and [16] used entity-cluster inverted indices
to filter candidate clusters. Further, [16] suggested representing clusters using a central centroid calculated only using the
most similar L members of a cluster to faster the cluster update process. However, using rule-based approaches to extract
special entities required for candidate cluster detection negatively affects these approachs’ expandability to other languages.
    Social media data contain personal updates, general discussions, advertisements, etc., except the newsworthy data. Since
online clustering processes all incoming documents, resulting clusters can also hold non-event details. Thus, there was a
focus on processing only the important documents or pruning detected clusters to identify newsworthy events. Following
this insight, bursts in data streams, temporal rule dynamics and community dynamics were commonly used to detect events.
    Bursts: In communication streams, bursts involve the transmission of a larger amount of data than usual over a short
time. We can expect bursts in data streams at events due to the high user involvement in transmitting data. Following this
idea, there was a tendency to detect data bursts and only process the corresponding data to detect events. In this way, more
focus could be provided on possible event data, reducing the processing and improving the performance. For instance, [24]
suggested finding bursty word n-grams at a time slot using temporal document frequency-inverse document frequency and
applying hierarchical clustering on those n-grams to extract event text. However, frequency-based measures fail to differ-
entiate events from general topics (e.g. car, food, music, etc.) because such topics are also discussed massively on social
media. Later research proposed using word acceleration to detect bursts, overcoming this limitation in frequency-based
measures [25]. Also, there was a focus on the social aspect, considering its importance on social networks and impact on
events. [12] suggested using mention anomalies in Twitter data to detect data bursts in an offline manner. They involved
a word co-occurrence and temporal correlation-based approach to extract event text during bursts. Other recent research
suggested an improved version of Twevent [10] considering different user diversity-based measures (i.e. retweet count

 2
     Event Evaluator implementation is available on https://github.com/HHansi/WhatsUp/tree/master/experiments/twitter_event_data_2019/evaluation.

                                                                         555
H. Hettiarachchi, M. Adedoyin-Olowe, J. Bhogal et al.                                         Information Sciences 625 (2023) 553–577

and follower count) to detect bursty text segments in a corpus [11]. They clustered the segments using the Jarvis-Patrick
algorithm to identify event text. Also, this approach used Wikipedia as an external knowledge base to ensure the meaning-
fulness of segments. Overall, the incorporation of the social aspect improved the performance than only involving text
frequency-based measures [12,11]. However, it could limit the expandability of the approach because social aspect measures
are mostly dependent on the underlying social media platform. Similarly, external knowledge bases also introduce restric-
tions depending on their availability and language coverage.
    Pattern Dynamics: Pattern and rule mining discover item sets in data and their relationships. Following this insight, [14]
proposed an approach based on the temporal dynamics of Association Rules (AR) in tweets to detect event occurrences/time.
They used frequent patterns in hashtags to generate ARs and revealed that specific rule types (unexpected and emerging)
have a high impact on identifying event occurrences. Consequently, in later research, there was more focus on High Utility
Pattern Mining (HUPM) because it finds the high in utility item sets [26,27]. When only the frequency is considered, popu-
larly discussed items can also be captured in addition to the event-related items, but the involvement of utility help over-
come this issue. [26] used Local Weighted Linear Regression (LWLR) to calculate term novelty and combined it with term
frequency to measure term utility. They clustered the detected patterns using a graph-based approach to extract event text.
A similar approach is followed by [27], along with a utility calculation based on the growth rate in word frequency. However,
these HUPM-based approaches were designed only to capture textual event details in a given corpus without focusing on
temporal details, adhering to the original scope of pattern mining approaches.
    Community Dynamics: A community is a group of elements that shares common properties. Thus, their temporal varia-
tions over data streams can be utilised to detect events. Following this idea, different approaches based on graph theory,
clustering, and topic modelling were commonly used to identify communities by previous research. [28] suggested gener-
ating keyword graphs per time slot to compare their content similarities at consecutive slots to detect events in each slot.
[29] suggested a similar approach using the communities detected from document graphs. Even though graphs comprehen-
sively capture all the intermediate relationships, they can be dense, increasing the computational complexity for high data
volumes. Involving clustering techniques, [30] hierarchically clustered the posts to identify communities and used a spatio-
temporal similarity of named entities to compare communities. Other recent research used an affinity propagation algorithm
to generate clusters and a non-negative matrix factorisation-based method for comparisons [31]. Following the popularity of
topic models, [32] used Latent Dirichlet Allocation (LDA) to generate communities per time window and analysed their tem-
poral evolution using Jensen-Shannon divergence (JSD). Additionally, they transferred parameters from the previous topic
model to the next model to maintain the online fashion. A similar approach was used by other research, but they used
RL-LDA, a modified version of LDA incorporating the retweeting behaviour [33]. Rather than focusing on temporal or
platform-based modifications to topic models, some research involved advanced community comparison techniques to
improve event detection. [34] suggested comparing topics in consecutive windows using novelty and fading calculated by
LWLR and Kullback–Leibler divergence (KLD). Maintaining simplicity, other recent research suggested using shared topic
words and temporal variations in topic word count to compare topics [35]. Overall, these modifications to the traditional
topic models improved the event detection performance and allowed capturing of the events’ temporal details. However,
we noticed the requirement to pre-define topic count by topic models as a critical limitation when processing highly
dynamic social media data streams.
    In summary, previous research focused on detecting event text, time or both, but comparatively, a high focus is given to
textual details. The majority of the approaches targeted online processing, while a few targeted offline processing. Among
them, online detection of event text and time provides more comprehensive output helpful for real-time information extrac-
tion tasks. To detect event time, available approaches mainly used various statistical measures (e.g. word/document fre-
quency, retweet count, JSD, KLD, etc.) without involving linguistics. However, to extract event text, some approaches
involved linguistics using external knowledge bases, rule-based approaches, and prediction-based approaches. Overall,
the usage of knowledge bases and rules negatively affects the expandability of those approaches. Similarly, using pre-
trained embedding models (prediction-based approaches) adds constraints depending on the model availability and incapa-
bilities to capture corpus-specific linguistics. Considering these limitations, in this research, we target proposing a novel
method capable of online detection of both event text and time, using statistics and linguistics, which are essential for effec-
tive information extraction from textual data.

3. Problem definition

   The problem targeted by this research is automatically detecting temporal and textual event details in (near) real-time
from social media data streams. Various definitions were used by previous research to describe events [28,12,15,8]. Among
them, we consider the Definition 1 [8] because it was designed by combining the main ideas of previous research. The con-
cept behind a data stream is introduced with Definition 2.

Definition 1. Event: An incident or activity which happened at a certain time and discussed or reported significantly in social
media.

                                                              556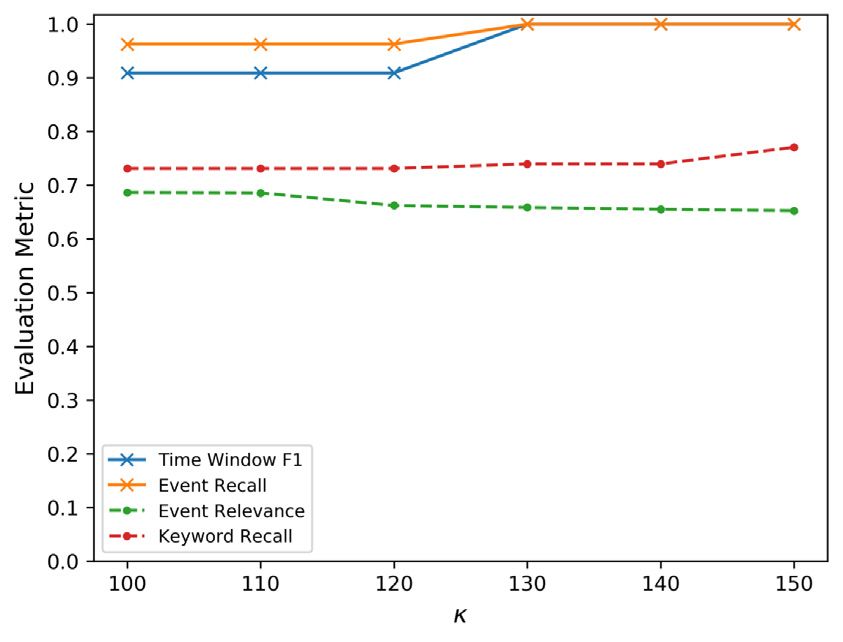
H. Hettiarachchi, M. Adedoyin-Olowe, J. Bhogal et al.                                                                Information Sciences 625 (2023) 553–577

Definition 2. Social Media Data Stream: A continuous and chronological series of posts or documents D:
d1 ; d2 ; . . . di1 ; di ; . . .generated by social media users.
     Available event detection approaches mainly consider two types of input data stream: general and filtered (or focused). In
the general scenario, the whole data stream D is processed [36,16]. In the filtered scenario, a user-centred data stream D0
extracted from the whole data stream D is processed. The filtering was commonly done based on keywords or locations.
In keyword-based filtering, a domain-specific data stream will be extracted using a set of keywords [37,18]. In location-
based filtering, a data stream composed of a set of documents posted by users in a particular location will be extracted
[10,12]. Considering the volume and diversity of the whole data stream and user requirements, processing a filtered data
stream was found to be more useful [37,8]. Among the two filtering techniques, the location-based method could add unnat-
ural restrictions due to the unavailability of locations in all posts or user accounts and the possibility to report an event that
happened at a particular location by a user located elsewhere (e.g. report while travelling or watching television) [8]. Fol-
lowing these findings, this research focuses on a filtered data stream extracted using the keywords. Definition 3 introduces
the concept of the keyword-based filtered data stream.

Definition 3. Filtered Data Stream: A filtered or narrowed down data stream which consists of posts that contain at least one
of the selected keywords.
   To facilitate event time extraction, we use the concept of time windows which is widely used in previous research
[37,14,11,8]. Usage of time windows allows system customisation based on the characteristics of the targeted domain
and intended update rate. Upon the data arrival via a filtered stream D0, data will be separated into time windows W:
W 1 ; W 2 ; . . . W t1 ; W t ; . . .(durations of time) of user-defined length l to assess each window W t to detect the windows W d
when events occurred/event windows (Definition 4).

Definition 4. Event Occurred Time Window/Event Window: Duration of time W t , where at least one event e has occurred.
    To facilitate fine-grained event text extraction, we introduce the concept of co-occurred events (Definition 5), considering
the possibility to happen multiple events during an event window W dt . Per event e that happened during W dt , we focus on
extracting a word/token cluster c, which expresses the event’s textual details.

Definition 5. Co-occurred Events: Multiple events EW d happened/reported within the same time window (event window
                                                                       t

W dt ).
    In summary, the system described in this paper aims to identify event windows W d and token clusters that represent the
co-occurred events within event windows EW d : W dt 2 W d , covering the temporal and fine-grained textual event details by
                                                              t

processing an incoming filtered data stream D0 in (near) real-time. Considering the diversity in events, this system requires
allowing customisations depending on the focused domains and interesting events using hyper-parameters that mainly cap-
ture the details such as event significance, cohesion and update rate. Table 1 shows the list of notations used in this paper.

                                    Table 1
                                    Summary of notations used in the paper.

                                       Notation         Description
                                       d                document/post in a data stream D
                                       D0               filtered data stream
                                       W                time windows during a period
                                       Wd               detected event windows during a period
                                       Wt               window in W at time t
                                       W t1            window in W at time t  1 (previous time window to W t )
                                       w                word/token
                                       c                word/token cluster
                                       e                event
                                       EW t             set of events happened during W t /co-occurred events during W t
                                       Vt               word embeddings/vector space learned from W t
                                       vocab            vocabulary
                                       ft               token frequencies of vocab at time t (v ocabt )
                                       dl               dendrogram level
                                       dlr!x            number of dls from root; r to node; x
                                       dlðwi ;wj Þ      number of shared dls between tokens; wi and wj from root
                                       L                set of leaf nodes in a dendrogram
                                       a                change threshold
                                       b                frequency threshold
                                       s                cluster word similarity
                                       m                cluster word count
                                       g                novelty threshold
                                       j                keyword count
                                       l                time window length

                                                                               557
H. Hettiarachchi, M. Adedoyin-Olowe, J. Bhogal et al.                                                    Information Sciences 625 (2023) 553–577

4. WhatsUp

   WhatsUp, the algorithm proposed by this paper for event detection has three main steps (1) data processing, (2) event
occurred time window identification and (3) event cluster detection. The overall flow is illustrated in Fig. 2. The first step
separates the data stream into time windows and per window, learns word embeddings and extracts statistical information.
The next step identifies event windows. If any window is identified as an event window, the final step detects co-occurred
event clusters in that window. For event window and cluster detection, we use temporal changes in linguistics (syntax and
semantics) captured by self-learned word embeddings and their hierarchical relationships and statistics. To the best of our
knowledge, both linguistical and statistical features have not been involved in previous research to identify event time and
text of co-occurred events together, except for either time or text. Also, since we only involve self-learning and unsupervised
techniques, our approach is generally applicable to any language, platform or domain. However, depending on the charac-
teristics of the targeted events, it requires setting a few hyper-parameters for customisation. Each step is further described in
Sections 4.1–4.3. Finally, Algorithm 4 summarises the top-level idea of WhatsUp, combining all steps.
   To conduct the experiments, we used Twitter Event Data 2019 [8], considering its recency and event coverage. It consists of
two data sets from sports and political domains. The sports data set was based on a football match during the English Pre-
mier League 19/20. We use sample data from this football data set to explain the concepts used to develop our methodology,
only considering the simplicity and cohesion of events in this domain. More details about the data sets are available in
Section 5.1.

4.1. Data processing

   Under data processing, we initially separate the incoming data stream into windows of non-overlapping fixed periods
using the sliding window model [38]. Previous research commonly used window-based approaches considering the high
data volume and requirements to capture temporal details [28,14,27]. Also, the time window length can be adjusted depend-
ing on the evolution of events in the targeted domain.
   Then, we extract each window’s linguistical and statistical details to support event window identification and cluster
detection. To capture linguistics, embedding models are trained per window using their data. This training captures charac-
teristics and expressions unique to each window’s data. While selecting an algorithm to learn embeddings, we mainly
focused on semantic accuracy and efficiency suitable for real-time processing. Considering the semantic accuracy,
transformer-based embeddings (e.g. BERT, XLM-R) showed improved performance in many NLP applications recently
[39–41]. However, they are unsuitable for real-time processing due to the long training time and additional computational
complexities introduced to event detection by contextual word senses [8]. Therefore, we decided to use Word2Vec models
for this research, considering their ability to learn effective embeddings faster. Among Continuous Bag-of-Words (CBOW)
and Skip-gram architectures, the Skip-gram model is selected because it resulted in high semantic accuracy [42,43]. How-
ever, we facilitate the easy integration of any embedding model which fulfils the targeted requirements (i.e. good semantic
accuracy and efficient learning) by developing the word embedding learner as a separate component. As statistical details,
token frequencies at each time window are calculated.

                                                    Fig. 2. Overview of the proposed method – WhatsUp.

                                                                           558
H. Hettiarachchi, M. Adedoyin-Olowe, J. Bhogal et al.                                        Information Sciences 625 (2023) 553–577

4.2. Event window identification

   We utilise the idea proposed with Embed2Detect [8] to identify event windows. Primarily, a time window W t is marked
as an event window if its temporal textual change compared to the previous time window W t1 is above a predefined thresh-
old (a). The final change is calculated by aggregating two measures based on the temporal variations in token clusters and
vocabularies, capturing underlying linguistics and statistics. Any value between 0 and 1 can be picked for a, as normalised
values are involved for change calculation, and it mainly defines the significance of the events targeted by the user. The
higher the value, the more significance it has. Highlighting some limitations recognised in the available approach, we pro-
pose different strategies to calculate cluster similarity, temporal similarity change and vocabulary change to improve the
performance of event window identification in this research, as described in Sections 4.2.1–4.2.3. The overall idea of event
window identification is summarised in Algorithm 1. It processes a chronological stream of time windows (at least two con-
secutive windows W t1 ; W t ) and returns the windows which are recognised as event windows.

  Algorithm 1: Event Window Identification

    Before moving into the calculations, the text needs to be preprocessed for effective results. Under preprocessing, we
mainly targeted removing the uninformative tokens using general procedures which are not strictly dependant on domains
or languages. Punctuation marks and stop words in the text are removed as uninformative tokens. Also, the tokens with low
frequency than a predefined threshold (b) are removed as outlier tokens.

4.2.1. Cluster similarity calculation
   A token cluster-based approach was used to measure text similarity within each window in Embed2Detect. Mainly, token
clusters were targeted because ideas discussed in data streams form word groups, and their variations can be used to recog-
nise newsworthy events. Embed2Detect proposed the measure named Dendrogram Level (DL) similarity to calculate cluster
similarity. As the name depicts, it mainly captures the structural relationships in dendrograms.
   A dendrogram is a tree diagram that illustrates the hierarchical relationships between objects [44]. Sample dendrograms
on selected word sets from tweets posted during the first goal of the football data set are shown in Fig. 3. At the leaf level,
each token is in its own cluster. Horizontal lines, which consider as levels during the DL similarity calculation, represent
merges between clusters that occur considering the distance. Merges between closer clusters happen at low distances
and distant clusters at high distances. To generate dendrograms per window, hierarchical agglomerative clustering (HAC)
was applied to word embeddings. The average scheme was used as the linkage method since it involves all the elements
in clusters during distance calculation. In average linkage, the distance between two clusters C i and C j is measured using
                                                             559
H. Hettiarachchi, M. Adedoyin-Olowe, J. Bhogal et al.                                                          Information Sciences 625 (2023) 553–577

                   Fig. 3. Sample dendrograms (y-coordinate denotes the cosine distance and x-coordinate denotes the selected words).

                               1 X X
        DðC i ; C j Þ ¼                          dðwp ; wq Þ;                                                                                     ð1Þ
                          jC i jjC j j w 2C w 2C
                                    p   i   q   j

where dðwp ; wq Þ represents the distance between cluster elements wp and wq which belong to the clusters C i and C j , respec-
tively [45]. Cosine distance was used for distance calculation, considering its proven effectiveness on textual measurements
[42,43,46] and unbias to word frequency [47].
   Dendrogram Level (DL) similarity: DL similarity between a token pair wi and wj is calculated by normalising the number
of shared levels between those tokens from the root of the dendrogram (Eq. 2).
                                               dlðwi ;wj Þ
        DL Similarityðwi ;wj Þ ¼                                                                                                                  ð2Þ
                                        maxðdlr!x : x 2 LÞ þ 1
   The numerator of Eq. 2 represents the number of shared dendrogram levels between wi and wj from the root. The denom-
inator represents the maximum number of levels between the root and all leaf nodes. Leaf level is also considered while cal-
culating the denominator to make the similarity between the same word equals 1. Words which are not located in nearby
clusters will get a low DL similarity (closer to 0). For example, let us consider the word ‘goal’ and pair it with the player name
who scored the goal ‘rashford’ and some other player name ‘firmino’. If the DL similarities are calculated based on the den-
drogram in Fig. 3a, we will receive the values DL Sim:ðrashford;goalÞ ¼ 3=6 ¼ 0:5, and DL Sim:ðfirmino;goalÞ ¼ 1=6 ¼ 0:167 with a high
similarity between ‘goal’-‘rashford’ than the other pair. To calculate the denominator, dlr!goal (or dlr!10 ) is considered
because this path has the maximum number of dls.
   The main limitation we noticed in DL similarity is it can be distorted when noise is added to the dendrogram. Analysing
from the viewpoint of social media data, it is common to post details about general discussions (or non-event data) during
an event window. Even though we focused on filtered data, within that data also, general discussions can be included. Due
to this distortion, the maximum level count of the dendrogram can be increased, resulting in a high denominator value for
Eq. 2. In such situations, DL similarity becomes incapable of assigning high values to word pairs that are very close. For exam-
ple, dendrogram 2 in Fig. 3b is generated using the same data used for dendrogram 1 in Fig. 3a, but with more words. In den-
drogram 1, we limited the word set to the keywords of events (a) Firmino’s attempt saved by Gea and (b) first goal for
Manchester United FC by Rashford. To generate the dendrogram 2, we included more words such as ‘good’, ‘go’, ‘ynwa’, ‘game’
and ‘back’ which are not event-related directly. These additions change the whole structure of the dendrogram, making it clo-
ser to a real scenario. Now the dendrogram has 10 highest number of levels (dlr!game ). If the similarity values are calculated for
the word pairs used above, we will get the values DL Sim:ðrashford;goalÞ ¼ 4=10 ¼ 0:4, and DL Sim:ðfirmino;goalÞ ¼ 1=10 ¼ 0:1.
   Even though the similarity values can differentiate closer and distant words, we are receiving a very low similarity for the
pair ‘rashford’-‘goal’ even if the tokens are located very closely. This happened due to the noise added to the dendrogram by
non-event words. In reality, since event detection is the final aim of the targeted approach, it is impossible to filter event-
related words beforehand to generate a less noisy dendrogram. To overcome this limitation in DL similarity, we propose a
localised version named Local DL similarity.
   Local Dendrogram Level (LDL) similarity: The main difference in LDL similarity compared to DL similarity is, to calculate
the denominator, it only considers the levels between root and targeted word pair as in Eq. 3. It prevents unnecessary nor-
malisation of the value due to a rare long path in the dendrogram.
                                                                          560
H. Hettiarachchi, M. Adedoyin-Olowe, J. Bhogal et al.                                              Information Sciences 625 (2023) 553–577

                                                   dlðwi ;wj Þ
        LDL Similarityðwi ;wj Þ ¼                                                                                                     ð3Þ
                                    maxðdlr!x     : x 2 fwi ; wj gÞ þ 1
    With LDL similarity, we will receive the values LDL Sim:ðrashford;goalÞ ¼ 3=6 ¼ 0:5, and LDL Sim:ðfirmino;goalÞ ¼ 1=6 ¼ 0:167using
dendrogram 1. For both word pairs, dlr!goal is considered to calculate the denominator value as this path contains the max-
imum number of levels. For dendrogram 2, we will get the values LDL Sim:ðrashford;goalÞ ¼ 4=6 ¼ 0:667, and
LDL Sim:ðfirmino;goalÞ ¼ 1=7 ¼ 0:143. For ‘rashford’-‘goal’, dlr!goal and for ‘firmino’-‘goal’, dlr!firmino are considered to calculate
the denominator values. According to the results, unlike the DL similarity, LDL similarity is capable of calculating effective
values based on nearby clusters even though the dendrogram is noisy. Therefore we use LDL similarity to calculate the clus-
ter similarity between words in this research.
    Summarising the characteristics of DL and LDL similarities, both compute normalised text similarity values within the
range of 0–1, based on structural relationships of a dendrogram. Thus, these measures are relative to the dendrogram or
underlying corpus rather than absolute. They intend to result in a value closer to 1 if a word pair is similar (or closer)
and a value closer to 0 if the pair is distant. However, DL similarity could fail to produce high values for closer words if
the dendrogram is distorted with noise, and we proposed LDL similarity, overcoming this limitation. We provide a summary
which compares these two measures in Table 2. Also, even though we only focus on similarities in this research following our
requirements, both of these metrics can convert to distance measures, similar to cosine similarity, by taking 1  ðLÞDL Sim. In
this way, the number of non-shared levels between the word pair becomes prominent, resulting in the difference/distance
between words. Contrary to similarity measures, values closer to 1 will represent high distances in distance calculations.
    After calculating token similarities, they are formatted into a matrix to support efficient future computations. This sim-
ilarity matrix is a square matrix of size N  N where N is the number of tokens in the vocabulary. Each matrix cell matrix½i; j
represents the cluster similarity between tokens wi and wj . To support matrix comparisons over consecutive time windows,
a common vocabulary is used to generate consecutive matrices matrixt1 and matrixt . Since the change at W t needs to be
calculated compared to the previous window W t1 to detect event occurrences, preprocessed vocabulary at t v ocabt is con-
sidered as the common vocabulary. Following this idea, Embed2Detect used common vocabularies to generate dendrograms
in consecutive time windows. We use the term relative dendrograms to refer to such dendrograms.
    Relative Dendrograms: To generate relative dendrograms for W t and W t1 , preprocessed vocabulary at t v ocabt is con-
sidered as a common vocabulary. Dendrogram for W t is generated using v ocabt and word embeddings learned for W t . Den-
drogram for W t1 is generated using v ocabt and word embeddings learned for W t1 , ignoring the words in v ocabt which are
not found in the vector space V t1 .
    Usage of a common vocabulary can negatively affect the similarity values if v ocabt contains tokens that have a very low
frequency at W t1 . If the embedding model has not seen sufficient occurrences, it may result in vectors that are not properly
learned for those tokens. This could affect the dendrogram structure and result in incorrect similarity values. A few sample
similarity values calculated using relative dendrograms on football data are shown in Table 3. As illustrated in these exam-
ples, relative dendrograms return high similarities for word pairs which are rarely used during time windows. Even though
the selected word pairs are emerging at t according to the ground truth, cluster similarity change between W t and W t1 will
not capture that state using the resulting negative (‘gini’-‘movement’: 0:2807) and small positive (‘goal’-‘1–0’: 0:1308) val-
ues. To overcome this issue, we propose to use non-relative dendrograms.
    Non-Relative Dendrograms: Non-relative dendrogram generation does not use a common vocabulary as relative dendro-
gram generation. Dendrograms for W t1 and W t will be generated using preprocessed vocabularies v ocabt1 and v ocabt ,
respectively. This restricts the involvement of rare words for dendrogram generation, which results in the issue mentioned
above. If non-relative dendrograms are used to calculate the similarities between the word pairs in Table 3, due to low fre-
quency, ‘movement’ and ‘1–0’ will not be included in v ocabt1 and similarity between both word pairs at W t1 will be zero.
For W t , the same similarities will be calculated, and cluster similarity change of both pairs will be large positive values
(‘gini’-‘movement’: 0:6667. ‘goal’-‘1–0’: 0:9) capable of capturing the emerging state of words.

4.2.2. Similarity change calculation
   After calculating token similarities at each time window, their temporal change needs to be measured. The change cal-
culation is mainly based on the diffMatrix which holds the token similarity differences between W t and W t1
(matrixt  matrixt1 ). Embed2Detect used Absolute Similarity Change to calculate the overall similarity change.
   Absolute (Abs.) Similarity Change: Abs. similarity change is calculated as the average of absolute values in diffMatrix fol-
lowing the Eq. 4. Only the values at the upper triangular matrix except the diagonal are considered because the matrix is
symmetric around the diagonal.
                                         X
                                         N X
                                           N
                                                  jdiffMatrix½i; jj
                                         i¼1 j¼iþ1
        Abs: Similarity Change ¼                                                                                                      ð4Þ
                                            ðN  ðN  1ÞÞ=2
   The overall similarity change should be able to differentiate event and non-event windows assigning a greater change to
event windows. An event can suddenly introduce all the event keywords or change an ongoing discussion by introducing a
few new keywords to the data stream [14]. If all the keywords are newly introduced, they will show positive cluster changes
                                                                          561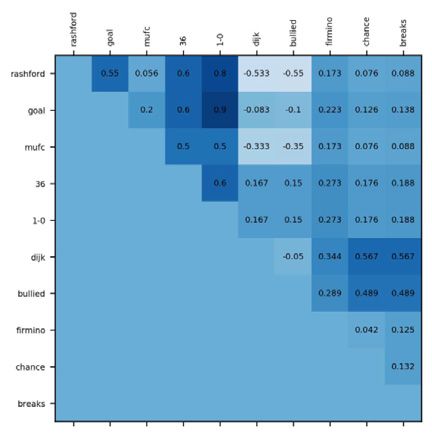
H. Hettiarachchi, M. Adedoyin-Olowe, J. Bhogal et al.                                                                 Information Sciences 625 (2023) 553–577

Table 2
Summary of cluster similarity measures.

  Metric Name                        Properties                           Summary
  DL Similarity                      Reflexive                            Measures word similarity based on structural relationships in a dendrogram.
     (Eq. 2)                         Non-negative                         Con: Prone to the noise in the dendrogram.
                                     Symmetric
  LDL Similarity                     Reflexive                            Measures word similarity based on local structural relationships in a dendrogram.
    (Eq. 3)                          Non-negative                         Pro: Less prone to the noise in the dendrogram with localised calculation.
                                     Symmetric

Table 3
Sample LDL similarity values using relative dendrograms.

  wi                      wj                            f t1 : wi  wj                  f t : wi  wj               LDL sim:t1                  LDL sim:t

  gini                    movement                      10–9                             40–37                       0.9474                       0.6667
  goal                    1–0                           16–2                             339–244                     0.7692                       0.9000

compared to the previous time window. If some high impact happens to an ongoing discussion by an event, newly intro-
duced words will become closer to already existing words, weakening some connections they had previously. Both positive
and negative similarity changes should be expected in such a situation. Also, during a time window when no event happens,
interest in an ongoing discussion can fade, resulting in some negative cluster changes. However, absolute change treats neg-
ative and positive values similarly, even if they contain valuable details of temporal event evolution. This issue can solve sim-
ply by using non-absolute (Non-abs.) changes, but the high availability of general discussions in social media data can
unnecessarily lower the overall non-absolute change. Considering all these facts, we propose a new calculation named Pos-
itive Similarity Change in this research to identify event windows.
    Positive (Pos.) Similarity Change: Under this calculation, a weighted average of positive values in diffMatrix is used to
measure the overall similarity change. As the weight, the proportion of positive values in the upper triangle of the diffMatrix
is used, as illustrated in Algorithm 2. Only the positive values are focused on because positive changes occur when words
become closer at W t than W t1 or word groups appear representing emerging events.

  Algorithm 2: Positive Similarity Change Calculation

   To explain the effectiveness of Pos. similarity change compared to Abs. and Non-abs. changes, we selected a few sample
time windows with event details from the football data set, summarised in Table 4. Fig. 4 shows the diffMatrix generated per
these windows. For simplicity, we only used the important keywords of the selected events to generate matrices. However,
dendrograms generated considering all data of the targeted window are used to calculate cluster similarities, illustrating the
real scenario. At W ta , no important events happened and diffMatrix in Fig. 4a also has low values. At W tb , an emerging event
                                                                                562
H. Hettiarachchi, M. Adedoyin-Olowe, J. Bhogal et al. Information Sciences 625 (2023) 553–577
Table 4
Sample events occurred during English Premier League 19/20 on 20 October 2019 (Manchester
United – Liverpool).
Time window Event Description
16:34–16:36 (W ta ) - No important event reported.
16:52–16:54 (W tb ) Foul Foul by Marcus Rashford (MUFC) on Virgil van Dijk (LFC).
17:06–17:08 (W tc ) Goal First goal by Marcus Rashford (MUFC).
Fig. 4. diffMatrix generated for time windows W ta ; W tb and W tc ).
Table 5
Comparison of similarity change calculation methods.
Calculation Matrix(a) Matrix(b) Matrix(c)
Abs. Similarity Change 0.2005 0.3388 0.2981
Non-abs. Similarity Change 0.1467 0.2786 0.2092
Pos. Similarity Change 0.0269 0.3087 0.2537
happened, and it results in several high positive values in diffMatrix in Fig. 4b. At W tc , an ongoing discussion is altered by an
event, and thus diffMatrix in Fig. 4c has a combination of negative and positive values. Overall similarity changes calculated
for each of these matrices using Abs., Non-Abs. and Pos. calculations are summarised in Table 5.
As can be seen in Table 5, Abs. change returned a high value for W ta even though it has no events. Non-abs. change could
effectively capture the non-existence of events (at W ta ) and suddenly happened events introducing all the keywords (at W tb ),
but it returned a low value when an event altered an ongoing discussion (at W tc ). Pos. change showcased the ability to effec-
tively capture all scenarios with low value at W ta and high values at W tb and W tc . Therefore, we propose to use Pos. similarity
change to calculate overall similarity change.
In summary, Abs., Non-abs. and Pos. change compute an overall value for a matrix within the ranges of 0–1, 1–1 and 0–
1, incorporating different impacts based on their attributes. As we discussed above, for this research, Pos. similarity change
has the best appropriate characteristics because it particularly targets positive values of the diffMatrix, which represent
words that became closer over time. If a large proportion of the diffMatrix have positive values, Pos. change will return a high
value ( 1), indicating a situation where more words become closer due to an event(s). Contrarily, a low value ( 0) means
no events or no notable positive changes happen over time. However, we report a comparison between each measure,
including their pros and cons in Table 6 to highlight their characteristics helpful for other research.
4.2.3. Vocabulary change calculation and aggregation
In addition to the temporal change in token similarity, vocabulary change is also considered to calculate overall change. In
Embed2Detect, vocabulary change is calculated by considering the temporal token variations.
Vocabulary Change (VC): VC is calculated based on consecutive vocabularies v ocabt and v ocabt1 following the Eq. 5.
jw : w 2 v ocabt and w R v ocabt1 j
Vocabulary ChangeðVCÞðt1;tÞ ¼ ð5Þ
jv ocabt j
The numerator of Eq. 5 represents the cardinality of new tokens that appeared in the vocabulary of W t compared to W t1 ,
and the denominator represents the size of the vocabulary of W t . In this research, we propose to involve frequency changes
of tokens in addition to the token variations to calculate vocabulary change. This modification allows focusing on the signif-
icant changes ignoring the slight modifications that happened to the discussions.
563H. Hettiarachchi, M. Adedoyin-Olowe, J. Bhogal et al. Information Sciences 625 (2023) 553–577
Table 6
Summary of similarity change measures.
Metric Name Summary
Abs. Similarity Change Computes a normalised overall value for a matrix, treating both positive and negative values similarly.
(Eq. 4) Con: Unable to distinguish positive and negative values and their proportions.
Non-abs. Similarity Computes a normalised overall value for a matrix, accounting for both positive and negative values.
Change Con: The output gets dominated by the majority sign.
Pos. Similarity Change Computes a normalised overall value for a matrix, focusing on a particular sign (positive).
(Algorithm 2) Pro: Prioritises the focused sign (positive) and reduces the impact by the opposite sign (negative).
Pro: Can be easily customised to focus on the opposite sign (negative).
Frequency Difference-based Vocabulary Change (FDVC): For this calculation, we consider new tokens that appeared at
W t with a frequency difference above the threshold b, which is used to filter outlier tokens (Eq. 6).
jw : w 2 v ocabt ; w R v ocabt1 and f ðwÞt f ðwÞt1 > bj
FDVC ðt1;tÞ ¼ ð6Þ
jv ocabt j
Both VC and FDVC return normalised change values within 0–1. A value closer to 0 indicates that v ocabt1 is almost the
same as v ocabt . If many new tokens are added to the v ocabt , VC will return a high value without considering their signifi-
cance or frequency difference. Thus, this calculation will treat tokens that newly appeared once (mostly due to background
discussions) and multiple times (mostly due to events) similarly. Overcoming this limitation, FDVC only returns high values
if a large proportion of v ocabt holds new tokens with higher frequency differences above a threshold compared to v ocabt1 ,
capturing event occurrences. Thus, we only involve FDVC for the computations in this research. A summary comparing both
measures is available in Table 7.
After calculating the temporal textual change using two measures: similarity change and vocabulary change, these values
need to be aggregated to calculate the overall change. Similar to the Embed2Detect approach, we also consider maximum
and average calculations as aggregation methods to preserve the simplicity of the proposed approach.
4.3. Event cluster detection
After identifying the event windows, the next phase detects co-occurring events/event clusters within those windows to
extract fine-grained event details. Within an event window, one or more events would have been reported, and it is impor-
tant to detect the details of each event separately to let users get quick and concise event updates. For cluster detection, we
propose a novel method which focuses on identifying important keywords to extract clusters using the tokens closer to the
keywords. Basically, our method has two steps: (1) token ranking (identifying important keywords) and (2) cluster genera-
tion, being flexible for easy adjustments for different events. To rank the tokens, we assign a weight to each token consid-
ering its textual similarity change over time, as sudden incidents within data streams result in textual changes. If a token has
a high positive change value, it means that many words became closer to that token over time, indicating that it is an impor-
tant keyword of an event or discussion. Thus, we sort the tokens with positive textual change in descending order to identify
the important event keywords. We only consider the words in the vocabulary for this step, except for emojis and non-
alphanumeric characters, because the target is to rank keywords. We use LDL similarities calculated using word embeddings
and their hierarchical relationships and token frequency-based measures for the weight calculation, capturing underlying
linguistics and statistics as described in Section 4.3.1. Then, token groups are identified using linguistically nearby tokens
to the ranked tokens (i.e. keywords) as such groups represent the ideas discussed together. Similar to the token weighting,
we use LDL similarity between tokens to extract nearby tokens, capturing the linguistical relationships as described in Sec-
tion 4.3.2. Finally, as additional information helpful to users, we occupy each cluster with a novelty measure that indicates
Table 7
Summary of vocabulary change measures. Since these measures are designed to compute vocabulary change of consecutive time windows, the reflexive
property is not applicable to them.
Metric Name Properties Summary
VC Non-negative Measures vocabulary change over time.
(Eq. 5) Non-symmetric Con: Incorporates significant and insignificant changes with the final value.
FDVC Non-negative Measures vocabulary change over time only targeting significant changes.
(Eq. 6) Non-symmetric Pro: Allows to customise the targeted significance of changes by setting a threshold.
564H. Hettiarachchi, M. Adedoyin-Olowe, J. Bhogal et al. Information Sciences 625 (2023) 553–577
the cluster’s newness or newsworthiness. After detecting the clusters, we prune them to filter emerging events as described
in Section 4.3.3. The overview of our event cluster detection approach is illustrated in Algorithm 3.
Algorithm 3: Event Cluster Detection
Unlike the majority of previous research, we propose clustering tokens (not documents). As tokens, we use both words
and emojis as emojis play a crucial role in expressing public opinions on social media nowadays. When the token level is
considered, multiple events described in a document can be separated, and connections between tokens that do not appear
together in documents can be captured. Due to the recent increments made to character limits by social media services, a
single document can contain multiple events. Also, due to the diversity of users, the same event can be expressed differently
in multiple documents requiring capturing token relationships to get complete event information. Further, our algorithm has
advantages compared to the traditional clustering algorithms. Unlike flat clustering algorithms (e.g. K-means), our algorithm
does not require the cluster count to be predefined, which is unpredictable due to the dynamicity of data streams. Unlike
hierarchical algorithms (e.g. hierarchical agglomerative, hierarchical divisive), our algorithm is capable of assigning the same
token to multiple clusters. In reality, there can be situations when the same token is shared among multiple events (e.g. ‘goal’
is shared between events: team MUFC scored a goal and VAR for the goal is in progress).
4.3.1. Token weight calculation
To rank tokens, we assign weights to them based on their temporal textual change. We experiment with the following
weight calculations in this research. To make the similarity-based computations faster, we use the diffMatrix generated dur-
ing event window identification (Algorithm 1) as a row of the matrix diffMatrix½w contains the values
fLDLðw;wi Þ : wi 2 v ocabt g.
1. Pairwise Similarity Difference (PSD): The highest similarity difference of the token pairs which contain the targeted
token.
PSDw ¼ maxðLDL sim:ðw;wi Þ : wi 2 v ocabt Þ
565H. Hettiarachchi, M. Adedoyin-Olowe, J. Bhogal et al. Information Sciences 625 (2023) 553–577
2. Average Similarity Difference (ASD): Average similarity difference of all token pairs which contain the targeted token. To
calculate the average, we use the positive similarity change calculation proposed in Algorithm 2 considering its effective-
ness. In the above, we showed how this calculation could be used for a matrix (Algorithm 2), but similarly, it can also be
used with a row of the matrix (similarities between all token pairs which contain the targeted token).
positiv eValues ¼ fLDL sim:ðw;wi Þ : wi 2 v ocabt and LDL sim:ðw;wi Þ > 0g
P
positiv eValues v eValuesj
ASDw ¼ jpositiv eValuesj jpositi
jv ocabt j
3. Frequency Difference (FD): Normalised frequency difference of the targeted token.
f ðwÞt f ðwÞt1
FDw ¼
maxðf ðwÞt ; f ðwÞt1 Þ
4. Average Aggregations (AVG-*-FD): Average of similarity-based value and FD. Since there are two similarity-based mea-
sures, average aggregation also returns two measures AVG-PSD-FD and AVG-ASD-FD.
5. Maximum Aggregations (MAX-*-FD): Maximum of similarity-based value and FD. Similar to the average aggregation,
this also has two measures MAX-PSD-FD and MAX-ASD-FD.
According to the experiment results described in Section 5.3.2, we found that AVG-ASD-FD outperforms the other weight
measures.
4.3.2. Cluster generation
We propose to generate clusters by extracting tokens linguistically closer to the top-ranked keywords. To measure the
similarities between tokens, we use LDL similarity computed using dendrograms generated on self-learned word embed-
dings since it incorporates the token relationships in the vector space and the hierarchical structure, capturing the underly-
ing linguistics. Additionally, we require a threshold to extract nearby words, and we consider two threshold types as follows.
1. Similarity-based Threshold(s): Consider all tokens with similarity P s as nearby words. This is similar to the similarity
thresholds used by hierarchical and online clustering algorithms.
2. Count-based Threshold(m): Consider m most similar tokens as nearby words.
We conducted experiments using both thresholds and revealed that they have different qualities which are helpful for
users depending on their interests and domains specificities as described in Section 5.3.2.
After identifying the clusters, we assign a novelty measure for each cluster to improve its informativeness. The novelty of
cluster c is calculated as the average of token weights belonging to it (Eq. 7). Overall, it measures the temporal textual change
of that cluster compared to the previous time window and indicates the event significance.
P
weightw : w 2 c
Nov eltyc ¼ ð7Þ
jcj
4.3.3. Cluster pruning
Since detected clusters can hold emerging events and background discussions, they need to be pruned to extract events.
The commonly used approach is to assign clusters a value that indicates their importance and filter out the less important
clusters using a threshold [15,13,11]. Following this idea, we also suggest pruning clusters using a threshold for cluster nov-
elty (g). Nonetheless, such a threshold highly depends on the underlying data. Thus, even within the same domain, using a
static value for multiple time windows will be incorrect if the nature of data and their evolution are different in those time
windows. Also, due to the dynamicity and diversity of events, it will be hard to pick such a threshold value by analysing pre-
vious data and heuristics.
Considering all these drawbacks, we propose a keyword count-based technique to prune clusters. Rather than pruning the
generated clusters, this approach limits the non-event cluster generation. Given a count j, this will only take the top j key-
words in the ranked tokens to use with the cluster generation step in Algorithm 3. Knowing the data and possible event gen-
eration rates, j can be defined, and it does not strictly depend on other factors as a novelty-based threshold.
566You can also read