Mobility on Demand (MOD) Sandbox Demonstration: Dallas Area Rapid Transit (DART) First and Last Mile Solution - Federal ...
←
→
Page content transcription
If your browser does not render page correctly, please read the page content below
Mobility on Demand (MOD)
         Sandbox Demonstration:
Dallas Area Rapid Transit (DART)
      First and Last Mile Solution
                    Evaluation Report
                                 JUNE 2021

                                 FTA Report No. 0195
                        Federal Transit Administration

                                       PREPARED BY

                                 Elliot Martin, Ph.D.
                                       Adam Stocker
                                        Adam Cohen
                               Susan Shaheen, Ph.D.
                         Transportation Sustainability
                                    Research Center
                                        University of
                                 California, Berkeley

                                           Les Brown
                                                  ICF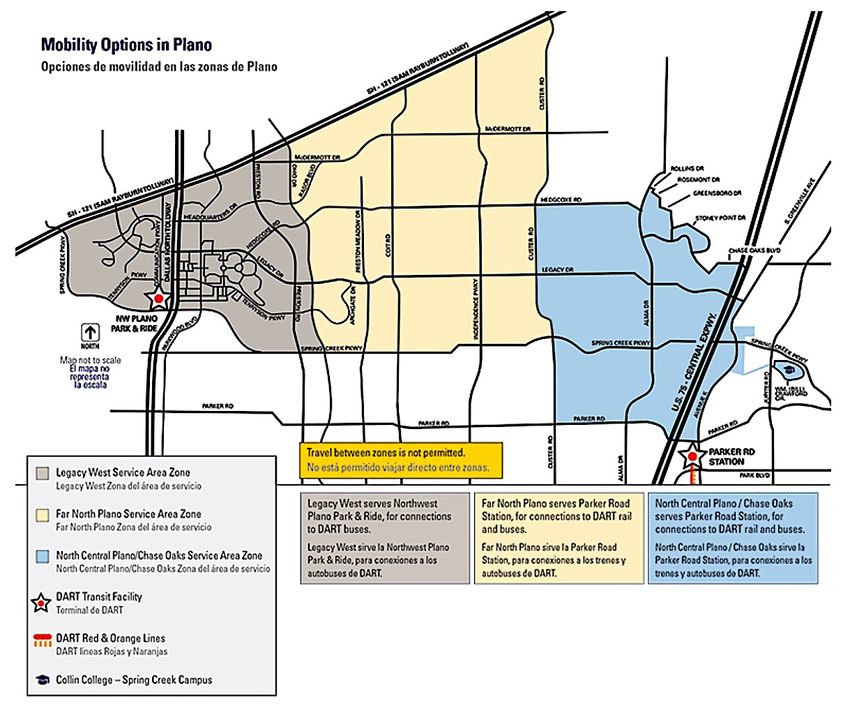
COVER PHOTO
Courtesy of The Dallas Morning News.

DISCLAIMER
This document is disseminated under the sponsorship of the U.S. Department of Transportation in the interest of information
exchange. The United States Government assumes no liability for its contents or use thereof. The United States Government
does not endorse products or manufacturers. Trade or manufacturers’ names appear herein solely because they are considered
essential to the objective of this report. The opinions and/or recommendations expressed herein do not necessarily reflect those
of the U.S. Department of Transportation.

Mobility on
Demand (MOD)
Sandbox
Demonstration:
Dallas Area Rapid
Transit (DART)
First and Last
Mile Solution
Evaluation Report
JUNE 2021
FTA Report No. 0195
PREPARED BY

Elliot Martin, Ph.D.
Adam Stocker
Adam Cohen
Susan Shaheen, Ph.D.
Transportation Sustainability Research Center
University of California, Berkeley
2150 Allston Way, #280
Berkeley, CA 94704
Les Brown
ICF
9300 Lee Highway
Fairfax, VA 22031
SPONSORED BY

Federal Transit Administration
Office of Research, Demonstration and Innovation
U.S. Department of Transportation
1200 New Jersey Avenue, SE
Washington, DC 20590

AVAIL ABLE ONLINE

https://www.transit.dot.gov/about/research-innovation

                 FEDERAL TRANSIT ADMINISTRATION         i
            FEDERAL TRANSIT ADMINISTRATION              i
Metric Conversion Table

SYMBOL    WHEN YOU KNOW              MULTIPLY BY              TO FIND              SYMBOL

                                      LENGTH

  in            inches                    25.4                millimeters            mm

  ft              feet                   0.305                  meters                m

  yd             yards                   0.914                  meters                m

  mi             miles                    1.61                kilometers             km

                                      VOLUME

 fl oz        fluid ounces               29.57                 milliliters           mL

 gal            gallons                  3.785                    liter                   L

  ft3          cubic feet                0.028               cubic meters             m3

 yd3          cubic yards                0.765               cubic meters             m3

                NOTE: volumes greater than 1000 L shall be shown in m3

                                        MASS

  oz            ounces                   28.35                  grams                 g

  lb            pounds                   0.454                kilograms               kg

                                                              megagrams
  T       short tons (2000 lb)           0.907                                    Mg (or “t”)
                                                           (or “metric ton”)

                             TEMPERATURE (exact degrees)

  o                                    5 (F-32)/9                                     o
      F       Fahrenheit                                        Celsius                   C
                                      or (F-32)/1.8

                                                                   FEDERAL TRANSIT ADMINISTRATION    i
                                                              FEDERAL TRANSIT ADMINISTRATION        ii
1.                                                                                                                         Form Approved
                          REPORT DOCUMENTATION PAGE                                                                        OMB No. 0704-0188
The public reporting burden for this collection of information is estimated to average 1 hour per response, including the time for reviewing instruc-
tions, searching existing data sources, gathering and maintaining the data needed, and completing and reviewing the collection of information. Send
comments regarding this burden estimate or any other aspect of this collection of information, including suggestions for reducing the burden, to
Department of Defense, Washington Headquarters Services, Directorate for Information Operations and Reports (0704-0188), 1215 Jefferson Davis
Highway, Suite 1204, Arlington, VA 22202-4302. Respondents should be aware that notwithstanding any other provision of law, no person shall be
subject to any penalty for failing to comply with a collection of information if it does not display a currently valid OMB control number.

1. REPORT DATE                                2. REPORT TYPE                                                 3. DATES COVERED
   June 2021                                     Evaluation                                                    February 2018–April 2019

4. TITLE AND SUBTITLE                                                                                       5a. CONTRACT NUMBER
   Mobility on Demand (MOD) Sandbox Demonstration: Dallas Area Rapid Transit (DART)
   First and Last Mile Solution Evaluation Report
                                                                                                            5b. GRANT NUMBER

                                                                                                             5c. PROGRAM ELEMENT NUMBER

6. AUTHOR(S)                                                                                                 5d. PROGRAM NUMBER
   Elliot Martin, Adam Stocker, Adam Cohen, Susan Shaheen, Les Brown                                        5e. TASK NUMBER

                                                                                                            5f. WORK UNIT NUMBER

7. PERFORMING ORGANIZATION NAME(S) AND ADDRESSE(ES)                                                         8. PERFORMING ORGANIZATION REPORT
                                                                                                               NUMBER
   Transportation Sustainability Research Center (TSRC), University of California, Berkeley,
                                                                                                               FTA Report No. 0195
   2150 Allston Way, #280, Berkeley, CA 94704
   ICF, 9300 Lee Highway, Fairfax, VA 22031

9. SPONSORING/MONITORING AGENCY NAME(S) AND ADDRESS(ES)                                                     10. SPONSOR/MONITOR'S ACRONYM(S)
                                                                                                                FTA
  U.S. Department of Transportation                             US Department of Transportation
  Federal Transit Administration                                Office of the Assistant Secretary           11. SPONSOR/MONITOR'S REPORT NUMBER(S)
  Office of Research, Demonstration and Innovation                 for Research and Technology
  1200 New Jersey Avenue, SE,                                   Intelligent Transportation Systems
  Washington, DC 20590                                             Joint Program Office (ITS JPO)
                                                                1200 New Jersey Ave., SE
                                                                Washington, DC 20590

12 . DISTRIBUTION/AVAILABILITY STATEMENT
    Available from: National Technical Information Service (NTIS), Springfield, VA 22161; (703) 605-6000, Fax (703) 605-6900,
    email [orders@ntis.gov]; Distribution Code TRI-30

13. SUPPLEMENTARY NOTES NOTES [www.transit.dot.gov/about/research-innovation] [https://doi.org/10.21949/1520681] Suggested citation:
    Federal Transit Administration. Mobility on Demand (MOD) Sandbox Demonstration: Dallas Area Rapid Transit (DART) First and Last Mile Solution
    Evaluation Report. Washington, D.C.: United States Department of Transportation, 2021. https://doi.org/10.21949/1520681.

14. ABSTRACT
    The Mobility on Demand (MOD) Sandbox Demonstration Program provides a venue through which integrated MOD concepts and strategies,
    supported through local partnerships, are demonstrated in real-world settings. For the 11 MOD Sandbox Demonstration projects, an indepen-
    dent evaluation was conducted that includes an analysis of project impacts from performance measures provided by the project partners and an
    assessment of the business models used. This document presents the results from the independent evaluation of the Dallas Area Rapid Transit
    (DART) First and Last Mile Solution MOD Sandbox Demonstration project. Evaluated were hypotheses that explored project impacts on travel
    behavior, user experiences, first and last mile to public transit accessibility, service quality for passengers with disabilities, and costs. The project
    improved first and last mile connectivity to DART transit, increased satisfaction among DART transit users, enhanced service for passengers with
    disabilities, and increased the geographic scope of DART transit service in the Plano area. In addition, wait and travel times for passengers with
    and without disabilities reflected similar distributions. The subsidy per rider of GoLink services was lower than the low-ridership fixed-route transit
    services that it replaced in Plano, but it was not lower than the subsidy for DART fixed-route transit in the overall Dallas region. DART project team
    members were interviewed to better understand challenges, barriers, successes, and broader lessons learned from the project, representing
    agency personnel from the offices of Innovation, Service Planning, Scheduling, Paratransit Operations, and Marketing. Lessons learned revealed
    the importance of having pre-planned, ready-to-go projects with committed partners, flexible contracting terms, metrics for adjusting spatial and
    temporal service coverage (including terminating service if appropriate), vehicle right-sizing, and understanding customer needs.

 15. SUBJECT TERMS: Mobility on Demand, MOD, sandbox, shared mobility, mobility as a service, independent evaluation, public transit, first and last mile,
                    microtransit, transportation network companies, TNC

 16. SECURITY CLASSIFICATION OF:                                17. LIMITATION OF       18. NUMBER       19a. NAME OF RESPONSIBLE PERSON
                                                                   ABSTRACT                OF PAGES
 a. REPORT               b. ABSTRACT         c. THIS PAGE                                  85
    Unclassified            Unclassified        Unclassified                                             19b. TELEPHONE NUMBER

                                                                                                                                         Standard Form 298 (Rev. 8/98)
                                                                                                                                         Prescribed by ANSI Std. Z39.18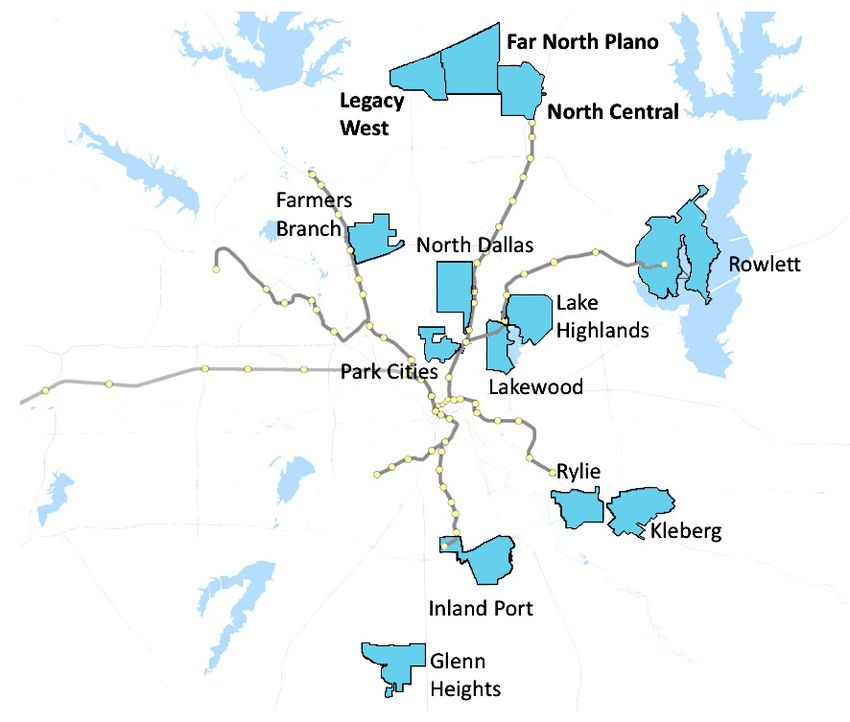
TABLE OF CONTENTS

         1    Executive Summary
         9    Section 1: Introduction
        12    Section 2: DART MOD Sandbox Project Summary
        18    Section 3: Evaluation Approach, Planning, and Execution
        53    Section 4: Lessons Learned from Project Partners
        59    Section 5: Conclusions
        61    Appendix

                                           FEDERAL TRANSIT ADMINISTRATION   iv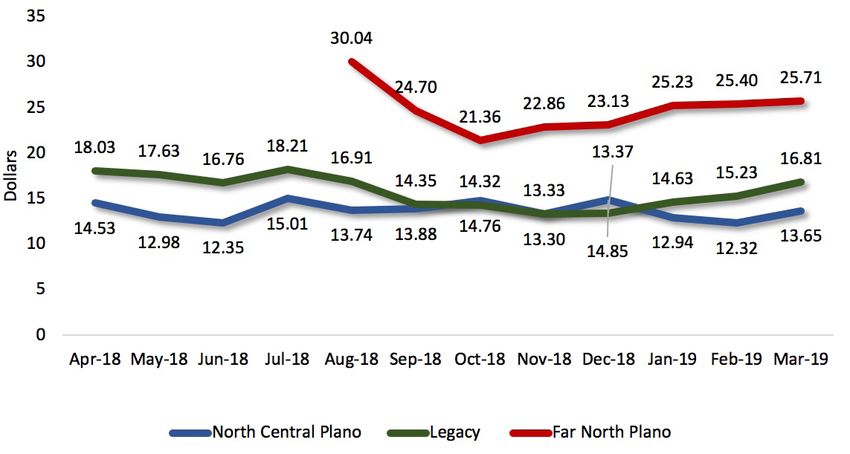
LIST OF FIGURES

         12       Figure   2-1:  DART light rail system map 2019
         15       Figure   2-2:  DART GoLink zones as of March 2019
         16       Figure   2-3:  DART Plano GoLink zones as of October 2019
         23       Figure   3-1:  Mode substitution as a result of GoLink among those connected
                                 to another DART mode
         25       Figure   3-2: Mode substitution as a result of GoLink
         26       Figure   3-3: Access to DART bus stops, transit centers, and light rail stations
                                 by travelers who use mobility aids
         26       Figure   3-4: Access to DART’s overall bus and rail system by travelers who use
                                 mobility aids
         28       Figure   3-5: Difference between DART GoLink Travel Time and Fixed Transit
                                 Route by Month (WAV Trips)
         29       Figure   3-6: Difference between DART GoLink travel time and fixed transit
                                 route by month (WAV trips)
         31       Figure   3-7: Distribution of GoLink trip distance
         32       Figure   3-8: Ratings for ease of use with GoPass in trip planning, scheduling
                                 service, and fare payment
         33       Figure   3-9: Ratings for information accuracy with GoPass in trip planning,
                                 scheduling service, and fare payment
         33       Figure   3-10: Ratings for overall experience with GoPass in trip planning,
                                 scheduling service, and fare payment
         34       Figure   3-11: Ratings for approximate in-vehicle travel time with GoLink shuttle
                                 (N = 230)
         35       Figure   3-12: Ratings for approximate in-vehicle travel time with GoLink since
                                 UberPool available (N = 171)
         36       Figure   3-13: Average travel times by zone for all GoLink trips
         37       Figure   3-14: Average travel times of GoLink and UberPool options (all Plano
                                 zones)
         38       Figure   3-15: Average total trip time comparisons for GoLink, driving, and
                                 public transit (all trips)
         39       Figure   3-16: Average DART GoLink travel time by month for FMLM trips
         39       Figure   3-17: Ratings for access to DART bus stops, transit centers, and light
                                 rail stations
         40       Figure   3-18: Average total trip time comparisons for GoLink, driving, and
                                 public transit (FMLM trips)
         41       Figure   3-19: DART transit Plano coverage area before March 2017
         42       Figure   3-20: DART transit Plano coverage area as of May 2019
         42       Figure   3-21: Ratings for ability to get to areas within GoLink zone (N = 235)
         42       Figure   3-22: Ratings for ability to get to areas within GoLink zone since
                                 availability of UberPool

                                                         FEDERAL TRANSIT ADMINISTRATION          v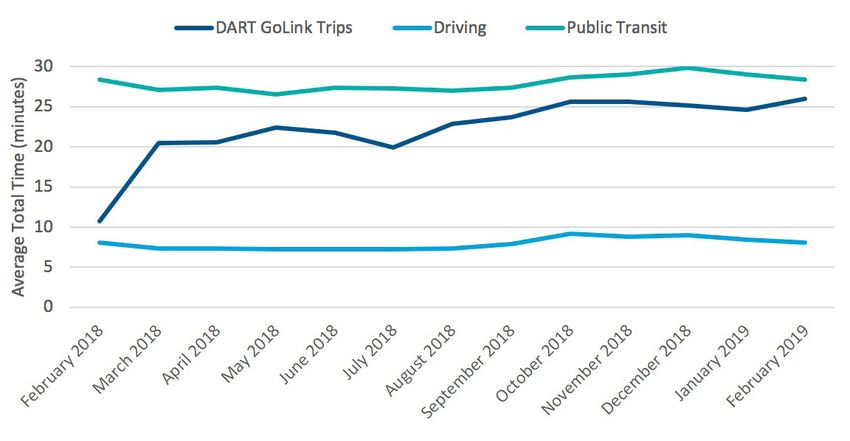
43   Figure   3-23:   MOD service provider subsidy per rider by zone
44   Figure   3-24:   GoLink Shuttle and UberPool Subsidy per Rider
45   Figure   3-25:   Eliminated Route 346
46   Figure   3-26:   NC service regions of Plano On-Call (left) and NC Plano Go
                      Link (right)
47   Figure 3-27:     Average DART GoLink lead time (wait time) and (wait time
                      minus given ETA) for persons with disabilities
48   Figure 3-28:     Ratings for overall user experience with DART GoLink
48   Figure 3-29:     Ratings for overall user experience with DART GoLink since
                      UberPool available
49   Figure 3-30:     Ratings for overall user experience of UberPool trip through
                      GoPass
51   Figure 3-31:     Distribution of travel time across all Plano zones
52   Figure 3-32:     Distribution of wait time across all Plano zones
61   Figure A-1:      How do you usually access GoLink service? (choose all)
                      (N=251)
61   Figure A-2:      What is the purpose of your trip? (N=250)
62   Figure A-3:      How often do you ride with GoLink service? (N=251)
62   Figure A-4.      How do you schedule your trips on GoLink? (choose all)
                      (N=240)
62   Figure A-5:      Do you use GoPass App to schedule your trip? (N=244)
63   Figure A-6:      If YES, what types of information or service do you get from
                      GoPass? (N=167)
63   Figure A-7:      If NO, what keeps you from using the app? (N=77)
63   Figure A-8:      Which of the following modes of transportation have you used
                      in the Dallas area during last 12 months? (choose all) (N=245)
64   Figure A-9:      What is your gender? (N=248)
64   Figure A-10:     Please choose your age range (N=238)
64   Figure A-11:     Which mobility devices do you use to board public transit?
                      (choose all) (N=239)
64   Figure A-12:     What special assistance do you need to board public transit?
                      (choose all) (N=255)
65   Figure A-13:     What is your race or ethnicity? (choose all) (N=255)
65   Figure A-14:     Approximately what is the range of your gross (pre-tax) house
                      hold income last year? (N=255)
65   Figure A-15:     How many vehicles does your household currently own or
                      lease? (N=246)
66   Figure A-16:     Are you aware that riders can now get to/from rail stations and
                      transit center in GoLink zones using UberPool for free?
                      (N=193)

                                            FEDERAL TRANSIT ADMINISTRATION              vi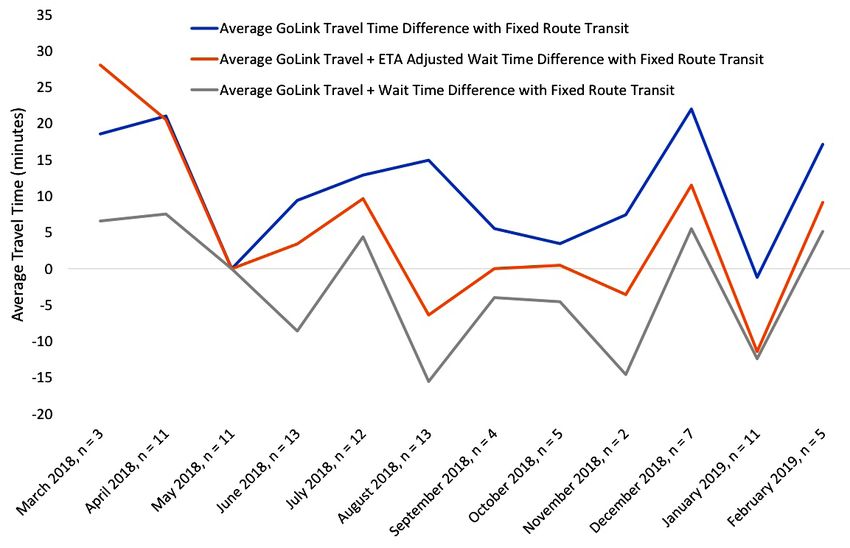
66   Figure A-17: Are you willing to pay $1.00 extra for an UberPool trip if you
                    could get the service within 10 minutes? (N=194)
66   Figure   A-18: Are you aware that riders can now travel within this GoLink
                    zones using UberPool for $3.00? (N=186)
66   Figure   A-19: Have you used UberPool in this GoLink Zone yet? (N=182)
67   Figure   A-20: Did you access UberPool through GoPass or directly through
                    UberPool? (N=169)
67   Figure   A-21: How many times have you used UberPool for all or any portion
                    of your trip in a GoLink zone? (N=189)
67   Figure   A-22: How would you rate GoLink service since UberPool joined
                    DART to provide service? (N=111)
67   Figure   A-23: How do you usually get to GoLink service? (N=182)
68   Figure   A-24: What is the purpose of your trip? (N=186)
68   Figure   A-25: How often do you ride GoLink? (N=186)
68   Figure   A-26: How do you schedule your trips on GoLink? (N=196)
68   Figure   A-27: How many times a day do you schedule a trip on GoLink?
                    (N=185)
69   Figure   A-28: After completing this trip on GoLink, are you going to use an
                    other DART transportation mode to get at your destination?
                    (N=183)
69   Figure   A-29: If Yes, what mode? (N=105)
69   Figure   A-30: Please rate your access to DART bus stops, transit centers, and
                    light rail stations with GoLink since UberPool available. (N=169)
69   Figure   A-31: Please rate your access to DART’s overall bus and rail system
                    with GoLink since UberPool available. (N=173)
70   Figure   A-32: Please rate your approximate waiting time with GoLink since
                    UberPool available. (N=173)
70   Figure   A-33: Did you use GoPass App to schedule this trip? (N=183)
70   Figure   A-34: If YES, what types of information or service do you get from
                    GoPass? (N=153)
70   Figure   A-35: If NO, what keeps you from using the app? (N=30)
71   Figure   A-36: Please rate your experience with accessing UberPool through
                    GoPass App in trip planning, scheduling service, and fare
                    payment (scale of 1 to 5; 1 = poor, 5 = excellent).
71   Figure   A-37: Have you taken this survey before? (N=166)
71   Figure   A-38: Which of the following modes of transportation have you used
                    in the Dallas area during last 12 months? (N=196)
71   Figure   A-39: What is your gender? (N=173)
72   Figure   A-40: Please choose your age range (N=170)
72   Figure   A-41: Which mobility device assistance do you use to board public
                    transit? (N=196)

                                            FEDERAL TRANSIT ADMINISTRATION         vii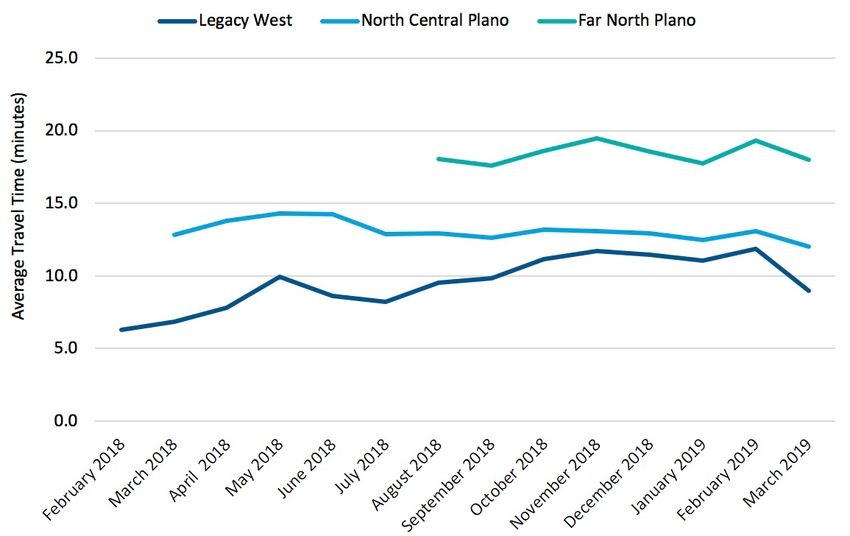
72      Figure A-42: What special assistance do you need to board public transit?
                              (N=196)
         72      Figure A-43: What is your race or ethnicity? (Please check all that apply.)
                              (N=196)
         73      Figure A-44: Approximately what is the range of your gross (pre-tax) house
                              hold income last year? (N=122)
         73      Figure A-45: How many vehicles does your household currently own or lease?
                              (N=160)

LIST OF TABLES

          7      Table ES-1:     Summary of Findings
         10      Table 1-1:      Overview of MOD Sandbox Projects
         19      Table 3-1:      Evaluation Hypotheses, Performance Metrics, and Data Sources
                                 for the DART GoLink Sandbox Project
         23      Table 3-2:      After completing this trip on GoLink, are you going to use an
                                 other DART transportation mode to get to your destination?
                                 (N=254)
         45      Table 3-3:      Comparative Average Subsidies per Rider for Key Benchmark
                                 Services
         49      Table 3-4:      Would Users Recommend GoLink to Friends and Family?
         50      Table 3-5:      Would Users Recommend UberPool Service to Friends and
                                 Family?

                                                       FEDERAL TRANSIT ADMINISTRATION         viii
ACKNOWLEDGMENTS
ICF and the Transportation Sustainability Research Center (TSRC) of the
Institute of Transportation Studies at the University of California, Berkeley thank
the U.S. Department of Transportation for generously funding this study. The
authors also thank the transportation professionals, public agencies, and service
providers that made this research possible.
ABSTRACT
The Mobility on Demand (MOD) Sandbox Demonstration Program provides
a venue through which integrated MOD concepts and strategies, supported
through local partnerships, are demonstrated in real-world settings. For the
11 MOD Sandbox Demonstration projects, an independent evaluation was
conducted that includes an analysis of project impacts from performance
measures provided by the project partners and an assessment of the business
models used. This document presents the results from the independent
evaluation of the Dallas Area Rapid Transit (DART) First and Last Mile Solution
MOD Sandbox Demonstration project. Evaluated were hypotheses that explored
project impacts on travel behavior, user experiences, first and last mile to public
transit accessibility, service quality for passengers with disabilities, and costs.
The project improved first and last mile connectivity to DART transit, increased
satisfaction among DART transit users, enhanced service for passengers with
disabilities, and increased the geographic scope of DART transit service in
the Plano area. In addition, the wait and travel times for passengers with and
without disabilities reflected similar distributions. The subsidy per rider of
GoLink services was lower than the low-ridership fixed-route transit services
that it replaced in Plano, but it was not lower than the subsidy for DART fixed-
route transit in the overall Dallas region. DART project team members were
interviewed to better understand challenges, barriers, successes, and broader
lessons learned from the project, representing agency personnel from the
offices of Innovation, Service Planning, Scheduling, Paratransit Operations, and
Marketing. Lessons learned revealed the importance of having pre-planned,
ready-to-go projects with committed partners, flexible contracting terms,
metrics for adjusting spatial and temporal service coverage (including terminating
service if appropriate), vehicle right-sizing, and understanding customer needs.
FEDERAL TRANSIT ADMINISTRATION ixEXECUTIVE This report presents the results of the independent evaluation of the Dallas Area
SUMMARY Rapid Transit (DART) First and Last Mile Solution project, operated by DART
and transportation service provider partner Uber, with support from the Federal
Transit Administration (FTA). The objective of the project was to implement first
mile and last mile (FMLM) strategies to improve service options and connectivity
for customers and to increase efficiency within DART’s operations.
The DART First and Last Mile Solution project was one of 11 Mobility on Demand
(MOD) Sandbox Demonstrations partially funded by FTA. The independent
evaluation was sponsored by the U.S. Department of Transportation (USDOT)
Intelligent Transportation Systems Joint Program Office (ITS JPO) and FTA.
DART has expanded its transit services significantly to help accommodate the
explosive growth in the Dallas/Fort Worth area, although increasing ridership
and service frequency has been a challenge, one that is notably difficult for bus
services, and many residents in the area have difficulty completing the first and/or
last mile segment of their trips, even in cases where high frequency public transit
services are available for significant portions of their trip. Almost 28% of all Dallas
area residents and 24% of all jobs in the DART service area are more than a
quarter-mile from a bus or rail station.
The project aimed to address these challenges by implementing FMLM strategies
to increase connectivity for passengers and improve the overall DART transit
network. DART employed a number of different approaches to address these
challenges. The MOD Sandbox project leveraged DART’s existing GoPass
ticketing app to integrate public and third-party mobility providers and included a
new version of the GoPass app. The project implemented the GoLink on-demand
microtransit shuttle service across three zones in the Plano, Texas area for point-
to-point travel within a given zone and FMLM travel to or from a DART transit
station. The project also integrated UberPool as an option within the GoPass app
for point-to-point or FMLM travel within zones.
GoLink first began in October 2017 within the Legacy West zone. The service
was a microtransit system that provided noontime service within the zone for
Toyota employees. Field demonstrations for the expanded GoLink pilot that are
the subject of this evaluation initially launched in the Plano area in late February
2018. The UberPool option within the GoPass app launched during March
2019 across six zones in DART's service area over the two final months of the
evaluation period, including the three Plano zones. This evaluation focused only
on the zones within Plano. The evaluation of the demonstration ended in April
2019 and included analysis of two surveys conducted in February 2019 (n = 255)
and April 2019 (n = 196), activity data of GoLink shuttle movements with 58,226
trips, and agency data on vehicle activity, costs, and transit system coverage.
In August 2019, DART representatives from the offices of Innovation, Service
FEDERAL TRANSIT ADMINISTRATION 1EXECUTIVE SUMMARY
Planning, Scheduling, Paratransit Operations, and Marketing were interviewed.
The report explores the project through the evaluation of 12 hypotheses.
Hypothesis 1: The app increases transit use among the sample as a
result of the app improvements, leveraging FMLM MOD providers and
lower-cost public transportation.
The results of the evaluation suggest that public transit use may have increased
among a portion of the GoLink users surveyed due to the pilot project
implementation. The analysis found that almost half (45%) of those surveyed
used another DART transportation mode (rail and/or bus) to get to their final
destination. These respondents who made FMLM trips were asked to identify
how they would have made their trip prior to the existence of GoLink. Although
many of these respondents still would have used a DART service for their trip, a
notable portion of respondents would have driven in a personal car (25%), taken
a taxi, Uber, or Lyft vehicle (20%), or would not have made the trip (11%) prior
to the implementation of the GoLink service. This finding suggests that public
transit use by these respondents likely increased as a result of the pilot project,
supporting Hypothesis 1.
Hypothesis 2: The improvements to the app result in an increase in the
mode share of carpool travel to DART transit.
The evaluation sought to determine whether improvements to GoLink resulted
in an increase in carpool travel to DART transit services. DART had initially
planned to have a more extensive integration of carpooling (called GoPool) with
GoLink; however, this ultimately was not successful due to a lack of available
drivers as well as other challenges. The survey still explored whether the existing
implementation of GoLink influenced carpooling behavior. The results found that
just 5% of GoLink users indicated that the service was replacing trips they had
previously made through carpooling or vanpooling, and, broadly, they did not
provide evidence that to-DART transit increased. Absent greater integration of
carpooling into the app, there were no other major reasons why the carpooling
mode would have increased as a result of the project app. Hence, overall,
Hypothesis 2 was not supported.
Hypothesis 3a: Persons with disabilities find that their ability to access
DART transit has improved.
The evaluation explored, through a series of survey questions, whether
persons with disabilities experienced improved access to DART transit due to
the implementation of GoLink. The analysis shows that all respondents with
disabilities considered their access to DART transit stations and the overall
DART system as average or above average. Additionally, many respondents
with disabilities indicated that their DART system accessibility improved after
implementation of the GoLink pilot project. Before GoLink, 57% of passengers
FEDERAL TRANSIT ADMINISTRATION 2EXECUTIVE SUMMARY
with disabilities rated their access to DART stations as “excellent” or “good”
compared to 90% of passengers with disabilities who also rated their access to
stations as “excellent” or “good” after upgrades to the GoLink service. These
findings support Hypothesis 3a.
Hypothesis 3b: Persons with disabilities experience improved FMLM
access as a result of the app.
Activity data were used to evaluate how the GoLink system impacted FMLM
access through the app. The standard GoLink shuttle was a wheelchair-accessible
vehicle (WAV), but most passengers did not require wheelchair accommodations
for their travel. Some passengers using GoLink may have had other disabilities,
but these were not visible in the activity data. Trips that required a wheelchair
accommodation were recorded and were used as the primary measure of the
system’s performance with persons with mobility impairments. Travel and wait
times for all WAV trips were recorded, including a modified wait time that
considered the given estimated time of arrival (ETA) (in minutes) as added on to
the initial request time of the trip. The origin and destination of each of these
trips was run through the Google Directions API to determine the minutes the
trip would take using fixed-route transit. The average travel times of fixed-route
transit were compared to those of GoLink. The average in-vehicle travel time
of all GoLink WAV trips was consistently faster than the analogous fixed-route
travel times during the evaluation period. If the total GoLink travel time was
considered to be the vehicle request time to the end of the trip, fixed-route
service was found to be faster when there was a fixed-route option available.
When the given ETA added to the vehicle request time (moving the start time to
request time + ETA minutes), again, GoLink was found to be faster, on average.
The comparison was also made specifically for GoLink WAV trips that connect
to other transit facilities. The sample size was considerably smaller, and the
conclusions were not as consistent or robust. However, a notable finding was
that a fixed-route transit service could not service a measurable fraction of trips
completed by GoLink (these trips were not included in the time comparisons).
For such trips, GoLink was the only option. Across all WAV trips, 13% could not
be serviced by fixed-route transit. Across all WAV trips that connected to other
public transit facilities, 63% were found to not be achievable by existing fixed-
route public transit. These findings collectively suggest that Hypothesis 3b was
supported.
Hypothesis 4: Automobile travel among the pilot group declines.
Survey data on automobile travel and mode shift data suggest that there was
a reduction in personal automotive travel among the pilot group. Note that
this hypothesis was focused on the evaluation of personal automobile travel of
users (as opposed to shuttles or municipal vehicles). The most prominent data
supporting this came from the survey, which indicated that 22% of respondents
FEDERAL TRANSIT ADMINISTRATION 3EXECUTIVE SUMMARY
would have driven a personal car in the absence of GoLink, and another 20%
would have taken a taxi or Transportation Network Company (TNC) such as
Uber or Lyft. The results suggest that about 42% of respondents were taking
GoLink instead of using a personal automobile in some form. Because of this
sizable shift, the results suggest that GoLink reduced automobile travel. Note
this conclusion does not imply that GoLink reduced vehicle miles of travel (VMT).
Personal automotive VMT was replaced by GoLink shuttle VMT, which if done at
a single passenger occupancy within the shuttles, may be more energy-intensive.
Rather, the data suggest that the GoLink service was capable of providing
mobility that would have otherwise been traveled by a personal automobile in
some form. The results support Hypothesis 4.
Hypothesis 5a: Users of the app consider their transportation and
multimodal travel options improved because of the app.
The evaluation examined user experiences and opinions with the app and aspects
of GoLink to determine whether respondents considered their transportation
options improved due to the app. The survey asked respondents to rate the
ease of use, information accuracy, and overall experience of users in terms of
trip planning, scheduling, and fare payment. The majority of respondents rated
their experiences along these dimensions as “above average.” More than three
quarters of respondents rated their experience with the app as “excellent” or
“good” across these three areas. These findings suggest that those surveyed
had positive overall experiences with the GoPass app. Based on responses to
trip planning, scheduling, and fare payment questions, the results suggest that
transportation and multimodal options were improved because of it, supporting
Hypothesis 5a.
Hypothesis 5b: Users experience lower travel times than they would
have without using the app.
The analysis measured whether users experienced lower travel times than they
would have without the app-based service by assessing average monthly travel
times and user ratings of their in-vehicle travel times. Average in-vehicle travel
times with both the GoLink and UberPool options fluctuated modestly over the
study year, with average GoLink travel times ranging from 11 to 13 minutes, and
average UberPool travel times of about 8 minutes. UberPool data were collected
for a span of only two months, so fluctuations in UberPool travel times may
not have been fully captured. Survey results suggest that users were generally
satisfied with in-vehicle travel times for both GoLink and UberPool options. The
results generally support this Hypothesis 5b.
Hypothesis 6: App users experience better FMLM (access and egress)
mobility to DART transit in the form of reduced travel times for
FMLM trips.
FEDERAL TRANSIT ADMINISTRATION 4EXECUTIVE SUMMARY
The evaluation assessed whether app users experience improved access and
egress mobility to DART transit in the form of reduced travel times through
analysis of the survey and activity data. Although average travel times for FMLM
trips increased slightly between April 2018 and February 2019, survey results
show that the majority of respondents indicated that their FMLM mobility to
transit stations improved as a result of GoLink. Thus, the results of this analysis
generally support Hypothesis 6.
Hypothesis 7: The geographic scope of locations reachable by DART
transit services is increased.
The geographic coverage of locations reachable by DART was measured by
mapping the areas considered accessible by DART transit services both before
and after GoLink implementation for the service area covered in the MOD
Sandbox Demonstration. Before March 2017, 44% of Plano was considered
accessible via DART transit. After the implementation of GoLink and as of May
2019, 82% of Plano was covered by DART transit services, reflecting an 85%
increase in DART’s Plano coverage area. Survey respondents also rated their
ability to reach areas within the GoLink zones as favorable. Taken together, these
results supported Hypothesis 7.
Hypothesis 8: The costs of fixed-route transit are higher than the MOD
services on a per-rider basis.
To assess whether the transportation services offered as part of the MOD
Sandbox Demonstration were financially comparable to fixed-route transit on a
per-rider basis, researchers analyzed subsidy per rider data provided by DART.
This comparison was done at several levels. DART replaced a low ridership
fixed-route bus service in the West Legacy region, which required a subsidy of
about $33.71 per rider. GoLink shuttles performed with an average subsidy per
rider of $16.37. This comparison shows that GoLink had lower operational costs
than low-ridership fixed-route transit, which is operational within the same
low-density environment. Across the entire DART system, the subsidy per rider
for fixed-route transit was $6.80 and for buses system-wide was $8.28. Hence,
GoLink’s cost performance exceeded that of low ridership routes, but it was not
so competitive as to be more efficient than the DART system fixed-route average
cost performance. Taking these perspectives into account, the results point to a
partially-supported Hypothesis 8.
Hypothesis 9: The average lead time for trips with wheelchair-
accessible vehicles (WAVs) that are scheduled for demand-responsive
travel declines.
Activity data from the GoLink service permitted the computation of user wait
time over the course of the project. The trend in average wait time for WAV
trips (i.e., those called for persons with disabilities requiring mobility devices
FEDERAL TRANSIT ADMINISTRATION 5EXECUTIVE SUMMARY
such as wheelchairs) was evaluated and showed a gradual decline during the
evaluation period. Average monthly wait times were between 13 and 23 minutes.
The average wait time across all trips was 18. Furthermore, the non-GoLink
paratransit service for DART requires that users schedule trips at least an hour
prior to the trip. Hence, at almost any value, the wait times provided by GoLink
were considered an improvement over the option preceding GoLink. Collectively,
the findings supported Hypothesis 9.
Hypothesis 10: Customer satisfaction increases as a result of the
project.
The evaluation sought to assess whether customer satisfaction increased
as a result of the project. Survey questions asked respondents to rate their
experiences with GoLink and UberPool services provided through by the MOD
Sandbox project. The findings revealed that the vast majority of respondents
rated their overall experiences with GoLink and UberPool as “above average.”
In addition, respondents gave “above average” ratings to their overall experience
with UberPool through GoLink. These findings supported a confirmation of
Hypothesis 10.
Hypothesis 11: The perception of the DART brand improves as a result
of the project.
The results of the evaluation suggest that the perception of DART’s brand may
have improved as a result of the project, as most respondents viewed both
GoLink shuttle and UberPool services as favorable enough to recommend to
peers. In total, 88% of respondents said they would recommend the GoLink
service to a family member or friend, and 73% said they would recommend the
UberPool option. Generally, these results support Hypothesis 11.
Hypothesis 12: The process of deploying the project will produce
lessons learned and recommendations for future research and
deployment.
The evaluation team interviewed members of the DART project team to better
understand challenges, barriers, best practices, and lessons learned from the
implementation of the project. DART identified a number of challenges during
pilot implementation, including 1) data sharing difficulties, 2) changing technology
providers part way through the project, and 3) GoPass platform integration
issues. Lessons learned through project development included 1) identifying
potential projects ahead of time, 2) defining clear service goals, 3) enacting a
collaborative planning process, 4) having broad contract terms, 5) right-sizing
of vehicles, 6) having carefully-crafted marketing, and 7) collecting and sharing
relevant data between project stakeholders. Lessons learned from the interviews
for future MOD deployments emphasize the importance of having pre-planned,
ready-to-go projects with committed partners. Additionally, flexible contracting
FEDERAL TRANSIT ADMINISTRATION 6EXECUTIVE SUMMARY
terms can allow projects to be more agile and responsive, allowing partners and
vendors to more readily pivot in response to customer needs and demand. DART
personnel emphasized the importance of adapting a demonstration throughout
the pilot period rather than waiting until the end of a contract period to update
service features. DART personnel also recommended that public agencies
develop metrics for adjusting vehicle size and spatial and temporal service
coverage (including terminating service if appropriate). Throughout the course of
the MOD demonstration, DART had to actively reduce vehicle size (for greater
maneuverability) and reduce the size of service zones to reduce travel and wait
times. Finally, the MOD demonstration revealed the importance of understanding
customer needs through marketing. Public agencies may need to evolve from
measuring individual trips (i.e., connectivity between Point A and Point B) to
measuring their “mobility relationship” with their customers. Data may be able
to help public transit agencies more dynamically respond to changes in customer
and operational needs.
The full report presents detailed findings of the DART evaluation, with lessons
learned that may help advance similar initiatives within other public transit
systems. Table ES-1 provides a summary of the findings.
Table ES-1
Summary of Findings
Hypothesis Status Key Finding
1: The app increases transit use among the
Analysis of survey data suggests that public transit use may
sample as a result of the app improvements,
Supported have increased among a portion of the GoLink user base due
leveraging FMLM MOD providers and
to GoLink implementation.
lower-cost public transportation.
2: The improvements to the app result in an
The survey data did not contain conclusive evidence that
increase in the mode share of carpooling Not Supported
carpooling was impacted by GoLink.
travel to DART transit.
Analysis of the survey results show that respondents with
3a: Persons with disabilities find that their
disabilities indicated their access to DART transit stations and
ability to access DART transit has Supported
the overall DART system improved after implementation of
improved.
GoLink.
Persons with disabilities experienced improved access both
3b: Persons with disabilities experience in the form of faster in-vehicle travel times and overall travel
improved FMLM access as a result of the Supported times when considering the ETA given. A sizeable share (63%)
app. of WAV trips to DART that were made by GoLink could not
have been made by fixed-route public transit.
Personal automobile and TNC mode substitution as a
result of GoLink was found to be 42%. This amounted to
4: Automobile travel among the pilot group
Supported a reduction in automobile use among the pilot group that
declines.
was sizeable given the total distance traveled by the GoLink
vehicle.
5a: Users of the app consider their Nearly all survey respondents had above average experiences
transportation and multimodal travel Supported with the GoPass app with respect to trip planning, scheduling,
options improved because of the app. and fare payment.
FEDERAL TRANSIT ADMINISTRATION 7EXECUTIVE SUMMARY
Table ES-1 (cont.)
Summary of Findings
Hypothesis Status Key Finding
Although average travel times fluctuated modestly during the
5b: Users experience lower travel times than study period, survey results suggest that users are generally
Supported
they would have without using the app. satisfied with GoLink in-vehicle travel times for both GoLink
shuttle and UberPool services.
6: App users experience better FMLM (access The majority of survey respondents perceived that their
and egress) mobility to DART transit in the Supported FMLM mobility to/from public transit stations had improved
form of reduced travel times for FMLM trips. as a result of GoLink.
7: The geographic coverage of locations reachable by DART
The geographic scope of locations reachable
Supported transit services increased, and survey respondents rated their
by DART transit services is increased.
ability to reach areas within the GoLink zone favorably.
Subsidy per rider data suggest that the GoLink services are
cost-competitive with low ridership fixed-route services that
8: The costs of fixed-route public transit are operate in the same region. It was similarly competitive with
Partially
higher than the MOD services on a per-rider the paratransit services that operate in the same region and
Supported
basis. more efficient than the costs of DART paratransit system
wide. GoLink was not more cost-efficient than DART fixed-
route public transit more broadly.
Average lead times (wait times) were an improvement over
9: The average lead time for trips with WAVs
wait times from existing paratransit services. Average wait
that are scheduled for demand-responsive Supported
times minus given ETAs were also an improvement over the
travel declines.
same paratransit wait times previously provided.
Analysis of survey results shows that the majority of
10: Customer satisfaction increases as a result of respondents rated their experiences overall and with specific
Supported
the project. aspects of the GoLink service as “above average,” suggesting
that customer satisfaction increased.
Analysis of survey results suggests that most respondents
11: The perception of the DART brand improves
Supported viewed both GoLink shuttle and UberPool services as
as a result of the project.
favorable enough to recommend to their peers.
Expert (stakeholder /project partner) interviews identified
12: The process of deploying the project best practices and lessons learned, including to 1) identify
will produce lessons learned and potential projects ahead of time, 2) define clear service goals,
Supported
recommendations for future research and 3) enact a collaborative planning process, 4) have broad
deployment. contract terms, 5) right-size vehicles, 6) have carefully crafted
marketing, and 6) collect and share relevant data.
FEDERAL TRANSIT ADMINISTRATION 8SECTION
Introduction
1 Overview of MOD Sandbox
Demonstrations
The Federal Transit Administration (FTA)’s Mobility on Demand (MOD) effort
developed around a vision of a multimodal, integrated, automated, accessible, and
connected transportation system in which personalized mobility is a key feature.
FTA selected 11 MOD Sandbox Demonstration projects that are testing solutions
that advance the MOD vision. In partnership with public transportation agencies,
the MOD Sandbox is demonstrating the potential for new innovations to support
and enhance public transportation services by allowing agencies to explore
partnerships, develop new business models, integrate transit and MOD solutions,
and investigate new, enabling technical capabilities.
Evaluation of each project’s benefits and impacts will guide the future
implementation of innovations throughout the U.S. Broadly, MOD Sandbox
projects take several approaches, including the development of new or improved
trip planners, integration of new mobility services with traditional public
transit functions, and implementation of new integrated payment and incentive
structures for travel using public transit. Several Sandbox projects focus on
improving first mile/last-mile (FMLM) access to public transportation through
collaboration with private sector operators, including bikesharing, carsharing,
ridesourcing/Transportation Network Companies (TNCs), and other shared
mobility operators.
More information about the MOD Sandbox Program can be found at
https://www.transit.dot.gov/research-innovation/mobility-demand-mod-sandbox-
program. In addition, Table 1-1 provides a summary of all projects in the MOD
Sandbox Program.
FEDERAL TRANSIT ADMINISTRATION 9SECTION 1: INTRODUCTION
Table 1-1
Overview of MOD Sandbox Projects
Region Project Description
Chicago Incorporation of Bikesharing Releases updated version of Chicago Transit Authority’s (CTA)
Company Divvy existing trip planning app. New version incorporates Divvy, a
bikesharing service, and allows users to reserve and pay for
bikes within the app.
Dallas Integration of Shared-Ride Releases updated version of Dallas Area Rapid Transit’s (DART)
Services into GoPass Ticketing existing trip planning app. Updated version incorporates shared-
Application ride services to provide first/last-mile (FMLM) connections
to public transit stations and allows users to pay for services
within the app.
Los Angeles and Two-Region Mobility on Demand Establishes partnership between Via and LA Metro. Via provides
Puget Sound FMLM connections for passengers going to or leaving from
transit stations. There is a companion project in Seattle, WA.
Phoenix Smart Phone Mobility Platform Releases updated version of Valley Metro’s existing trip planning
app. New version updates trip planning features and enables
payments.
Pinellas County Paratransit Mobility on Demand Improves paratransit service by combining services from taxi,
(Florida) ridesourcing/TNCs, and traditional paratransit companies.
Portland Open Trip Planner Share Use Releases updated version of TriMet’s existing multimodal app.
Mobility New version provides more sophisticated functionality and
features, including options for shared mobility.
San Francisco Bay Bay Area Fair Value Commuting Reduces single occupancy vehicle use within Bay Area
Area (Palo Alto) through commuter trip reduction software, a multimodal app,
workplace parking rebates, and FMLM connections in areas with
poor access to public transit.
Integrated Carpool to Transit Establishes partnership between Scoop and BART. Scoop
(BART System) matches carpoolers and facilitates carpooling trips for
passengers going to or leaving from BART stations with
guaranteed parking.
Tacoma Limited Access Connections Establishes partnerships between local ridesourcing companies/
TNCs and Pierce Transit. Ridesourcing companies provide
FMLM connections to public transit stations and park-and-ride
lots with guaranteed rides home.
Tucson Adaptive Mobility with Reliability Built integrated data platform that incorporates ridesourcing/
and Efficiency TNC and carpooling services to support FMLM connections and
reduce congestion.
Vermont Statewide Transit Trip Planner Releases new multimodal app for VTrans that employs fixed and
flexible (non-fixed) transportation modes to route trips in cities
and rural areas.
An independent evaluation (IE) is required by Federal Public Transportation
Law (49 U.S.C. § 5312(e)(4)) for demonstration projects receiving FTA
Public Transportation Innovation funding. The IE for the MOD Sandbox
Demonstration projects was sponsored by the USDOT Intelligent
Transportation Systems Joint Program Office (ITS JPO) and FTA.
This report focuses on the evaluation of the MOD Sandbox Demonstration
project with Dallas Area Rapid Transit (DART) implemented in the Dallas/
FEDERAL TRANSIT ADMINISTRATION 10SECTION 1: INTRODUCTION
Fort Worth area. The project, entitled DART First and Last Mile Solution,
consisted of collaboration between DART and other transportation partners to
deliver improved on-demand transportation options for point-to-point trips and
FMLM travel to and from DART transit services in defined service zones. The
evaluation of this project involved exploring a number of hypotheses surrounding
the project’s impact on travel behavior, user experiences, accessibility, and
costs. Following a more detailed overview of the project, these hypotheses are
explored in the sections that follow.
Evaluation Framework
For each of the 11 MOD Sandbox projects, the IE team developed an evaluation
framework in coordination with the project team. The framework is a project-
specific logic model that contains the following entries:
1. MOD Sandbox Project – denotes the specific MOD Sandbox project.
2. Project Goals – denotes each project goal for the specific MOD Sandbox
project and captures what each MOD Sandbox project is trying to achieve.
3. Evaluation Hypothesis – denotes each evaluation hypothesis for the
specific MOD Sandbox project. The evaluation hypotheses flow from the
project-specific goals.
4. Performance Metric – denotes the performance metrics used to measure
impact in line with the evaluation hypotheses for the specific MOD Sandbox
project.
5. Data Types and Sources – denotes each data source used for the
identified performance metrics.
6. Method of Evaluation – denotes the quantitative and qualitative evaluation
methods used.
FEDERAL TRANSIT ADMINISTRATION 11SECTION
DART MOD Sandbox
2 Project Summary
DART is a public transit agency in the Dallas/Fort Worth area of Texas that
operates bus, light rail, commuter rail, streetcar, paratransit, and vanpool
services. DART operates the sixth-busiest light rail service in the U.S., logging
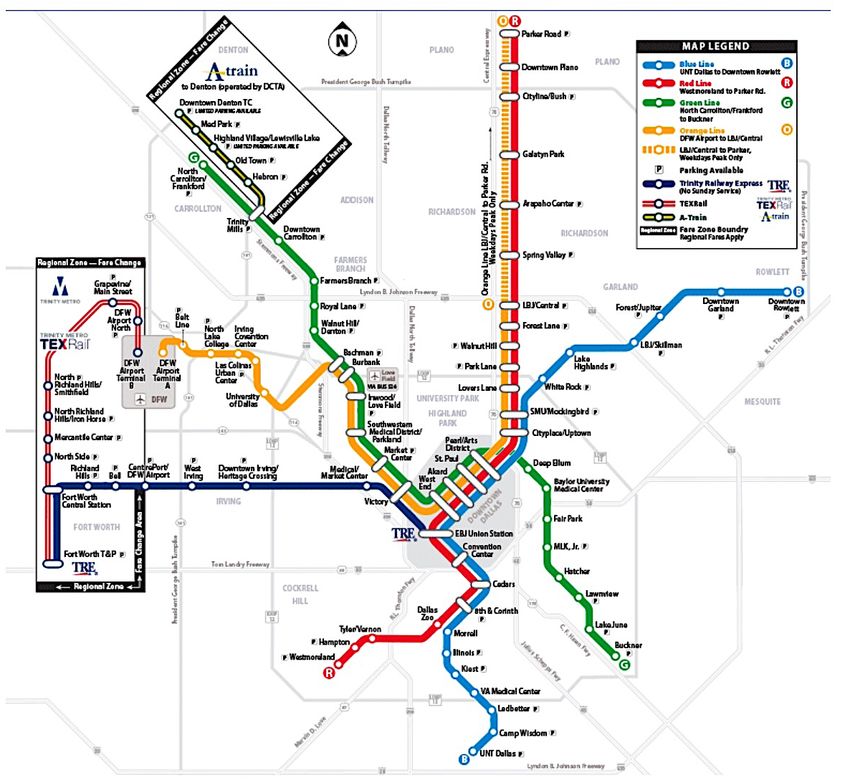
more than 95,000 weekday boardings. Figure 2-1 presents a map of the DART
light rail system as of August 2019.
Source: DART
Figure 2-1
DART light rail system map 2019
FEDERAL TRANSIT ADMINISTRATION 12SECTION 2: DART MOD SANDBOX PROJECT SUMMARY
Although DART has expanded its services significantly to help accommodate
population and job growth in the area, increasing transit ridership and service
frequency, most notably through bus services, has been a challenge. Many
residents of the Dallas/Fort Worth area have difficulty completing the FMLM
segments of their trips, even while high-frequency rail or bus services are
available for major portions of their trips. Nearly 28% of all residents and 24% of
all DART service area jobs are more than a quarter-mile from a bus stop or rail
station.
For these reasons, DART has explored a number of options over the years to
fill the gaps in its fixed-route transit system. For approximately 20 years, DART
had been operating a service known as DART On-Call, a demand-responsive
service in a group of zones offering walk-up and telephone dispatch services.
This service had to be booked between one hour and seven days in advance. The
service was intended to replace underperforming fixed-route service in eight
locations and was typically anchored at rail stations with a service area of six
square miles or less. The service area was designed to operate with one vehicle
per zone. However, over the years, On-Call ridership had become stagnant, and
one service area was discontinued. DART began exploring ways to reinvent the
program to make a more effective door-to-train service. Around the same time,
DART also realized that it was competing with TNCs and that the agency had
to be more competitive in low-density areas where fixed-route service was not
very cost-effective or providing users with the best transit experience. DART
anecdotally observed that customers were beginning to use shared mobility to
get to and from rail stations (e.g., sometimes replacing a bus connection with
shared mobility). DART realized that its role was likely evolving from a public
transit provider to a mobility manager. Around 2015, DART began exploring
opportunities to collaborate with TNCs, including a special promotion to
use TNCs for FMLM connections to DART during St. Patrick’s Day and joint
marketing campaigns with TNCs on the DART app in an effort to enable greater
customer choice.
These considerations led DART to propose a MOD Sandbox Demonstration
project designed to leverage microtransit and TNCs to improve service and
connectivity for customers while simultaneously providing increased operational
and cost efficiencies. Additionally, DART hoped to leverage an updated demand-
responsive service to increase public transit ridership among those that
historically had not used DART service because of poor fixed-route service
quality in lower-density built environments. DART’s Sandbox project comprised
three components: 1) GoLink dedicated shuttle vehicles providing microtransit
demand-responsive service in each zone; 2) an UberPool option for making
these trips in respective zones; and 3) integration of both GoLink and TNCs into
DART’s GoPass smartphone app. With respect to the latter, DART provides
a choice of UberPOOL for the same price as GoLink services; however, users
FEDERAL TRANSIT ADMINISTRATION 13SECTION 2: DART MOD SANDBOX PROJECT SUMMARY
have to download, register, and pay through the Uber app. TNC use is free for
users traveling to and from a rail station for up to two trips per a day. For users
traveling within a zone not connecting to a rail station, users have to pay $3 per
a trip (half the price of a day pass), and Uber deducts this from the ride cost and
DART pays the difference.
At the beginning of the MOD Sandbox demonstration project, On-Call was
operational at seven locations. As part of the demonstration, DART transitioned
On-Call into GoLink by expanding the existing zones beyond six square miles,
eliminating restrictions that required one vehicle per zone, and changing some
of the program rules. As part of the revised program rules, the advanced call
requirement was eliminated, a requirement to travel to/from an anchor point was
also eliminated (allowing point-to-point travel within a demand-responsive zone),
and six new service areas were added (three in Plano and three in south Dallas).
DART acknowledges, however, that removing a service area size limitation may
not be the best approach operationally. In one zone, the service area is 23 square
miles, which may be too large, as the zone has longer travel and wait times. In
general, however, DART attributes the revised program rules contributing to
increasing ridership and, in some cases, dramatic increases in ridership for some
zones.
Technology updates included integrating a new version of DART’s existing
GoPass app that included access to DART transit trip planning, scheduling, and
fare payment along with access to an UberPool option for integrated FMLM
travel. Service updates included converting 13 on-call transit zones to GoLink
zones—areas that accommodated FMLM access to and from other DART transit
services (bus and light rail) and within-zone circulation via a GoLink shuttle
or subsidized UberPool option. The GoLink service could be booked through
the GoPass app or could be made via phone reservation at least 30 minutes in
advance. The 13 GoLink pilot zones across the Dallas/Fort Worth are shown in
Figure 3-2. Of note is that the MOD Sandbox Demonstration included only 3
of the 13 zones located in Plano (Legacy West, Far North Plano, North Central
Plano), which are noted in bold in Figure 2-2.
FEDERAL TRANSIT ADMINISTRATION 14SECTION 2: DART MOD SANDBOX PROJECT SUMMARY
Figure 2-2
DART GoLink zones as
of March 2019
The scope of the MOD Sandbox Demonstration and this evaluation covers the
three Plano zones (Legacy West, North Central Plano, Far North Plano). As one
of the larger GoLink areas, the Plano service area was of particular interest to
DART and was the focus of this evaluation. The Plano GoLink area consisted of
three distinct service zones, including Legacy West, North Central Plano, and
Far North Plano. Both the GoLink shuttle and UberPool option were available
for each of the three Plano zones. GoLink shuttle trips could be taken to or from
another DART public transit service (bus or light rail) in the Plano area for no
additional cost, or riders could pay $1.50 to travel to or from any destination
within a single zone. Alternatively, riders had the option to book an UberPool
ride for $1 to travel to or from a designated DART public transit station or $3
for non-FMLM UberPool travel within a single zone. The North Central Plano
and Far North Plano zones served the Parker Road Station for connections to
DART light rail and bus service, and the Legacy West zone served the Northwest
Plano park-and-ride for connections to DART buses. The three Plano DART
GoLink service zones are displayed in more detail in Figure 2-3.
Total funding for the MOD Sandbox Demonstration was $1,505,000, including
$1,204,000 from FTA and $301,000 in local matching funds.
FEDERAL TRANSIT ADMINISTRATION 15SECTION 2: DART MOD SANDBOX PROJECT SUMMARY
Source: DART
Figure 2-3
DART Plano GoLink zones as of October 2019
Project Timeline
The main milestones for the DART pilot project are as follows:
• January 25, 2017 – DART MOD Sandbox Demonstration project start
(cooperative agreement execution with FTA)
• October 2017 – Lunchtime pilot of GoLink started for user-acceptance
testing
FEDERAL TRANSIT ADMINISTRATION 16SECTION 2: DART MOD SANDBOX PROJECT SUMMARY
• March 2018 – All-day GoLink service launches in Plano Legacy West and
North Central Plano zones (5:00 am–8:00 pm Monday through Friday)
• August 2018 – GoLink service launches in Far North Plano zone
• March 2019 – UberPool option launches in Plano zones
• April 2019 – End of demonstration period
DART collected data relevant to this MOD Sandbox Demonstration between
February 2018 and April 2019, which was also the evaluation period.
FEDERAL TRANSIT ADMINISTRATION 17SECTION
Evaluation Approach,
3 Planning, and Execution
Evaluation Results
The IE team guided the evaluation of the MOD Sandbox project by employing an
evaluation plan developed at the outset of the project. The evaluation plan was
built primarily off a logic model constructed by the IE team and had five basic
components:
1) Project Goals – The stated goals of the project were defined from the
proposal, project summary, and discussion with project team members.
2) Evaluation Hypothesis – Each project goal had a corresponding
hypothesis, a statement that could be answered with “Yes” or “No” that
was related to measuring the achievement of the associated project goal.
3) Performance Metric – Described the measurement that was proposed
to be used to evaluate the hypothesis.
4) Data Sources – Data sources that followed the performance metric and
described the data type and source necessary to compute or evaluate the
performance metric.
5) Method of Evaluation – Defined how the hypothesis would be
evaluated; with the logic model, this was very general, declaring whether
the evaluation would be completed via survey analysis, activity data
analysis, time series analysis, lessons learned, or other method.
The logic model was a table, with one row containing five cells, each populated
with the components described above. The content of the logic model was
also populated in advance of project implementation, where knowledge of the
project trajectory and exact data collected were uncertain. The components
of the logic model constructed for the evaluation of the DART project are
presented in Table 3-1.
FEDERAL TRANSIT ADMINISTRATION 18You can also read