Plant-based diets add to the wastewater phosphorus burden - IOPscience
←
→
Page content transcription
If your browser does not render page correctly, please read the page content below
Environmental Research Letters

LETTER • OPEN ACCESS

Plant-based diets add to the wastewater phosphorus burden
To cite this article: K J Forber et al 2020 Environ. Res. Lett. 15 094018

View the article online for updates and enhancements.

                                 This content was downloaded from IP address 176.9.8.24 on 29/09/2020 at 16:54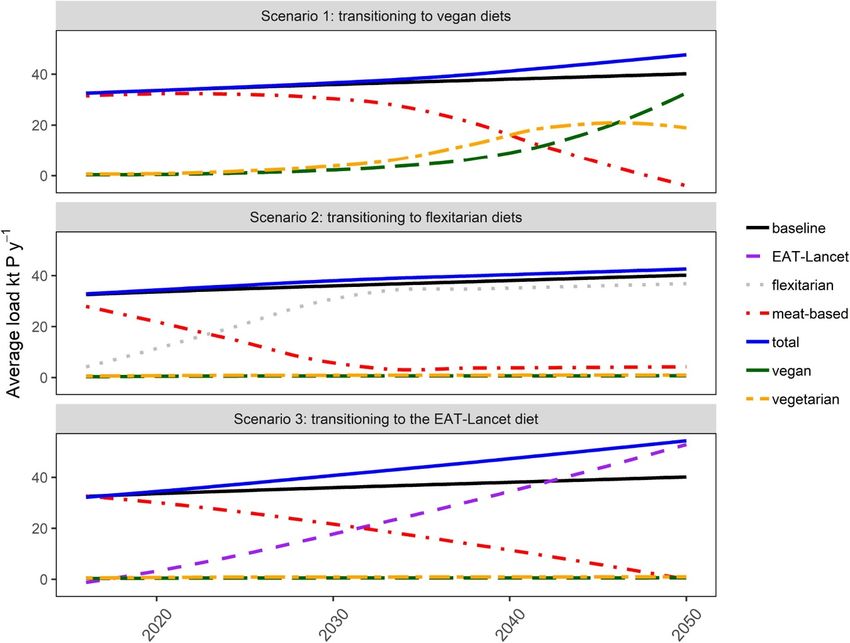
Environ. Res. Lett. 15 (2020) 094018 https://doi.org/10.1088/1748-9326/ab9271
Environmental Research Letters
LETTER
Plant-based diets add to the wastewater phosphorus burden
OPEN ACCESS
K J Forber1, S A Rothwell1, G S Metson2, H P Jarvie3 and P J A Withers1,4
RECEIVED 1
Lancaster Environment Centre, Lancaster University, United Kingdom
13 December 2019 2
Theorectical Biology, Department of Physics, Chemistry and Biology, Linköping University, Sweden
REVISED 3
Dept. of Geography and Environmental Management, and Water Institute, University of Waterloo, Canada
6 May 2020 4
Author to whom any correspondence should be addressed.
ACCEPTED FOR PUBLICATION
12 May 2020 E-mail: p.j.withers@lancaster.ac.uk
PUBLISHED Keywords: phosphorus, diet, wastewater treatment works, sustainability
19 August 2020
Original content from
this work may be used Abstract
under the terms of the
Creative Commons
Global food production and current reliance on meat-based diets requires a large share of natural
Attribution 4.0 licence. resource use and causes widespread environmental pollution including phosphorus (P).
Any further distribution
of this work must Transitions to less animal-intensive diets address a suite of sustainability goals, but their impact on
maintain attribution to
the author(s) and the title society’s wastewater P burden is unclear. Using the UK as our example, we explored historical diet
of the work, journal changes between 1942 and 2016, and how shifting towards plant-based diets might impact the P
citation and DOI.
burden entering wastewater treatment works (WWTW), and subsequent effluent P discharge to
receiving water bodies. Average daily per capita P intake declined from its peak in 1963
(1599 mg P pp−1 d−1 ) to 1354 mg P pp−1 d−1 in 2016. Since 1942, the contribution of processed
foods to total P consumption has increased from 21% to 52% in 2016, but consumption of total
animal products has not changed significantly. Scenario analysis indicated that if individuals
adopted a vegan diet or a low-meat (‘EAT- Lancet’) diet by 2050, the P burden entering WWTW
increased by 17% and 35%, respectively relative to baseline conditions in 2050. A much lower P
burden increase (6%) was obtained with a flexitarian diet. An increasing burden of P to WWTW
threatens greater non-compliance with regulatory targets for P discharge to water, but also presents
an opportunity to the wastewater industry to recycle P in the food chain, and reduce reliance on
finite phosphate rock resources. Sustainable diets that reduce food system P demand
pre-consumption could also provide a source of renewable fertilizers through enhanced P recovery
post-consumption and should be further explored.
1. Introduction health across the globe (Tilman et al 2002, Spring-
mann et al 2016, 2018, Poore and Nemecek 2018,
Agriculture is one of the largest drivers of resource Willett et al 2019). The recent EAT-Lancet supported
use and environmental degradation across the planet; diet (which is low-meat) is a high-profile example of
for instance, it accounts for a third of the global the type of dietary shift suggested to keep the planet
greenhouse gas (GHG) emissions causing anthropo- within its safe operating spaces by 2050, whilst meet-
genic climate change (Le Quéré et al 2015). Food ing global nutritional needs (Willett et al 2019). How-
consumption patterns are linked to agricultural out- ever, food production and dietary patterns have a
puts and therefore indirectly affect the environment, complex impact upon critical natural resources across
whilst dietary choice has a direct effect on human multiple scales, including phosphorus, which must be
health. Consequently, there is mounting pressure to carefully considered.
alter dietary habits to help reduce GHG emissions, Phosphorus (P), is an essential nutrient and finite
excessive eutrophication and ecosystem decline, while resource that underpins global agricultural produc-
also tackling the proliferation of global undernour- tion but inefficiencies in its use within the food chain,
ishment, micro-nutrition deficiency and obesity (Fao and largely one-way open life cycle (from phosphate
2017, Baker 2019). Transition to more healthy plant- rock mines, to fertilizers, to fields, to foods, to sewers
based diets for adults has been widely advocated and eventually to waterways) is causing costly, long-
to help improve future environmental and human term degradation of our rivers and seas (Childers et al
© 2020 The Author(s). Published by IOP Publishing Ltd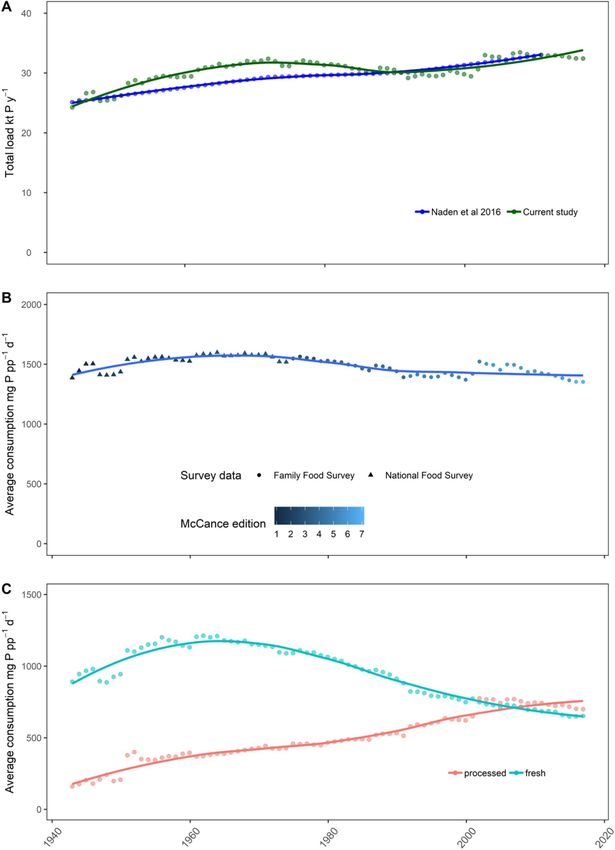
Environ. Res. Lett. 15 (2020) 094018                                                                   K J Forber et al

2011, Jarvie et al 2015). Livestock density is a major     Effluent discharge from WWTW is the dominant
driver of this P inefficiency and pollution due to the     eutrophication threat in many areas (Jarvie et al 2006,
extra land and fertiliser P required to produce animal     Mekonnen and Hoekstra 2018), and consideration of
feed and the difficulties of recycling livestock excreta   the WWTW P burden and consequences for effluent
evenly back to croplands (Leip et al 2015, Withers         P discharges to receiving waters is therefore critical for
et al 2020). Increasing global demand for animal food      improving water quality, especially under a changing
products has increased the demand for mined P by           climate (Forber et al 2018).
28% since 1961, and 90% of the environmental P                 With its wealth of historical dietary data, we use
footprint for an individual UK resident is due to          the UK to examine trends in dietary P consumption
animal product consumption (Metson et al 2012). As         and how selected scenarios of potential dietary change
such, transitioning towards a plant-based diet seems       might impact the P burden to WWTW and effluent
beneficial for P sustainability by reducing global P       discharges to water. Our aim was not to compare the
fertilizer demand and lowering eutrophication rates        healthiness of diets, but rather to quantify how cur-
by reducing individual P footprints (Macdonald et al       rent dietary trends (e.g. vegetarian, vegan and flexit-
2012, Metson et al 2012, Thaler et al 2015).               arian diets) and a recommended ‘healthy’ diet (EAT-
     There is already evidence suggesting meat-eaters      Lancet) might affect daily P intake and the P burden.
in Westernised Nations are considering plant-based         We explore three key questions:
foods. Sales of these foods increased 20% in the
US worth ~$3.3 billion in 2018 (Plant Based Foods          • How has the UK dietary P burden to WWTW
Association 2018). In the UK, sales of plant-based           changed over 74 years (1942–2016) and which
products increased 14.5% in 2017 (Ethical Consumer           food groups have contributed most to this change?
2018) and, in 2018, the UK food industry launched          • What would the impact of switching to more ‘sus-
more vegan products than any other nation (Min-              tainable’ diets be for the dietary P burden up to
tel 2019). The recent Ipsos Mori survey indicates that       2050?
vegetarian and vegan diets increased 360% between          • How might changes in dietary P burdens affect
2006 and 2016 in the UK, comprising now 3.25%                P discharges from WWTW and compliance with
of the population (Ipsos MORI 2016), whilst flexit-          regulatory targets for discharge P concentrations
arians are estimated to now comprise ~21% of the             by 2050?
population (Waitrose & Partners 2018). Such diet-
ary transitions may continue to rise in countries such     2. Methods
as the UK as consumers increasingly make dietary
changes due to concerns over human health, the             2.1. Trends in dietary P consumption in the UK
environment or animal welfare (Ethical Consumer            (1942-2016)
2018); noting of course that many emerging eco-            We estimated average dietary P consumption
nomies are still increasing per-capita consumption of      (mg P day−1 ) per person between 1942 and 2016
animal products.                                           based on the per capita consumption of different
     If food consumption patterns are to change            food types and their P content. This was necessary
towards plant-based diets, it is necessary to not only     because the UK National Diet and Nutrition Survey
look at how they may affect upstream resource use          does not report daily average P consumption. Food
and downstream eutrophication impacts, but also            consumption data were taken from the UK National
to better understand how these diet changes might          Food Survey (Defra 2011) for the period 1942–1973,
affect waste management capacity and the potential         and from the UK Family Food Survey for the period
to sustainably recycle P back into the food chain.         1974–2016 (including takeaway data) (Defra 2018).
Taking an historical perspective is one way to bet-        These surveys allowed quantification of both fresh
ter understand how diets have shifted, and may con-        and unprocessed food and processed food categories.
tinue to shift, and better evaluate the potential impact   Fresh and unprocessed foods included unprocessed
of a change in consumption of any one food type.           cereals, fresh fish, meat, dairy, eggs, vegetables and
In the case of P, there is some evidence that while        fruit. Processed foods included processed cereals,
plant-based products have significantly lower envir-       fish, meat, dairy, vegetables, fruit, sugars, other foods
onmental P footprints in terms of the fertilizer they      (canned soup, beverages and condiments), fats, and
require for production, they do result in more human       takeaway foods (e.g. on-the-go sandwiches, meals
P excretion (Metson et al 2016) because they contain       eaten out or bought at food outlets). Food quant-
twice as much P per gram of protein than animal-           ities for each category were then multiplied by the
based products (Jönsson et al 2004, Kalantar-Zadeh         P content of the edible portion of each food (there-
et al 2010). Consequently, a transition to plant-based     fore only accounting for actual consumed food) as
diets may increase the P burden entering wastewa-          detailed in McCance and Widdowson’s The Compos-
ter treatment works (WWTW) and the investment              ition of Foods Integrated dataset (Finglas et al 2015,
required to remove P in the influent and warrants          Public Health England 2015). Possible changes in the
further significant investigation (Metson et al 2016).     P content of foods over time were assessed by using

                                              2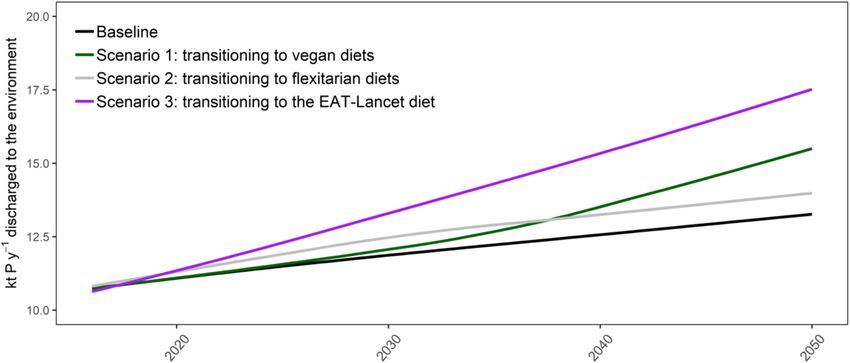
Environ. Res. Lett. 15 (2020) 094018                                                                 K J Forber et al

successive versions of the McCance and Widdowson          Service in the UK (NHS 2018). For a vegetarian diet,
databases (table S1), although it is recognised that      only the protein from meat and fish products was
this is only a crude indicator of changing mineral        replaced with beans and legumes. A flexitarian diet
composition (White and Broadley 2005). Where the          assumed meat and fish was consumed 3 d a week,
edible portion was not listed for a particular food, we   which equates to a 47% reduction in meat and fish
used the next editions edible portion data (table S1).    consumption compared to average 2016 consump-
Takeaway P content was compiled separately (table         tion habits in the UK. We therefore replaced the pro-
S2). The derived edible P content (mg P 100 g−1 ) was     tein from this 47% reduction in meat and fish with
multiplied by the amount consumed per day (mg)            beans and legumes. For a recommended healthy diet,
to give average P consumption (mg P day−1 ) per           we used the EAT-Lancet diet with median macro-
person for each food type. Trends in consumption          nutrient intake (g day−1 ) values, in which animal
were smoothed by loess regression analysis. Further       products contribute 25% (334 g) to the total nutri-
information on the food survey calculations, and the      ent intake per day or 12% of total calories (median
limitations of using food survey and food composi-        2425 kcal day−1 ), (table S3). Calculated daily dietary
tional data are discussed in Supplementary Informa-       P consumption for the five different diets along with
tion.                                                     their calorie and protein content is reported in Table
                                                          S4.
2.2. Trends in dietary P burden to WWTW in the                 Descriptions of the four scenarios incorporat-
UK (1942-2016)                                            ing changing proportions of these diets over time
To calculate the dietary P burden entering WWTW           are summarised in table 1. The baseline scenario
(kt P year−1 ), the per capita dietary P consumption      largely represents the average meat-based diet in the
was multiplied by UK population (Office for National      UK. Although scenario 1 assumes a predominantly
Statistics 2015) for the respective year and conver-      vegan population and such a transition is not without
ted to kilo tonnes (kt). As humans only retain ~6%        complexity, there is evidence that a strong decline
of consumed P during childhood years (2–17 years          in meat consumption is possible and even likely in
old), after which healthy adults remain in P homeo-       the UK (see Supplementary Information). Scenario 2
stasis and only absorb enough P to replace excreted       assumes flexitarian diets will become more popular,
‘old’ P they have consumed (Jönsson et al 2004), we       whilst scenario 3 represents a recommended healthy
assumed that estimates of total per capita P consump-     diet that helps to limit environmental impacts (Wil-
tion provide a suitable metric of per capita P excreted   lett et al 2019); it contains a diversity of plant foods,
and entering WWTW. Our estimates were validated           less animal foods, less saturated fat and less processed
by comparison to the average per capita P excreted        food, refined grains and sugars. Per capita annual P
(0.524 kg person−1 year−1 ) as reported by Naden          consumption rates (mg P per person year−1 ) for each
et al (2016), and the median value of other published     scenario were combined with the projected popula-
estimates (0.376–0.596 kg person−1 year−1 ) reviewed      tion rise in the UK for the years 2016 to 2050 (Office
by those authors. We did not include the negligible       for National Statistics 2017) to estimate the total diet-
amounts of P in wastewater arising from in-house          ary P load entering WWTW (kt P year−1 ) to 2050.
wastage of liquid foods.                                  Scenario analyses were not intended to be predictions
                                                          but to illustrate examples of the potential impact of
2.3. Dietary change scenario analysis (2016-2050)         dietary shifts on the P burden.
Potential changes to the wastewater P burden as a res-
ult of future dietary change up to 2050 were assessed
in four different scenarios which included a baseline     2.4. Discharges of wastewater effluent P to water
scenario. These scenarios required us to: (1) estim-      (2016-2050)
ate the per capita P consumption associated with          Discharges of wastewater effluent P to water from
five diets that would span a range of P sustainability    both WWTW and septic tanks for each dietary scen-
outcomes; (2) determine the proportions (%) of the        ario were calculated to provide an estimate of the
future UK population that follow these different diet     increased amount of P that will require removal. The
options; and (3) multiply these per capita rates by the   ca. 9288 WWTW in the UK were classified into six
total projected UK population over time.                  size bands according to their total treatment capa-
    A meat-based diet was based on the average daily      city (based on person equivalents (p.e.)), and their
P consumed in 2016 as calculated from the family          actual p.e. load requiring treatment (table S5 and
food survey. An average vegan dietary P consump-          S6). Total dietary P loads for each scenario (p.e. load
tion (mg P day−1 ) was calculated by substituting the     x daily P consumption per person) were combined
animal derived protein (meat, fish, dairy and eggs)       with estimated industry P contributions to calculate
consumed in the average meat-based diet with the          the total P load (kt yr−1 ) entering each size band
protein equivalent supplied by beans and legumes as       of WWTW (and septic tanks). Current rates of P
in Metson et al (2012), Metson et al (2016), and as       removal at different sized WWTW based on median P
recommended as an option by the National Health           retention factors for primary, secondary, tertiary and

                                             3
Environ. Res. Lett. 15 (2020) 094018 K J Forber et al
Table 1. Dietary change scenario descriptions.
Description
Baseline scenario The baseline scenario assumes no change in dietary consumption patterns of the pop-
ulation: 3.25% vegetarians (2.09%) and vegans (1.16%), and 96.75% eating the current
meat-based diet.
Scenario 1: transitioning to Scenario 1 assumes a predominantly vegan population in 2050. Initially the current ratio
vegan diets of vegan and vegetarians (1.16:2.09) does not change and the percent of the population
that is vegan or vegetarian increases 13% annually. The remaining percent of the popu-
lation consumes a meat-based diet until 2045 whereby none of the population consume
meat. At 2045 vegetarian diets decline at a rate of 13% a year, whilst veganism continues
to increase to constitute 70% of the population in 2050.
Scenario 2: transitioning to Scenario 2 assumes that 21% of the population is currently flexitarian (Waitrose & Part-
flexitarian diets ners 2018), the current percent of vegan (1.16%) and vegetarians (2.09%) does not
change, and meat-based diets decline as flexitarian diets increase by 13% annually until
2030 whereby meat-based diets remain stable at 10% of the population.
Scenario 3: transitioning to Scenario 3 assumes meat-eaters transition to the EAT-Lancet diet by 2050 (3% increase
the EAT-lancet diet a year in percent of population which has EAT-Lancet diet) and the current population
percent of vegetarians (2.09%) and vegans (2.26%) remains the same.
advanced P removal treatment technologies calcu- the band 5% and 6 works combined was 83%, min-
lated by Naden et al (2016) were then applied to these imum and maximum removal was 38.5% and 98.7%
loads to estimate the effluent discharge of P to water respectively. Average removal percent for the band 4
(kt yr−1 ) for each scenario to 2050. Further details of and 3 works combined was 82%, minimum and max-
WWTW size bands, p.e. capacities and loads, their P imum removal was 14 and 98% respectively. When
removal efficiencies, and calculation of industry con- the average outflow concentration exceeded either
tributions and septic tank discharges are given in Sup- 1 mg P l−1 (bands 5 and 6) or 2 mg P l−1 (bands 3
plemetary Information and table S5 and S6. and 4), we deemed the works to be non-compliant.
A t-test (assuming unequal variances) was performed
2.5. Dietary effect on P compliance targets at a to determine whether compliance of works was signi-
sub-set of WWTWs (2016-2050) ficantly different under the different dietary scenarios
To assess the impacts of the scenario changes in diet in the year 2050.
on river P compliance targets set by water regulators
under the EU Urban Wastewater Treatment Directive
(UWWTD), we investigated a subset (448) of the lar- 3. Results
ger WWTWs (>2000 p.e.) that have data on the p.e.
load entering the works, and the P inflow and out- 3.1. Historic dietary P consumption in the UK
flow concentrations for 2018. These 448 works are (1942-2016)
required to meet P outflow concentrations of either Since 1942, the total dietary wastewater P burden has
1 mg P l−1 or 2 mg P l−1 ; and already some works in increased to over 30 kt P yr−1 due to the increase
the UK are non-compliant with these current targets in the UK’s population (figure 1(a)), which rose
(table 2). We classified these works into size bands (3– from 47.9 million to 65.6 million in 2016. Despite
6) according to their p.e. capacity, and calculated the some annual fluctuations, there has been a general
percent of P removal for each individual works with small decline in average P consumption per person
records of P inflow/outflow concentration data (249 in recent years (figure 1(b)), which mirrors a general
works in bands 5 and 6, 47 works in bands 4 and 3) decline in total food consumed (figure S1 (available at
assuming no further investment in P removal tech- stacks.iop.org/ERL/15/094018/mmedia)). The con-
nologies; averages for each band are reported in table sumption of food increased as the nation recovered
2. We calculated the proportion of the total popula- from war-time shortages and rationing, until ~1950 s
tion served by each individual works for each scen- (~1600 g food person−1 d−1 ), when food survey
ario year assuming the total p.e. inflow capacity (L) data suggest a continual decline in consumption until
of the works does not change. We used this propor- the present day (2016, ~1400 g food person−1 d−1 ).
tion (%) to then calculate the total P load (kt P yr−1 , Total consumption of vegetables, dairy, and cereal
from people and industry) entering the 448 indi- based foods showed particular declines, whilst con-
vidual works in each band (3–6) for each dietary sumption of fruit showed a marked increase (figure
scenario to 2050. We then converted the P load to S1(a)). Phosphorus consumption (figure 1(b), figure
a P concentration (mg P l−1 ) entering these works S1(b)) peaked in 1963 at 1599 mg P day−1 (per per-
based on average per capita flow rates. Using the per- son) after which it decreased to 1354 mg P day−1
cent removal for individual works we calculated the in 2016; average P consumption over the period
outflow concentration. Average removal percent for was 1486 ± 70 mg P day−1 . This equates to
4Environ. Res. Lett. 15 (2020) 094018
Table 2. Average concentration of phosphorus (mg P l-a ) in influent and effluent from Urban Waste Water Treatment Works in the UK with P compliances (works must achieve effluent outflow P concentrations of 1 or 2 mg P l-a for
bands 5 and 6 or 4 and 3, respectively) in 2018, and the estimated percent removal of P from these works.
Influent P Effluent P
5
Target Total p.e. Average st.dev Average
Band BOD5 kg day-a p.e. capacitya mg P l-a No. works Capacity Total inflow l No. records mg P l-a mg P l-a No. records mg P l-a st.dev Average P
mg P l-a removal %
6 >1500 >25 000 1 200 18 074 264 3 614 852 800 128 6.91 1.89 194 0.99 0.50 85.7
5 >600, ≤1500 10 000–25 000 1 181 2 136 935 427 387 093 121 7.15 2.39 171 1.06 0.50 85.1
4 >120, ≤600 2000–10 000 2 62 303 308 60 661 600 46 7.17 2.84 62 1.17 1.64 83.7
3 >30,≤120 500–2000 2 3 5871 1 174 200 1 7.78 0.00 3 0.38 0.06 95.1
a
p.e., person equivalent expresses the average weekly load from industrial and domestic activities as equivalent to the load generated by a given number of people, where it is assumed that 1 person makes a contribution of
60 g BOD5 day−1 of organic biodegradable load and 200 l day−1 of wastewater flow (Butler Manufacturing Services 2013).
K J Forber et alEnviron. Res. Lett. 15 (2020) 094018 K J Forber et al
Figure 1. (A) Total phosphorus (P) load (kt P yr–1 ) entering wastewater treatment works from diets in the UK (1942-2016). Green
is our current study estimated load; blue is the estimated load in Naden et al (2016), both with loess regression lines. (B) Average
UK P consumption per person per day (mg P pp–1 d–1 ) using the UK National Food Survey (triangles), Family Food Survey
(circles), and the seven editions of the McCance and Widdowson food composition database, blue line is loess regression. (C)
Average UK P consumption per person per day (mg P pp–1 d–1 ) for total fresh foods (fresh vegetables, fruit, fish, milk, eggs, meat
and unprocessed cereals) and total processed foods (processed vegetables, fruit, fish, milk, meat, and cereals, sugars, other
products and takeaways), with loess regression lines.
0.494 kg P person−1 year−1 , which is compar- confidence that the data sources used here were reli-
able to the range of per capita P excretion (0.376– able. Until the late 1970 s, dietary P intakes from fresh
0.596 kg person−1 year−1 ) published in Naden et al foods increased but then subsequently declined due
(2016) calculated from multiple studies, giving us to an increase in the consumption of processed foods
6Environ. Res. Lett. 15 (2020) 094018 K J Forber et al
Figure 2. Average phosphorus (P) load to wastewater treatment works (kt P yr–1 ) from dietary scenarios 1, 2, 3 and baseline. Black
line is baseline scenario (no change in the current proportion of meat-eaters, vegetarians and vegans), blue line is the total P load
for each scenario. Purple, grey, red, green and yellow dashed lines are the load contributions from the EAT-Lancet, flexitarian,
meat-based, vegan and vegetarians’ diets, respectively, used in the scenarios.
(figure 1(c)). In 2016, 699 mg P day−1 came from pro- equated to an approximate 12% reduction, and a 15%
cessed foods (~52% of the total daily intake per per- reduction to dietary P intake from meat products (fig-
son), compared to 292 mg P day−1 in 1942 (~21% ure S1(b)). However, meat products are still the third
of the total daily intake) (figure 1(c)). In 1942, cer- largest contributor to total dietary P intake after dairy
eal products comprised 41% of the UK dietary P con- and cereals, and total P consumed in meat products
sumption (figure S1(b)), but this declined to 23% increased 28% from 1942 to 2016, most likely due
by 2016, with an increasing proportion coming from to the increased consumption of processed meats
processed cereal products (figure S2). (figure S2).
Consumption of dairy products overtook cereals
3.2. Contribution of animal products to the UK as the most significant contributor of the total diet-
diet (1942-2016) ary P intake in 1956 and peaked in 1963 (figure
Total animal product consumption per person S1(b)) before declining to 29% of dietary P intake
increased from 3252 g per week in 1942 to a peak of by 2016. High P containing products such as cheese,
4618 g per week in the late 1960 s and then declined yoghurt, and other milk products (e.g. dairy desserts
to 3008 g per week by 2016 (figure S1(a), figure S3). and milk drinks) have increased in their proportion
The overall contribution from meat, fish, dairy and of the average diet, whilst liquid whole milk con-
eggs to dietary P intake has therefore not changed sig- sumption declined 88% between 1974 and 2016 to
nificantly between 1942 and 2016, comprising 48% be largely replaced by skimmed milk products. How-
of the total dietary P intake in 1942 and 50% in 2016, ever, this switch to skimmed milk did not result in a
peaking at 59% in 1973 (figure S3). total increase in the dietary P intake from dairy but
Meat consumption per person increased 19% mediated the effect of such a large decline in liquid
from 1942 (746 g per week) to 2016 (891 g per milk consumption, keeping dairy as the most signific-
week), but peaked in 1980 (1160 g per week, a 56% ant contributor to both the total dietary P intake (fig-
increase since 1942). A gradual decline in total meat ure S1(b)) and the total dietary P intake from animal
consumption (figure S1(a)) between 2000 and 2016 products (figure S3).
7Environ. Res. Lett. 15 (2020) 094018 K J Forber et al
Figure 3. Phosphorus (P) discharges (kt P yr–1 ) from wastewater treatment works and septic tanks to water under 1, 2, 3 and
baseline scenarios (green, grey, purple and black lines, respectively).
3.3. Effect of dietary change on the P burden to is 5% more than the baseline scenario in 2050. How-
WWTW (2016-2050) ever, discharges of P in 2050 will be 17% more than
Assuming no change in the dietary habits of the the baseline scenario if 70% of the population is vegan
UK population, the P burden to WWTW is estim- and 30% is vegetarian (scenario 1), and 32% more if
ated to increase 23.8% over the period 2016 to 2050, 96% of the population is eating the EAT-Lancet diet
from 32.5 to 40.2 kt P yr−1 , and is accounted for (scenario 3).
by predicted population increase (figure 2, black
line). Adopting a predominantly vegan diet (scen- 3.5. Effect of dietary change on P compliance
ario 1) would increase the P burden by 45% from targets at a sub-set of WWTWs (2016-2050)
32.5 kt P yr−1 in 2016 to 47.2 kt P yr−1 in 2050. The scenario analysis assumes the p.e. received at the
This is a 17% increase in P burden compared to the individual works does not change and that no fur-
baseline scenario in 2050. A predominantly flexit- ther investment by the water industry is made to
arian diet would increase the dietary P burden in 2050 increase the efficiency of existing P-removal techno-
to 42.6 kt P yr−1 from 33 kt P yr−1 , a 6% increase logies (average 83%–95% removal efficiency, table
compared to the baseline scenario in 2050. The EAT- 2) at the sub-set of WWTWs we analysed. By 2050,
Lancet diet would increase the dietary P burden by 65, 61, 73 and 57% of the selected WWTWs will be
67% from 32.5 kt P yr−1 in 2016 to 54.4 kt P yr−1 non-compliant under scenario 1 (vegan), 2 (flexit-
in 2050, an increase of 35% compared to the baseline arian), 3 (EAT-Lancet) and the baseline respectively.
scenario (figure 2.3). This scenario results in the The baseline and flexitarian diet demonstrate relat-
largest change in dietary P burden. ive effluent P concentration stability (and are not
significantly different, t = 0.99, p > 0.05, figure 4)
3.4. Effect of dietary change on discharges of compared to the vegan and EAT-Lancet diets, as the
wastewater effluent P to water (2016-2050) change in dietary effect is less than the change in pop-
This analysis assumes WWTWs will always have the ulation effect; meaning that P load to the WWTW
capacity to deal with the increase in population to does not increase more than the litres of water pro-
2050, but assumes that the percent of works with duced by the population served, hence concentration
either primary, secondary, tertiary or P-removal tech- remains stable. Both the vegan (t = 2.74, p < 0.05)
nologies does not change. If diets do not change (the and EAT-Lancet diets (t = 5.13, p < 0.05) significantly
baseline diet), effluent discharges to water are estim- increase the number of non-compliant works in the
ated to increase by 24% from 10.7 to 13.3 kt P yr−1 year 2050 compared to the baseline scenario.
in 2050. Our analyses suggests that if the population
were to become predominantly vegan (scenario 1), 4. Discussion
or eat the EAT-Lancet diet (scenario 3) by 2050, dis-
charges of P to water from septic tanks and WWTW Historically, the largest change we identified in the
could increase by 44 and 64% compared to 2016 levels per capita dietary P intake across the UK was a shift
to 15.4 and 17.5 kt P yr−1 , respectively (figure 3), in diet composition, in particular a shift from fresh
assuming current rates of P removal. A 31% increase to processed foods, which increased from 21% to
in discharges to 14 kt P yr−1 is likely by 2050 for ~52% of the diet by 2016 (figure 1(c)). This distinct-
flexitarian diets (which reach a peak in 2029), which ive change is a common trend in westernised nations
8Environ. Res. Lett. 15 (2020) 094018 K J Forber et al
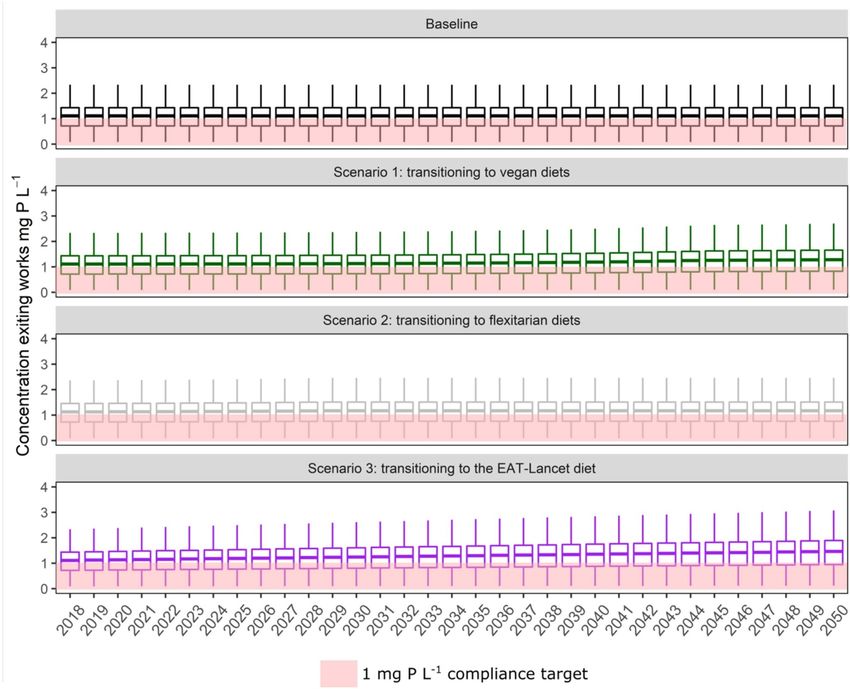
Figure 4. Concentration of phosphorus (P) (mg P L–1 ) exiting UK band 5 and 6 works (total 249 works) which have a 1 mg P L–1
discharge consent (listed by the Environment Agency in 2018 and under the Urban Wastewater Treatment Directive) under 1, 2, 3
and baseline scenarios. Outliers above the 99th percentile have been removed, middle box line is the median, the upper and lower
hinges are the first and third quartiles (0.25 and 0.75), the whiskers extend to the highest or lowest values within 1.5∗ interquartile
range of the respective hinge.
today (Cooke 2017) and a threat to public health, as redundant and consequently yield greater amounts
globally poor diet is considered to be a greater risk of excreted P which requires costly treatment, dis-
to mortality and morbidity than alcohol, drug use, posal or recycling (Withers et al 2018, British Nutri-
tobacco and unsafe sex combined (Willett et al 2019). tion Foundation 2019). Reducing per capita con-
Increased consumption of processed foods would be sumption of processed foods would help to reduce
expected to increase the dietary P intake, because of daily P intake and improve population health and
the inclusion of food additives containing P which has wellbeing (Willett et al 2019), but requires sufficient
increased dramatically in the 20th century (Molins access to healthy, nutritious foods. Ironically, a trans-
1991, Gutiérrez 2013). The potential for such foods ition to more environmentally sustainable diets by
to be under accounted for in the food surveys may substituting beans and legumes for meat and dairy
account for the slight decline in dietary P consump- would increase daily P intakes by some consider-
tion since the 1970 s, and more accurate accounting able margin (e.g. over 20% for a vegan diet, Table
of processed foods would likely suggest that average S4). The EAT-Lancet diet gave the largest increase
dietary P consumption in the UK has remained relat- in per capita P intake due to the inclusion of whole
ively stable since 1942 at around 1500 g P day−1 (fig- grains and nuts. Whilst the calorie contents of our five
ure 1(b)). Very similar average daily P intakes have diets are well aligned to current dietary reference val-
been reported in the USA (National Academy of Sci- ues (2000–2500 kcals, Public Health England 2018),
ences, 1997). the protein contents of all the diets were well above
This level of per capita P intake for the average recommended reference values (45–56 g day−1 , Brit-
UK diet, or indeed any of the diets used in our scen- ish Nutrition Foundation 2019). Further exploration
ario analysis, are not above the European Food Safety of dietary composition is needed to identify healthy
Agency identified Acceptable Daily Intake (ADI) of diets that are not only more environmentally sustain-
P at 2800 mg P day−1 (EFSA 2019). However, such able but also do not result in unduly high P burdens
high levels of P intake are excessive, nutritionally entering WWTW.
9Environ. Res. Lett. 15 (2020) 094018 K J Forber et al
Our results show that although population deemed a chaotic and wasteful food system (Withers
growth, and not changes in an individual’s total food et al 2020). If as other studies suggest, environmental
P consumption, have driven historical increases in P footprints can be reduced by 20%–72% by trans-
UK wastewater P burdens, the proposed changes itioning to more plant-based diets (Thaler et al 2015,
towards more environmentally sustainable plant- Metson et al 2016), then ‘pre-consumption P’ which
based diets in the future could cause substantial is notoriously difficult to recover and reuse is min-
increases in this dietary P burden (figure 2). For the imised whilst ‘post-consumption P’ increases. This
predominantly vegan or EAT-Lancet diet, the P bur- ‘post-consumption P’ could be argued as more recov-
den would increase by 17 and 35% to 47.2 kt P yr−1 erable as we know the location (wastewater works)
and 54.4 kt P yr−1 , respectively in 2050 compared to and the technology required to recover it. Indeed, UK
the baseline scenario. Metson et al (2016) found that wastewater companies are expected to play a greater
the average person in an Australian city changing to role in environmental protection whilst limiting any
a predominantly plant based diet would increase the additional costs to consumers in order to maintain
wastewater P burden from diets by around 8% (per their licenses to operate (Ofwat 2019). If the poten-
capita). Previous studies have indicated that vegetari- tial recoverability of wastewater P is enhanced to
ans have lower P wastewater burdens (Cordell et al produce more concentrated fertilizer products that
2009), but these assumed that diets are often aug- can be transported longer distances than biosolids,
mented by high intakes of carbohydrates rather than then this may enable more P circularity in our food
by intake of high-protein beans and pulses (Draper systems and reduce society’s reliance on imported,
et al 1993). Perhaps surprisingly, we did not identify finite mineral P (Tonini et al 2019, Withers 2019). For
any significant increase in the proportional P bur- example, Tonini et al (2019) concluded that the health
den related to the consumption of animal products and environmental co-benefits of using recovered
since 1942: animal product consumption increased fertiliser-grade P from wastewater were greater than
between 1942 and the late 1960 s but decreased after those of using bioresource-grade P (e.g. biosolids),
2000, a trend also observed in Western Europe (de especially in highly populated regions.
Gavelle et al 2019). Yet animal products still contrib-
ute 50% of the wastewater P burden in the UK. 5. Conclusions
The increased discharges of P from WWTWs due
to the changes in diet presented here (figures 3 and 4) Individual dietary P consumption in the UK declined
pose two major challenges to the wastewater industry. slightly between 1942 and 2016, but the P load to
Firstly, the removal of an increased P load to WWTWs WWTW still increased due to an increase in popula-
to meet increasingly stringent compliance targets for tion. Contributions from animal-based foods to the
discharge P concentrations would require signific- total per capita dietary P intake did not significantly
ant investment in new works, and the introduction increase over this time period, but the contribution
of new technologies to improve P removal efficien- of processed foods increased dramatically, compris-
cies (currently 83%–95%). As an example, previous ing ~52% of the diet in the UK in 2016. Although
estimates have suggested that for a works of >1 mil- reducing animal products in diets is an effective way
lion p.e. (only 7 works in the UK listed under the for UK consumers to reduce their P, and other envir-
UWWTD) to achieve the 1 mg P l−1 compliance onmental footprints (e.g. Leach et al 2016, González-
target, chemical precipitation would involve costs of García et al 2018, Vanham et al 2018), these foot-
~£2 m capital expenditure and ~£0.2 m a year of prints are not the only metric that must be taken into
operational expenditures, whilst ecological removal account when planning for a more sustainable food
methods would cost twice as much (Cooper 2014). system. Our analysis demonstrates that widespread
The second major challenge is the recycling of much adoption of plant-based or ‘healthier’ diets (such
larger volumes of biosolids to agricultural land after as veganism and the EAT-Lancet diet), will greatly
advanced treatment. Biosolid recycling back to the increase daily P intake and therefore impose higher
food chain is already constrained in a number of dietary P burdens on WWTW, which in turn would
regions by concerns over their longer-term impacts increase point-source P discharges to water if not
on human health and the environment (Clarke and recovered. However, our findings do not diminish the
Smith 2011, Collivignarelli et al 2019). Although, overarching global environmental value of reducing
nearly 80% of total biosolid production is recycled to meat production and intake since post-consumption
agricultural land in the UK (ABS 2018), there is a lim- P-recovery is much more feasible than the recovery
ited landbank available and further biosolids loading of much more highly dispersed P pre-consumption.
to soils will exacerbate regional soil P accumulation Indeed, in terms of water quality impairment, there
and could increase the risk of diffuse losses of P to are wider and more difficult non-point P source con-
water in some areas, especially under a changing cli- tributions to control from agriculture, and in areas
mate (Ockenden et al 2017, Forber et al 2018). of intensive livestock farming in particular, related
Yet, this poses an interesting policy opportunity to surplus P accumulation and recycling manures
for ‘knowing where the P is’ in what can currently be in catchments (Withers et al 2014, Leip et al 2015,
10Environ. Res. Lett. 15 (2020) 094018 K J Forber et al
Shore et al 2016). Instead, we attempt to highlight the https://www.butlerms.com/
increasingly important role of the wastewater indus- sewage-parameters-3-population-equivalent-pe-part-2/
Childers D L, Corman J, Edwards M and Elser J J 2011
tries in the drive towards P sustainability through the
Sustainability challenges of phosphorus and food: solutions
provision of renewable fertilizers as part of a circular from closing the human phosphorus cycle BioScience 61
nutrient economy. Wastewater treatment works with 117–24
P removal, and the efficiency of P removal technolo- Clarke B O and Smith S R 2011 Review of ‘emerging’ organic
contaminants in biosolids and assessment of international
gies, will clearly need to increase to meet increasingly
research priorities for the agricultural use of biosolids
stringent regulatory compliance targets for P to com- Environ. Int. 37 226–47
bat the costly eutrophication of inland and coastal Collivignarelli M C, Canato M, Abbà A and Carnevale Miino M
waters. Reducing excess food intake and wastage 2019 Biosolids: what are the different types of reuse J.
Cleaner Prod. 238 117844
and consuming fresh food instead of processed food
Cooke A 2017 Dietary food-additive phosphate and human health
would help to minimise both the pre-consumption outcomes Compr. Rev. Food Sci. Food Saf.
demand for P and the post-consumption P burden on 16 906–1021
the wastewater industry. Cooper J 2014 Managing phosphorus in the UK water industry to
increase national resource security PhD Thesis (The
University of Birmingham)
Acknowledgments Cordell D, Drangert J O and White S 2009 The story of
phosphorus: global food security and food for thought
Global Environ. Change 19 292–305
This paper was produced as part of the RePhoKUs de Gavelle E, Davidenko O, Fouillet H, Delarue J, Darcel N,
project (The role of phosphorus in the sustainabil- Huneau J-F and Mariotti F 2019 Self-declared attitudes and
ity and resilience of the UK food system) funded by beliefs regarding protein sources are a good prediction of the
degree of transition to a low-meat diet in France Appetite
BBSRC, ESRC, NERC, and the Scottish Government
142 104345
under the UK Global Food Security research pro- Defra 2011 National food survey. National Archives
gramme (Grant Nos. BB/R005842/1). We would like https://webarchive.nationalarchives.gov.uk/20130103024
to acknowledge the use of data relating to WWTW 837/http://www.defra.gov.uk/statistics/foodfarm/
food/familyfood/nationalfoodsurvey/
provided by the Environment Agency and in partic-
Defra 2018 Family food datasets. Department for Environment,
ular the contributions from Sally Richardson, Linda Food and Rural Affairs https://www.gov.uk/government/
Pope and Paul Simmonds. Thanks are also due to statistical-data-sets/family-food-datasets
Miller Alonso Camargo-Valero, Leeds University and Draper A, Lewis J, Malhotra N and Wheeler L E 1993 The energy
and nutrient intakes of different types of vegetarian: a case
two anonymous referees who provided useful com-
for supplements Br. J. Nutr. 69 3–19
ments on the manuscript. EFSA 2019 EFSA issues new advice on phosphates European Food
Safety Authority. Parma, Italy http://www.efsa.europa.
eu/en/press/news/190612
Ethical Consumer 2018 Ethical Consumer Markets Report
Data availability statement https://www.ethicalconsumer.org/sites/default/files/inline-
files/EC%20Markets%20Report%202018%20FINAL.pdf
Any data that support the findings of this study are FAO (Food and Agriculture Organisation) 2017 The Future of
Food and Agriculture – Trends and Challenges (Rome: FAO)
included within the article. Finglas P M, Roe M A, Pinchen H M, Berry R, Church S M and
Dodhia S K 2015 McCance and Widdowson’s the Composition
ORCID iDs of Foods 7th Summary Edn (Cambridge: The Royal Society
of Chemistry)
Forber K J, Withers P J A, Ockenden M C and Haygarth P M 2018
K J Forber https://orcid.org/0000-0001-7182-9586
The phosphorus transfer continuum: a framework for
S A Rothwell https://orcid.org/0000-0002-3919- exploring effects of climate change Agric.. Environ. Lett. 3
6077 1–5
G S Metson https://orcid.org/0000-0002-8081- González-García S, Esteve-Llorens X, Moreira M T and Feijoo G
2018 Carbon footprint and nutritional quality of different
2126
human dietary choices Sci. Total Environ. 644 77–94
H P Jarvie https://orcid.org/0000-0002-4984-1607 Gutiérrez O M 2013 Sodium- and phosphorus-based food
P J A Withers https://orcid.org/0000-0002-1153- additives: persistent but surmountable hurdles in the
0328 management of nutrition in chronic kidney disease Adv.
Chronic Kidney Dis. 20 150–6
Ipsos MORI 2016 Vegan society https://www.ipsos.com/ipsos-
References mori/en-uk/vegan-society-poll
Jarvie H P, Neal C and Withers P 2006 Sewage-effluent
ABS 2018 Biosolids Recycling – past, present and future. Assured phosphorus A Greater Risk to River Eutrophication than
Biosolids Limited https://assuredbiosolids.co.uk/wp- Agricultural Phosphorus Sci. Total Environ.
content/uploads/2018/05/Biosolids-Past-Present-Future.pdf 360 246–53
Baker C 2019 Obesity Statistics. House of Commons Briefing Jarvie H P, Sharpley A N, Flaten D, Kleinman P J A, Jenkins A and
Paper No. 3336 https://commonslibrary. Simmons T 2015 The pivotal role of phosphorus in a
parliament.uk/research-briefings/sn03336/ resilient water–energy–food security nexus J. Environ. Qual.
British Nutrition Foundation 2019 Nutrition Requirements 44 1049–62
https://www.nutrition.org.uk/attachments/article/261/ Jönsson H, Richert Stintzing A, Vinnerås B and Salomon E 2004
Nutrition%20Requirements_Revised%20August%202019.pdf Guidelines on the Use of Urine and Faeces in Crop Production
Butler Manufacturing Services 2013 Sewage parameters 3: (Stockholm: EcoSanRes Programme, Stockholm
population equivalent (PE) part 1 Environment Institute)
11Environ. Res. Lett. 15 (2020) 094018 K J Forber et al
Kalantar-Zadeh K et al 2010 Understanding sources of dietary https://www.ofwat.gov.uk/wp-content/uploads/2019/05/
phosphorus in the treatment of patients with chronic kidney Ofwats-emerging-strategy-Join-the-conversation.pdf
disease Clin. J. Am. Soc. Nephrol. 5 519–30 Plant Based Foods Association 2018 Plant-based food sales grow
Le Quéré C et al 2015 Global carbon budget 2014 Earth Syst. Sci. 20 percent https://plantbasedfoods.org/plant-based-foods-
Data 7 47–85 sales-grow-20-percent/
Leach A M et al 2016 Environmental impact food labels Poore J and Nemecek T 2018 Reducing food’s environmental
combining carbon, nitrogen, and water footprints Food impacts through producers and consumers Science 360 987
Policy 61 213–23 Public Health England 2015 The Composition of Foods Integrated
Leip A et al 2015 Impacts of European livestock production: Dataset (London: Public Health England) pp 133–55
nitrogen, sulphur, phosphorus and greenhouse gas Public Health England 2018 The Eatwell Guide
emissions, land-use, water eutrophication and biodiversity https://assets.publishing.service.gov.uk/government/
Environ. Res. Lett. 10 115004 uploads/system/uploads/attachment_data/file/
Macdonald G K, Bennett E M and Carpenter S R 2012 Embodied 742750/Eatwell_Guide_booklet_2018v4.pdf
phosphorus and the global connections of United States Shore M, Jordan P, Melland A R, Mellander P-E, Mcdonald N and
agriculture Environ. Res. Lett. 7 44024 Shortle G 2016 Incidental nutrient transfers: assessing
Mekonnen M M and Hoekstra A Y 2018 Global anthropogenic critical times in agricultural catchments using
phosphorus loads to freshwater and associated grey water high-resolution data Sci Total Environ. 553 404–15
footprints and water pollution levels: A high- Springmann M, et al 2018 Options for keeping the food system
resolution global study Water Resour. Res. within environmental limits Nature 562 519–25
54 345–58 Springmann M, Godfray H C J, Rayner M and Scarborough P
Metson G S, Bennett E M and Elser J J 2012 The role of diet in 2016 Analysis and valuation of the health and climate
phosphorus demand Environ. Res. Lett. change cobenefits of dietary change Proc. Natl Acad. Sci. 113
7 044043 4146–51
Metson G S, Cordell D and Ridoutt B 2016 Potential impact of Thaler S, Zessner M, Weigl M, Rechberger H, Schilling K and
dietary choices on phosphorus recycling and global Kroiss H 2015 Possible implications of dietary changes on
phosphorus footprints: the case of the average Australian nutrient fluxes, environment and land use in Austria Agric.
city Front. Nutri 3 35 Syst. 136 14–29
Mintel 2019 #Veganuary: UK overtakes Germany as world’s leader Tilman D, Cassman K G, Matson P A, Naylor R and Polasky S
for vegan food launches Mintel Group Ltd 2002 Agricultural sustainability and intensive production
https://www.mintel.com/press-centre/food-and- practices Nature 418 671–7
drink/veganuary-uk-overtakes-germany-as-worlds-leader- Tonini D, Saveyn H G M and Huygens D 2019 Environmental and
for-vegan-food-launches health co-benefits for advanced phosphorus recovery Nat.
Molins R 1991 Phosphates in Food (New York: Routledge) Sustainability 2 1051–61
Naden P, Bell V, Carnell E, Tomlinson S, Dragosits U and Vanham D, Comero S, Gawlik B M and Bidoglio G 2018 The water
Chaplow J, May L and Tipping E 2016 Nutrient fluxes from footprint of different diets within European sub-national
domestic wastewater: a national-scale historical perspective geographical entities Nat. Sustainability 1 518–25
for the UK 1800–2010 Sci. Total Environ. Waitrose & Partners 2018 Food and Drink Report 2018-19: The
572 1471–84 era of the mindful consumer (Bracknell: Waitrose &
National Academy of Sceinces 1997 SCFII Adjusted Data for Partners)
Calcium, Phosphorus and Magnesium, Appendix D White P J and Broadley M R 2005 Historical variation in the
https://www.ncbi.nlm.nih.gov/books/NBK109813/ mineral composition of edible horticultural products J.
NHS 2018 The vegan diet: eat well Hortic. Sci. Biotechnol. 80 660–7
https://www.nhs.uk/live-well/eat-well/the-vegan-diet/ Willett W, et al 2019 Food in the anthropocene: the EAT-Lancet
Ockenden M C, et al 2017 Major agricultural changes required to Commission on healthy diets from sustainable food systems
mitigate phosphorus losses under climate change Nat. Lancet 393 447–92
Commun. 8 161 Withers P J A 2019 Closing the phosphorus cycle Nat.
Office for National Statistics 2015 Mid-1851 to Mid-2014 Sustainability 2 1001–2
population estimates for United Kingdom: total persons, Withers P J A, Doody D G and Sylvester-Bradley R 2018
quinary age groups and single year of age; estimated resident Achieving sustainable phosphorus use in food systems
population. Population Estimates Unit, Population Statistics through circularisation Sustainability 10 1804
Division, Office for National Statistics, Segensworth Road, Withers P J A, Forber K J, Lyon C, Rothwell S, Doody D G and
Fareham, PO15 5RR Jarvie H P, et al 2020 Towards resolving the phosphorus
Office for National Statistics 2017 2016-based National Population chaos created by food systems Ambio 49 1076–89
Projections. (Fareham: Office for National Statistics) Withers P J A, Neal C, Jarvie H P and Doody D G 2014
Ofwat 2019 Ofwat’s Emerging Strategy: Join the Conversation Agriculture and eutrophication: where do we go from here?
(Birmingham: Ofwat, Centre City Tower) Sustainability 6 5853–75
12You can also read