Plasma Rich in Growth Factors (PRGF) in the Treatment of Cervical and Lumbar Back Pain: A Retrospective Observational Clinical Study
←
→
Page content transcription
If your browser does not render page correctly, please read the page content below
Pain Physician 2021; 24:E649-E660 • ISSN 2150-1149

    Retrospective Study

                   Plasma Rich in Growth Factors (PRGF) in the
                   Treatment of Cervical and Lumbar Back Pain: A
                   Retrospective Observational Clinical Study

                            Fernando Kirchner, MD1, Isidro Milani, MD1, Àlex Martínez, MD1, Nicolas Kirchner-Bossi, PhD2,
                            Roberto Prado, PhD3-5, Sabino Padilla, PhD3-5, and Eduardo Anitua, PhD3-5

  From: 1Barcelona Traumatology        Background: Plasma rich in growth factors (PRGF) is a leukocyte-free platelet-rich plasma (PRP)
   Institute, Mataró, Spain; 2École    that is an effective biological approach to tissue repair and has been demonstrated to significantly
        Polytechnique Fédérale de
      Lausanne (EPFL), Lausanne,       improve multiple conditions, including low back pain and degenerative disc pathology.
Switzerland; 3BTI - Biotechnology
   Institute ImasD, Vitoria, Spain;    Objectives: The objective of this retrospective study was to analyze the effectiveness of treating
 4
  Eduardo Anitua Foundation for        both cervical and lumbar spine pain with minimally invasive infiltrations of PRGF-Endoret.
     Biomedical Research, Vitoria,
    Spain; 5University Institute for   Study Design: Retrospective study design.
       Regenerative Medicine and
       Oral Implantology - UIRMI       Setting: Outpatient private practice facility.
  (UPV/EHU-Fundación Eduardo
                    Anitua), Spain
                                       Methods: The effectiveness of PRGF has been assessed by patient-reported outcomes (PRO)
       Address Correspondence:         through validated questionnaires, namely Numeric Rating Scale (NRS) for back pain, Spine Tango
           Eduardo Anitua, PhD         Core Outcome Measure Index (COMI) Questionnaire for lumbar and cervical pain, and OSWESTRY
  Eduardo Anitua Foundation for        Disability Index questionnaire for lumbar pain cases. Score differences between pre- and post-
    Biomedical Research, Jacinto
                                       treatment have also been assessed stratified for multiple sub-groups of patients based on the
                  Quincoces, 39
            01007 Vitoria, Spain       sector of the column treated, gender, and age.
             E-mail: eduardo@
    fundacioneduardoanitua.org         Results: This study includes 65 patients (18 with cervical pain and 47 with lumbar back pain).
                                       The average time of back pain evolution was 10 years. Patients received at least 2 PRGF infiltration
Disclaimer: There was no external      series about one month apart. Each patient received intervertebral disc and epidural infiltrations,
funding in the preparation of this
                     manuscript.       root infiltrations, in case of radicular injury, and intraarticular infiltrations, in case of osteoarthritis
                                       of the facet joints. Results show statistically significant (P < 0.05) improvements on all analyzed
  Conflict of interest: The authors    scores. Regarding the stratified analyses, 249 (99%) sub-groups showed an improvement in all
   declare that EA is the Scientific   tests (252 cases overall). From the 249 improving cases, 154 (62%) showed a statistically significant
    Director of and SP and RP are
   scientists at BTI Biotechnology
                                       difference between the pre- and the post- treatment periods.
 Institute ImasD, a biotechnology
 company that investigates in the      Limitations: This research is a retrospective study with a relatively small sample cohort. Only PRO
   fields of regenerative medicine     have been assessed.
   and PRGF-Endoret technology.
                                       Conclusions: According to the results obtained in this study, and taking into account their
 Manuscript received: 10-14-2020       limitations, PRGF infiltrations are an effective and minimally invasive biological strategy in the
   Revised manuscript received:
                      12-14-2020       treatment of both cervical and lumbar pain, evaluated according to PRO.
       Accepted for publication:
                      01-08-2021       Key words: Back pain, degenerative disc disease, growth factors, intervertebral disc degeneration,
                                       plasma rich in growth factors, platelet-rich plasma, regenerative medicine, tissue engineering
           Free full manuscript:
  www.painphysicianjournal.com         Pain Physician 2021: 24:E649-E660

C       ervical and low back pain are conditions that
        affect an increasing number of individuals, in
        part, as a result of the increase in life span, as
well as sedentary lifestyles (1). According to the last
                                                                              Global Burden of Disease, back and neck pain present
                                                                              the world’s largest disease burden related to years lived
                                                                              with disability and is overall the fourth leading cause
                                                                              of disability adjusted life years (2,3). The overall point

                                                    www.painphysicianjournal.com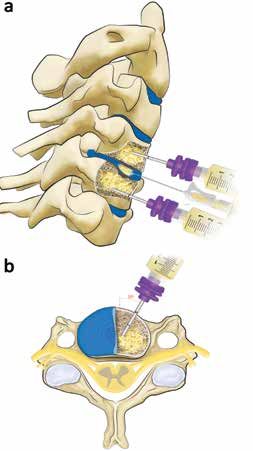
Pain Physician: August 2021 24:E649-E660

prevalence mean in the general population is estimated        to the STROBE Statement guidelines (22). Anonymized
at approximately 7% for cervical pain and 14% for low         database of patients with lumbar and cervical pain due
back pain (4,5); both conditions have high recurrence         to different lesions and who received medical treat-
rates (6). From the economic standpoint and taking            ment with PRGF infiltrations in the Barcelona Trauma-
into account the data from the US, neck and low back          tology Institute and Eduardo Anitua Clinic between
pain account for the third-highest amount of health           January 2016 and June 2019, were retrospectively
care spending ($87.6 billion in 2013), and is the second-     reviewed. Patients provided informed written consent
leading condition that increased its spending between         and were treated according to the clinical protocol of
1996 and 2013, with $64.4 billion spent over 18 years         the centres. This study was performed in accordance
(7). Therefore, there is a need to find cost-effective        with the international ethical standards from the lat-
treatments for these conditions.                              est revised World Medical Association Declaration of
      Minimally invasive biological approaches have           Helsinki (Brazil, 2013) (23).
emerged to overcome the limitations of current treat-              The inclusion criteria are as follows: patients of
ments and speed up recovery times (8,9). Among them,          both genders, aged between 18 and 76 years, with
autologous platelet-rich plasma (PRP) therapies have          symptoms of low back pain or cervicalgia, of at least
been included in the treatment of chronic low back            3 months of evolution, that have not responded to
pain (10), being applied through minimally invasive           drug treatment, diagnosed by Magnetic Resonance
techniques to specific spinal structures for the treat-       Imaging (RMI), with a minimum of one month of
ment of degenerative disc pathology (11-16), in order         follow-up, and who have completed all baseline and
to suppress the low-grade inflammation and restore            follow-up questionnaires. Patients with the following
homeostasis (17). However, to the best of our knowl-          scenarios are included: 1) degeneration of the lumbar
edge, the description of treatment of cervical spine          IVD, classified in the Pfirrmann’s system between 3 and
pain with PRP is limited to one case report (18).             4 (24); 2) degeneration of the cervical IVD according
      Plasma rich in growth factors (PRGF) technology         to the classification of Miyazaki (25) or Suzuki (26); 3)
has been widely used as a minimally invasive biological       positive signs visible on MRI, including rupture of the
approach to induce tissue repair and improve numer-           annulus fibrosus, annular fissure, with or without a
ous clinical conditions of musculoskeletal system (19),       herniated disc; 4) presence of sciatica or brachialgia
including spinal structures (20,21). The treatment of         produced by radicular compression, due to the direct
spine pathologies with PRGF, namely protrusion and            compressive effect of the herniated disc; 5) patients
herniated intervertebral disc (IVD); spinal roots; neuritis   with indirect trauma with mechanical disc overload; 6)
produced by radicular compression, due to the direct          patients who have finally relapsed after previous treat-
compressive effect of the herniated disc; etc, provides       ments with analgesic medications, muscle relaxants,
pain attenuation, chondroprotection, and anti-inflam-         and anti-inflammatories; 7) lumbar fracture, extruded
matory effect (17).                                           herniated discs, and hernias with signs of calcification;
      We have previously published a retrospective            8) endplate lesions as Modic changes (MC) type 1-3, or
study evaluating only low back pain, using a simple           other subchondral lesions (hernias of Shmörl); and 9)
score, visual analogue scale (21). The aim of the current     patients who have undergone previous spinal surgery
retrospective study was to analyze the effectiveness of       or rhizolysis.
treating both cervical and lumbar spine pain with PRGF             Exclusion criteria includes patients with severe car-
infiltrations, as assessed by patient-reported outcomes       diovascular diseases, central nervous system diseases,
(PRO), through validated questionnaires, namely Nu-           epilepsy, coagulopathies, immunological diseases, in-
meric Rating Scale (NRS) for back pain, the Spine Tango       fectious diseases, morbid obesity, cancer, etc; history of
Core Outcome Measure Index (COMI) Questionnaire               drug use and mental illness or psychological conditions
for lumbar and cervical pain cases, and the Oswestry          related to pain; pregnant or breastfeeding women;
Disability Index questionnaire for lumbar cases.              and pathologies that produce alteration of coagulation
                                                              or platelets.
Methods
                                                              PRP Preparation
Study Design and Patients                                        PRP was prepared according to the PRGF-Endoret
    This retrospective study was performed according          method (27,28). Peripheral venous blood was with-

E650                                                                                        www.painphysicianjournal.com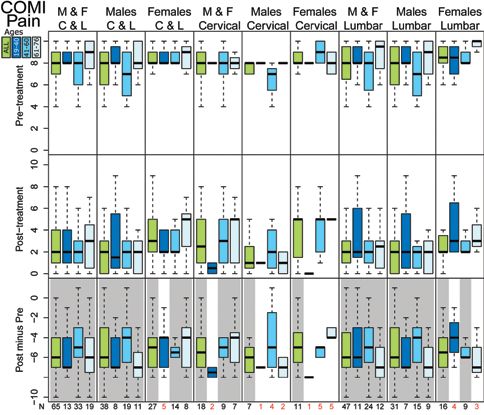
PRGF in the Treatment of Cervical and Lumbar Back Pain
drawn (72 mL) and collected in 9-mL tubes containing the access needed to perform epidural infiltration. It
sodium citrate (3.8% wt/vol) (Endoret Traumatology was advanced to the posterior wall, passing 1 - 1.5 mm
kit, BTI Biotechnology Institute, S.L., Vitoria, Spain). behind it, and then very slowly 1.5 mL of activated PRGF
Subsequently, the tubes were centrifuged in the PRGF- was infiltrated. In the case of the joints, the lateral ap-
Endoret System centrifuge. The 2 mL plasma fraction proach was taken under fluoroscopic control and 1 mL
located just above the buffy coat (F2 fraction) was col- of activated PRGF was infiltrated with a short needle
lected without aspirating leukocytes or erythrocytes. (Spinal Needle Quincke).
Activation of PRGF was performed just before infiltra- Finally, intraosseous intravertebral infiltration (20)
tion by adding PRGF activator (10% calcium chloride). was performed when the injured disc (protrusion, her-
nia, or intervertebral collapse) was in close contact with
Antibiotic Prophylaxis and Sedation one or both of the neighbouring vertebrae, whose
After the blood collection, 2 g of cefazolin was endplates also showed lesions, such as large Schmorl’s
administered. An anaesthetist performed mild intrave- nodes on one endplate or both (29), detectable osseous
nous sedation with a combination of 2.5 mg of Mid- subchondral edema, recent or old fractures, or end-
azolan hydrochloride (1 mg/mL, Normon Laboratories, plate lesions with advanced MC 1-3 signs. The approach
Madrid, Spain) and 3.2 mg/kg of fentanyl citrate (0.05
mg/mL, Kern Pharma, Barcelona, Spain) in 100 mL of
saline. Additionally, depending on the duration of the
procedure, a single dose, or repeated doses of 1-2 mg/
kg Propofol (1%, BBraun Medical, Barcelona, Spain)
were administered.
Contrast Agent
An iodinated contrast agent was used (Iohexol 300
mg/mL, Omnipaque, GE-Healthcare, Madrid, Spain) in
order to get a better view of the structures to infiltrate.
Contrast was only used when strictly necessary and al-
ways diluted (20% in saline).
Cervical Infiltration Protocol
The patient was placed in supine position and their
head was fixed with a frond to the cranial extension of
the special table for fluoroscopy. The patient was then
immobilized with wide, cross-shaped plasters, leaving
the entire neck free to ensure the precision of the in-
filtration in the objective. IVDs were first infiltrated for
reasons of asepsis, which are accessed through the an-
terolateral route of Smith. A small skin surgical incision
was open and a 22G x 90 mm needle (Spinal Needle
Quincke) with the last 15 mm curved towards the bevel
plane was inserted. Infiltrations of the IVD were per-
formed under a C-arm fluoroscope, using an oblique
angle at 25º-30º and tilted towards podalic about 7º-
10º, until finding the parallelism with the 2 endplates
next to the disc to be infiltrated. Once the disc was
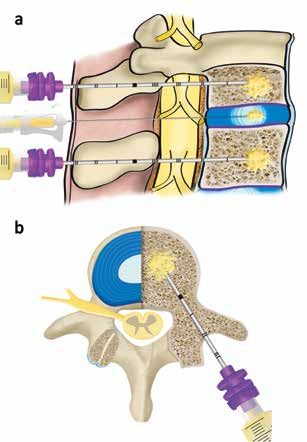
Fig. 1. Illustration of the technique used for PRGF
reached, controls were performed in anterior-posterior infiltration in the cervical spine. a) Sagittal view showing
and lateral view to determine the correct depth of the the intradiscal (C4-C5) and intraosseous infiltration in
needle. Then, 1.0 - 1.5 mL of activated PRGF were infil- the 2 vertebral bodies adjacent to the disc (C4 and C5). b)
trated in the nucleus pulposus (Fig. 1a). This infiltration Axial view demonstrating the infiltration with a 30º needle
approach to reach the intraosseous level of the vertebral body
produced intervertebral diastasis, which helped grant
www.painphysicianjournal.com E651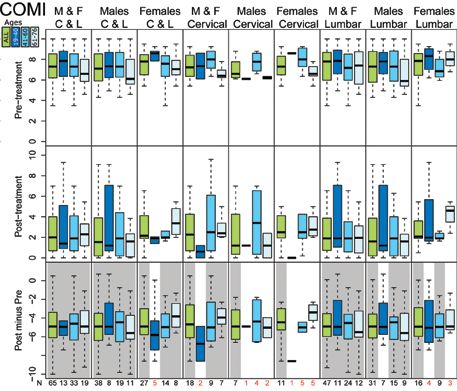
Pain Physician: August 2021 24:E649-E660

was via the anterior route (Fig. 1), infiltrating 2 mL of   Outcome Measures
PRGF directly in the middle of the spongy area of the           The efficacy of the treatment was assessed by
vertebral body.                                             means of PRO: 1) NRS for back pain, 2) COMI Ques-
                                                            tionnaire for lumbar and cervical cases and 3) the
Lumbar Infiltration Protocol                                OSWESTRY Disability Index questionnaire solely for the
     The intradiscal infiltration technique is based on     lumbar cases. Patients fulfilled the questionnaires in
procedure published by Kirchner & Anitua (21). Briefly,     the pre- and the post-treatment stages, which provided
IVD infiltrations were performed under a C-arm fluo-        6 different scores: NRS, COMI, COMI Disability Score
roscope. A small skin surgical incision was opened at       (CDS), COMI Pain Score (CPS), OSWESTRY Pain Score
the point of entry of the spinal needle of 22G x 178        (OPS) and OSWESTRY Disability Index (ODI) (the latter
mm long (BD Spinal Needle Quincke, BD Spain, Ma-            2 being valid only for lumbar cases). In addition to the
drid, Spain). The infiltration process was performed        overall scores, results from 3 relevant questions con-
using an oblique angle of between 30º to 35º, in the        tained in the questionnaires relating to the daily life of
lateral margin of the superior articular process of the     the patients were also individually addressed, namely
lower vertebra and tilted towards the Scottie dog´s         the quality of life in the last week (“QoL,” question
head, about 10º to 15º, until finding the parallelism       5 at the COMI questionnaire), the capability to go to
with the 2 endplates next to the disc to be infiltrated,    work in the last 4 weeks (“Work,” question 7 at COMI),
between the lower endplate of the superior vertebra         and the capability to sleep (“Sleep,” contained in the
and the upper endplate of the lower vertebra, and lat-      OSWESTRY questionnaire). In addition, adverse events
eral to the neuroforamen, for the preservation of the       data were also extracted from each patient’s medical
nerve root. The position of the spinal needle, which        records.
was manually bent at the tip (15º - 20º), was guided
and its position confirmed under fluoroscopic view in       Statistical Analysis
the 3 usual incidences: oblique, for the approaching;            All analyses were conducted using RStudio-Inte-
anterior-posterior (AP), to confirm the needle inside       grated Development for R software, version 1.2.1335
the disc; and lateral, to measure the depth of the          (RStudio, Inc. Boston, US). Descriptive statistics were
needle on the disc. Once the tip of the spinal needle       used to summarize data. In addition to considering the
was located in the degenerated disc (depth of the           whole cohort, score differences between pre- and post-
nucleus pulposus), and checking under fluoroscopy by        treatment were assessed for multiple sub-groups of
an infiltration of a small amount of contrast, 3 mL of      patients (sub-cohorts) resulting from the stratification
activated PRGF was injected into the nucleus pulposus       and clustering based on 3 different parameters: 1) the
of each injured lumbar disc and 2 mL in the nearby          sector of the column treated, namely lumbar and cervi-
nerve roots (Fig. 2). The epidural infiltration was per-    cal, 2) gender, and 3) age, which was divided into 3 age
formed in the lateral fluoroscopic incidence taking         ranges (young, 18 - 40; middle, 41 - 60; and elderly, 61 -
into account the posterior wall of the body and, us-        76), producing up to 36 subgroups. The 3 subgroup age
ing the same procedure, 2 mL of activated PRGF were         ranges were established following educated, medical
infiltrated. Intraosseous infiltrations were performed      criteria of subgroup similarity. Nine clinical scores were
according to the protocol described by Kirchner, et al      considered for study. A Wilcoxon signed-rank test (30)
(20) (Fig. 2).                                              was performed to each resulting group within each
                                                            score and question. A P value < 0.05 was considered
Postoperative Protocol                                      statistically significant.
     Once the procedure was finished, the patient was
transferred from the operating room to the resuscita-
                                                            Results
tion room and observed for 1 to 2 hours to monitor
evolution and any possible adverse reaction. An ice         Patient characteristics
pack was kept on the treated area to avoid possible             This study includes 65 patients (27 women and 38
inflammation. A solution of 100 mL of saline was ad-        men) treated with PRGF technology for cervical and
ministered intravenously. According to the immedi-          lumbar pain. Eigthteen patients had cervical pathology,
ate clinical evolution, the anaesthetist could indicate     11 women and 7 men, aged between 39 and 73 years
Paracetamol (1 g) and/or Dexketoprofen (25 g).              (average age of 54 years). With respect to patients with

E652                                                                                      www.painphysicianjournal.com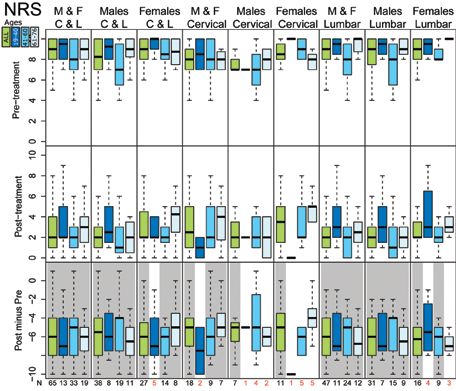
PRGF in the Treatment of Cervical and Lumbar Back Pain

lumbar back pain, there are 47 patients (16 women and
32 men) between 19 and 76 years old (average age of
51 years).
     The average time of back pain evolution was 10
years (range between 0.5 - 40 years). All patients re-
ceived at least 2 infiltration series about one month
apart, 60 patients (92%) received 3, 9 patients (14%)
were treated with 4 series, and one patient (1.5%)
received 5. All patients in this study were subjected
to IVD infiltrations. In the cervical sector, 9 of the pa-
tients received infiltrations on 2 discs, while 8 of them
received infiltrations on 3 discs, and only one patient
was infiltrated on 4 discs. With respect to the lumbar
area, 4 out of 47 patients received IVD infiltrations on
one disc, 24 on 2 discs, and in 5 patients 4 IVD had to
be infiltrated.
     Regarding intraosseous injections, only 2 patients
received injections in the cervical spine, while 5 received
them in the low back. All 7 patients received intraosse-
ous infiltrations in only 2 vertebrae. The criterion for
this type of infiltration was the presence of lesions in
the endplate or subchondral bone in 2 vertebrae sepa-
rated by an injured disc. For the rest of the structures,
and as an integral approach, 80% of the total patients
received root infiltrations. Intraarticular infiltrations
were carried out in case of osteoarthritis of the facet
joints; in the cervical sector this was seen in 44% of
the patients, while in the lumbar sector it was seen in          Fig. 2. Illustration of the technique used for the infiltration
                                                                 of PRGF in the lumbar section. a) Sagittal view
74%. Epidural infiltration was carried out in 83% of all
                                                                 showing intradiscal and intraosseous infiltration in the
patients.                                                        2 vertebral bodies adjacent to the disc. b) Axial view
     The patients’ follow-up time had a range of 1 to 24         showing the transpedicular approach of the needle that will
months with a mean of 5 months. Two patients were                finally reach the intraosseous level of the vertebral body.
excluded from the “Work” question due to ineligibility           Reproduced with permission from (20).
causes.

Outcome Measures                                               improvement in 249 cases (99%). Three cases showed
    The first column of Figs. 3-10 show boxplots for pre-      no change (with n values equal 1, 1, and 3). From the
and post-treatment statistics and their difference for         249 improving cases, 154 (62%) showed a statistically
the 9 scores considered. Results show statistically signifi-   significant difference between the pre- and the post-
cant (P < 0.05) improvements (negative differences, ie,        treatment stages (Supplementary tables 1-36).
smaller post- than pre-treatment scores) on all 9 scores,           First, results were assessed from the perspective of
when all patients (without stratification) are considered.     the 3 variables compared (spine sector, gender, and age),
The minimal clinically important difference (MCID) was         thus, considering all patients. Results reveal that men had
achieved in all subgroups for NRS and ODI.                     more improvement, compared to women, with a larger
                                                               score decrease on all 9 scores. Regarding the sector of
Spine Sector, Age, and Gender Stratification                   column treated, patients with lumbar pathology show
Strategies                                                     more improvement than the ones with cervical lesions,
    The results are stratified and analyzed by spine           with significant score decreases in 5 out of 6 comparable
sector, age, and gender (Figs. 3-10). Considering              scores. Finally, results comparing the patients age show
sub-groups in all tests (252 cases overall) showed an          that the elderly group experienced the largest improve-

www.painphysicianjournal.com                                                                                                 E653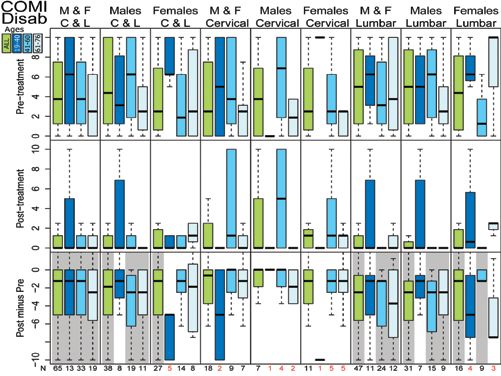
Pain Physician: August 2021 24:E649-E660

                                                  Fig. 3. Boxplots of the NRS
                                                  results for the 36 sub-groups
                                                  considered, showing Pre-
                                                  treatment (top), Post-
                                                  treatment (center) and
                                                  difference (Post- minus Pre-
                                                  treatment) results (bottom).
                                                  A grey background denotes
                                                  statistical significance (P
                                                  < 0.05) in the difference.
                                                  Sample sizes for each group
                                                  are shown at the bottom (N).
                                                  N values smaller than 6 are
                                                  shown in red. Groups are
                                                  colour-distributed according
                                                  to the defined age ranges (all
                                                  ages for green, and 19-40,
                                                  41-60, 60-76 from dark to
                                                  light blue, respectively).

                                                  Fig. 4. Boxplots of the
                                                  COMI results for the 36 sub-
                                                  groups considered, showing
                                                  Pre-treatment (top),
                                                  Post-treatment (center) and
                                                  difference (Post- minus Pre-
                                                  treatment) results (bottom).
                                                  A grey background denotes
                                                  statistical significance (P
                                                  < 0.05) in the difference.
                                                  Sample sizes for each group
                                                  are shown at the bottom
                                                  (N). N values smaller than
                                                  6 are shown in red. Groups
                                                  are colour-distributed
                                                  according to the defined age
                                                  ranges (all ages for green,
                                                  and 19-40, 41-60, 60-76
                                                  from dark to light blue,
                                                  respectively).

E654                                                 www.painphysicianjournal.com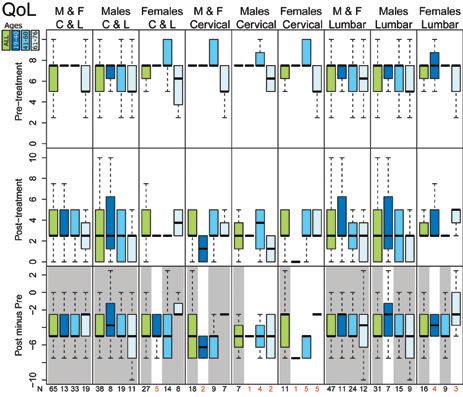
PRGF in the Treatment of Cervical and Lumbar Back Pain

 Fig. 5. Boxplots of the
 COMI - Pain Score
 results for the 36 sub-
 groups considered,
 showing Pre-treatment
 (above), Post-treatment
 (center) and difference
 (Post- minus Pre-
 treatment) results
 (bottom). A grey
 background denotes
 statistical significance (P
 < 0.05) in the difference.
 Sample sizes for each
 group are shown at the
 bottom (N). N values
 smaller than 6 are shown
 in red. Groups are colour-
 distributed according to
 the defined age ranges (all
 ages for green, and 19-40,
 41-60, 60-76 from dark to
 light blue, respectively).

  Fig. 6. Boxplots of the
  COMI - Disability
  Score results for the 36
  sub-groups considered,
  showing Pre-treatment
  (top), Post-treatment
  (center) and difference
  (Post- minus Pre-
  treatment) results
  (bottom). A grey
  background denotes
  statistical significance
  (P < 0.05) in the
  difference. Sample sizes
  for each group are shown
  at the bottom (N). N
  values smaller than 6 are
  shown in red. Groups
  are colour-distributed
  according to the defined
  age ranges (all ages for
  green, and 19-40, 41-60,
  60-76 from dark to light
  blue, respectively).

www.painphysicianjournal.com                                                            E655
Pain Physician: August 2021 24:E649-E660
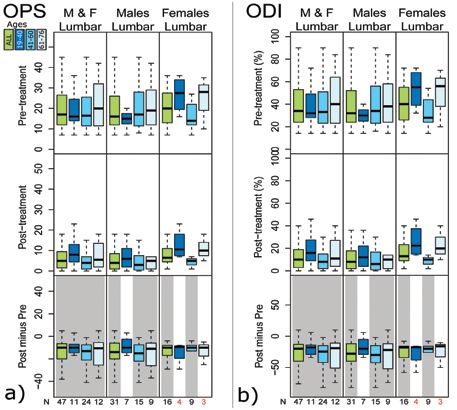
Fig. 7. Boxplots of the
OSWESTRY (a) Pain Score
(OPS) and (b) Disability
Index (ODI) results for the
36 sub-groups considered,
showing Pre-treatment (top),
Post-treatment (center) and
difference (Post- minus Pre-
treatment) results (bottom).
A grey background denotes
statistical significance (P
< 0.05) in the difference.
Sample sizes for each group
are shown at the bottom (N).
N values smaller than 6 are
shown in red. Groups are
colour-distributed according
to the defined age ranges (all
ages for green, and 19-40,
41-60, 60-76 from dark to light
blue, respectively).
Fig. 8. Boxplots of the
Quality of Life (QoL) in
the last week (question five
at the COMI questionnaire)
results for the 36 sub-groups
considered, showing Pre-
treatment (top), Post-
treatment (center) and
difference (Post- minus Pre-
treatment) results (bottom).
A grey background denotes
statistical significance (P
< 0.05) in the difference.
Sample sizes for each group
are shown at the bottom
(N). N values smaller than
6 are shown in red. Groups
are colour-distributed
according to the defined age
ranges (all ages for green,
and 19-40, 41-60, 60-76
from dark to light blue,
respectively).
E656 www.painphysicianjournal.com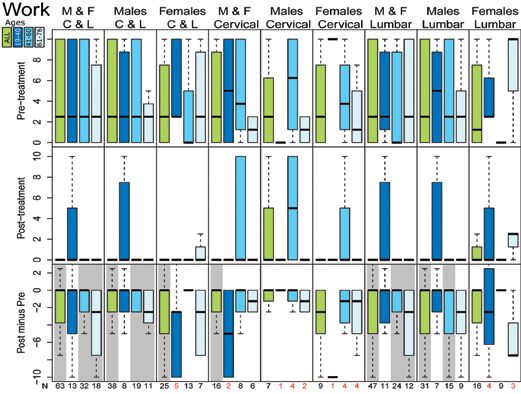
PRGF in the Treatment of Cervical and Lumbar Back Pain

  Fig. 9. Boxplots of
  the capability to go
  to work in the last
  4 weeks (question
  seven at the COMI
  questionnaire) results
  for the 36 sub-groups
  considered, showing
  Pre-treatment (top),
  Post-treatment
  (center) and
  difference (Post-
  minus Pre-treatment)
  results (bottom).
  A grey background
  denotes statistical
  significance (P
  < 0.05) in the
  difference. Sample
  sizes for each group
  are shown at the
  bottom (N). N values
  smaller than 6 are
  shown in red. Groups
  are colour-distributed
  according to the
  defined age ranges
  (all ages for green,
  and 19-40, 41-60, 60-
  76 from dark to light
  blue, respectively).

ment on 5 scores, followed by the middle (4 maximum            Discussion
scores), and the young group (1 maximum score). Most
sub-groups show an n (≤ 7) that was too small to extract            The results of this retrospective study show that a
reliable conclusions from. The group of men in the lum-        minimally invasive treatment consisting of PRGF infil-
bar sector presented all subgroups with n > 7, with 5          trations in the cervical and lumbar spine contributed to
scores showing the greatest improvement in the middle          a statistically significant reduction in all patient report-
age range (41-60), compared to 4 scores in the elderly         ed outcomes. Broadly, the groups show a statistically
group, and none in the young group.                            significant improvement in all areas at the end of the
      Considering the different scores, NRS, COMI, CPS,        follow-up, especially in terms of pain and overall qual-
OPS, ODI, and QoL show more than 69% sub-groups                ity of life. These results are consistent with previous
with statistically significant improvements. Among these       studies and highlight the minimally invasive treatment
scores, all non-significant sub-groups have a sample size      of back pain through PRP infiltrations (11-16,20,21). It
≤ 7. A smaller statistically significant amount of improve-    is noteworthy that the MCID was achieved in all sub-
ments were obtained for “Sleep” (50%), “CDS” (44%),            groups for NRS scale, namely, an improvement equal to
and “Work” (36%). In these cases, results also show sen-       or greater than 2 points that corresponds to a decrease
sibility to the sample size, as 33 out of 55 non-significant   in pain of 2 points or more (31,32). The MCID was also
differences have a sample size ≤ 7. Overall, results show      reached for the ODI (difference of 10 points) (31).
that most of the non-significant cases (80%, 78 out of              Breaking down the results, the elderly group was
97) have a sample size smaller or equal to 7, of those         found to have better results in terms of return to work,
included in this study, which encourages us to expect a        compared to the other 2 age groups, and the middle-
higher statistical significance, if their n is increased.      aged group had a better result than the younger group.
                                                               In contrast, the younger and middle-aged groups had a
Adverse events                                                 better result in sleeping hours at the end of the follow-
    PRGF infiltrations were well tolerated and no seri-        up, compared to the elderly group. This is probably due
ous adverse events were observed.                              to the fact that the elderly population already tends to

www.painphysicianjournal.com                                                                                         E657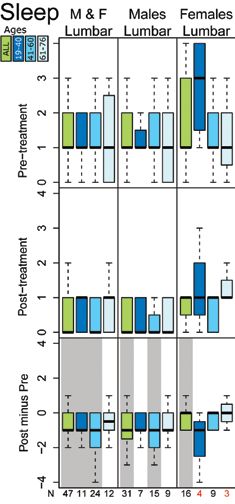
Pain Physician: August 2021 24:E649-E660

                                                                show a statistically significant improvement in terms of
                                                                social and occupational disability, whereas the lumbar
                                                                spine group did (with the exception of the middle age
                                                                group). By independently analyzing the capability to go
                                                                to work in the last 4 weeks, the cervical group obtained
                                                                a statistically significant result, when analyzed as an en-
                                                                tire group; therefore, there was improvement in terms
                                                                of work disability, but there was less improvement in
                                                                terms of social disability. On the other hand, low back
                                                                pain patients obtained an improvement in both areas
                                                                equally (work and daily activities); therefore, there is a
                                                                need to increase the sample size in some subgroups in
                                                                order to perform stratification, since no definitive con-
                                                                clusions can be drawn with samples ≤ 7. With sample
                                                                sizes greater than 7, a significant result was obtained
                                                                almost systematically. The literature recommends that
                                                                the Wilcoxon signed-rank test should have sample sizes
                                                                greater than 7 to measure statistical significance (34).
                                                                Therefore, we believe that the non-significant results
                                                                are related to the sample size and not to the treatment
                                                                (in the cases that n ≤ 7). However, when the subgroup
                                                                sample size is larger than 7 and the result is not statisti-
                                                                cally significant, it may also be due to a small sample (n
                                                                = 7-13). There are also large differences in the sample
                                                                size in each subgroup of patients, which prevents us
                                                                from making comparisons between them. With larger
                                                                sample sizes, more powerful conclusions could be
                                                                drawn and more meaningful comparisons could be
                                                                made between subgroups.
                                                                     Recent studies support the hypothesis of a global
                                                                approach to back pain pathologies, since changes in the
                                                                vertebral bone, especially in the endplates, influence
  Fig. 10. Boxplots of the capability to sleep (Sleep,          the transport of nutrients to the disc and its eventual
  contained in the OSWESTRY questionnaire) results for          degeneration (35). The appropriate crosstalk between
  the 36 sub-groups considered, showing Pre-treatment (top),
  Post-treatment (center) and difference (Post- minus Pre-      the IVD and the subchondral bone is a key feature of
  treatment) results (bottom). A grey background denotes        the homeostasis of the intervertebral joint functional
  statistical significance (P < 0.05) in the difference.        unit (IVD, the upper and lower vertebrae, and the facet
  Sample sizes for each group are shown at the bottom (N).      joints) (17).
  N values smaller than 6 are shown in red. Groups are               Together, growth factors, fibrin, and the rest of the
  colour-distributed according to the defined age ranges (all
  ages for green, and 19-40, 41-60, 60-76 from dark to light    bioactive molecules contained in PRGF (36-38) play a
  blue, respectively).                                          key role in the physiology of IVD cells by promoting the
                                                                synthesis of the extracellular matrix, while exerting an
                                                                anti-inflammatory and antiapoptotic effect, which at-
have more sleep problems than the younger popula-               tempts to re-establish homeostasis (17,39). Therefore,
tion (33), due to among other causes, respiratory prob-         as in other pathologies of the musculoskeletal system
lems, such as apnea-hypopnea syndrome.                          (40), PRGF intravertebral infiltrations can contribute to
     On the other hand, the men studied show a greater          the integral approach to back pain.
improvement than the women. Even so, the sample size                 It should be noted, no significant adverse events
was significantly higher in men (28) than in women (12),        were found due to PRGF infiltrations in the 65 patients.
so it cannot be stated that women cannot recover their          In the 10-year history series of about 1000 patients,
sleep after treatment. The cervical spine group did not         the percentage of adverse effects was 0.7%, with dis-

E658                                                                                           www.painphysicianjournal.com
PRGF in the Treatment of Cervical and Lumbar Back Pain
citis and neuritis as the most relevant. These findings pain than the cervical pain (1,5). In line with this, it
were consistent with a recent systematic review that would be convenient to increase the sample size of
included 3 randomized clinical trials and in which no the study, so that stratification by spine sector, age,
increase in adverse events due to PRP infiltrations was and gender was effective in all subgroups and had
observed (41). adequate statistical power. In addition, it would have
been helpful to have included body mass index val-
Limitations ues in the study, since being overweight and/or obese
This study has several limitations. As a retro- are factors that can influence back pain, especially in
spective study, not all patients had the same follow- the lumbar area (42,43).
up period, nor the same number of infiltrations.
However, this study highlights how the treatment
Conclusion
of cervical and lumbar back pain (a very prevalent In conclusion, taking into account the limitations
pathology with multiple etiologies) with a cost-ef- of the study, PRGF infiltrations are an effective and
fective, minimally invasive procedure based on PRGF minimally invasive tool in the treatment of both cervi-
technology, is feasible, clinically promising, and safe. cal and lumbar pain, evaluated according to validated
Another limitation is the low number of cases of cer- questionnaires. These encouraging results obtained in
vical pathology compared to the lumbar ones. This routine clinical practice should be validated in future
corresponds to the higher prevalence of lumbar back randomized clinical trials.
References
1. Manek NJ, MacGregor AJ. Epidemiology 316:2627-2646. 14. Lutz GE. Increased Nuclear T2 Signal
of back disorders: Prevalence, risk 8. Moriguchi Y, Alimi M, Khair T, et al. Intensity and Improved Function
factors, and prognosis. Curr Opin Biological Treatment Approaches and Pain in a Patient One Year After
Rheumatol 2005; 17:134-140. for Degenerative Disk Disease: A an Intradiscal Platelet-Rich Plasma
2. Hay SI, Abajobir AA, Abate KH, et al. Literature Review of In Vivo Animal and Injection. Pain Med 2017; 18:1197-1199.
Global, regional, and national disability- Clinical Data. Global spine journal 2016; 15. Broadhead DY, Douglas HE, Bezjian
adjusted life-years (DALYs) for 333 6:497-518. Wallace LM, et al. Use of Ultrasound-
diseases and injuries and healthy life 9. Wang SZ, Rui YF, Tan Q, et al. Guided Platelet-Rich Plasma Injection
expectancy (HALE) for 195 countries Enhancing intervertebral disc repair of the Sacroiliac Joint as a Treatment for
and territories, 1990–2016: A systematic and regeneration through biology: Chronic Low Back Pain. Mil Med 2020;
analysis for the Global Burden of Platelet-rich plasma as an alternative 185:e1312-e1317.
Disease Study 2016. The Lancet 2017; strategy. Arthritis Res Ther 2013; 15:220. 16. Cheng J, Santiago KA, Nguyen JT, et al.
390:1260-1344. Treatment of symptomatic degenerative
10. Navani A, Manchikanti L, Albers SL,
3. Vos T, Abajobir AA, Abate KH, et et al. Responsible, Safe, and Effective intervertebral discs with autologous
al. Global, regional, and national Use of Biologics in the Management platelet-rich plasma: Follow-up at 5-9
incidence, prevalence, and years lived of Low Back Pain: American Society years. Regen Med 2019; 14:831-840.
with disability for 328 diseases and of Interventional Pain Physicians 17. Anitua E, Padilla S. Biologic therapies
injuries for 195 countries, 1990–2016: (ASIPP) Guidelines. Pain physician 2019; to enhance intervertebral disc repair.
A systematic analysis for the Global 22:S1-S74. Regen Med 2018; 13:55-72.
Burden of Disease Study 2016. The
11. Aufiero D, Vincent H, Sampson S, et 18. Lam KHS, Hung CY, Wu TJ.
Lancet 2017; 390:1211-1259.
al. Regenerative Injection Treatment in Ultrasound-Guided Cervical Intradiscal
4. Hartvigsen J, Hancock MJ, Kongsted A, the Spine: Review and Case Series with Injection with Platelet-Rich Plasma
et al. What low back pain is and why we Platelet Rich Plasma. J Stem Cells Res, with Fluoroscopic Validation for the
need to pay attention. The Lancet 2018; Rev & Rep 2015; 2:1019. Treatment of Cervical Discogenic
391:2356-2367. Pain: A Case Presentation and
12. Tuakli-Wosornu YA, Terry A, Boachie-
5. Hoy DG, Protani M, De R, et al. The Adjei K, et al. Lumbar Intradiskal Technical Illustration. J Pain Res 2020;
epidemiology of neck pain. Best Pract Platelet-Rich Plasma (PRP) Injections: A 13:2125-2129.
Res Clin Rheumatol 2010; 24:783-792. Prospective, Double-Blind, Randomized 19. Padilla S, Sanchez M, Orive G, et
6. Lee H, Hübscher M, Moseley GL, et Controlled Study. PM R 2016; 8:1-10. al. Human-Based Biological and
al. How does pain lead to disability? A 13. Akeda K, Ohishi K, Masuda K, et al. Biomimetic Autologous Therapies for
systematic review and meta-analysis of Intradiscal Injection of Autologous Musculoskeletal Tissue Regeneration.
mediation studies in people with back Platelet-Rich Plasma Releasate to Trends Biotechnol 2017; 35:192-202.
and neck pain. Pain 2015; 156:988-997. Treat Discogenic Low Back Pain: A 20. Kirchner F, Pinar A, Milani I, et al.
7. Dieleman JL, Baral R, Birger M, et al. US Preliminary Clinical Trial. Asian Spine J Vertebral intraosseous plasma rich
Spending on Personal Health Care and 2017; 11:380-389. in growth factor (PRGF-Endoret)
Public Health, 1996-2013. JAMA 2016; infiltrations as a novel strategy for
www.painphysicianjournal.com E659Pain Physician: August 2021 24:E649-E660
the treatment of degenerative lesions R, Sánchez M (eds). Platelet Rich Plasma et al. High-throughput proteomic
of endplate in lumbar pathology: in Orthopaedics and Sports Medicine. characterization of plasma rich in
Description of technique and case Springer International Publishing, growth factors (PRGF-Endoret)-derived
presentation. J Orthop Surg Res 2020; Cham, Switzerland, 2018, pp 29-45. fibrin clot interactome. J Tissue Eng
15:72. 28. Anitua E. Plasma rich in growth factors: Regen Med 2015; 9:E1-12.
21. Kirchner F, Anitua E. Intradiscal and Preliminary results of use in the 37. Anitua E, Zalduendo MM, Alkhraisat
intra-articular facet infiltrations with preparation of future sites for implants. MH, et al. Release kinetics of platelet-
plasma rich in growth factors reduce Int J Oral Maxillofac Implants 1999; derived and plasma-derived growth
pain in patients with chronic low back 14:529-535. factors from autologous plasma rich
pain. J Craniovertebr Junction Spine 2016; 29. Wang Y, Videman T, Battie MC. Lumbar in growth factors. Annals of anatomy =
7:250-256. vertebral endplate lesions: Prevalence, Anatomischer Anzeiger 2013; 195:461-466.
22. von Elm E, Altman DG, Egger M, et al. classification, and association with age. 38. Anitua E, Andia I, Ardanza B, et al.
The Strengthening the Reporting of Spine 2012; 37:1432-1439. Autologous platelets as a source
Observational Studies in Epidemiology 30. Whitley E, Ball J. Statistics review 6: of proteins for healing and tissue
(STROBE) statement: Guidelines for Nonparametric methods. Crit Care regeneration. Thromb Haemost 2004;
reporting observational studies. Lancet 2002; 6:509-513. 91:4-15.
2007; 370:1453-1457. 39. Marjoram T. The Endplate and
31. Ostelo RW, de Vet HC. Clinically
23. Association WM. World Medical important outcomes in low back pain. Trabecular Bone in Lumbar
Association Declaration of Helsinki: Best Pract Res Clin Rheumatol 2005; Degenerative Disc Disease: A Narrative
ethical principles for medical research 19:593-607. Review. SN Comprehensive Clinical
involving human subjects. JAMA 2013; Medicine 2020; 2:332-337.
32. Hirase T, Jack Ii RA, Sochacki KR, et
310:2191-2194. 40. Delgado D, Garate A, Vincent H, et
al. Systemic Review: Is an Intradiscal
24. Pfirrmann CW, Metzdorf A, Zanetti Injection of Platelet-Rich Plasma for al. Current concepts in intraosseous
M, et al. Magnetic resonance Lumbar Disc Degeneration Effective?. Platelet-Rich Plasma injections for knee
classification of lumbar intervertebral Cureus 2020; 12:e8831-e8831. osteoarthritis. J Clin Orthop Trauma
disc degeneration. Spine (Phila Pa 1976) 2019; 10:36-41.
33. Mander BA, Winer JR, Walker MP.
2001; 26:1873-1878. 41. Xuan Z, Yu W, Dou Y, et al. Efficacy of
Sleep and Human Aging. Neuron 2017;
25. Miyazaki M, Hong SW, Yoon SH, 94:19-36. Platelet-rich Plasma for Low Back Pain:
et al. Reliability of a magnetic A Systematic Review and Meta-analysis.
34. King AP, Eckersley RJ. Chapter 6 -
resonance imaging-based grading J Neurol Surg A Cent Eur Neurosurg.
Inferential Statistics III: Nonparametric
system for cervical intervertebral disc 2020; 81(6):529-534.
Hypothesis Testing. In: King AP,
degeneration. J Spinal Disord Tech 2008; 42. Brady SRE, Urquhart DM, Hussain SM,
Eckersley RJ (eds). Statistics for
21:288-292. et al. High baseline fat mass, but not
Biomedical Engineers and Scientists.
26. Suzuki A, Daubs MD, Hayashi T, et al. Academic Press, London, UK, 2019, pp lean tissue mass, is associated with high
Magnetic Resonance Classification 119-145. intensity low back pain and disability in
System of Cervical Intervertebral Disk community-based adults. Arthritis Res
35. Ashinsky BG, Bonnevie ED,
Degeneration: Its Validity and Meaning. Ther 2019; 21:165.
Mandalapu SA, et al. Intervertebral
Clin Spine Surg 2017; 30:E547-E553. 43. Hurwitz EL, Randhawa K, Yu H, et
Disc Degeneration Is Associated With
27. Anitua E, Prado R, Nurden AT, et al. Aberrant Endplate Remodeling and al. The Global Spine Care Initiative: a
Characterization of Plasma Rich in Reduced Small Molecule Transport. J summary of the global burden of low
Growth Factors (PRGF): Components Bone Miner Res 2020; 35(8):1572-1581. back and neck pain studies. Eur Spine J
and formulations, in Anitua E, Cugat 2018; 27:796-801.
36. Anitua E, Prado R, Azkargorta M,
E660 www.painphysicianjournal.comSupplemental Table 1. Results for the subgroup considering both Supplemental Table 4. Results for the subgroup considering
sexes, for both cervical and lumbar treatments and for all ages both sexes, for both cervical and lumbar treatments and for ages
(19-76). ranging 61-76.
NRS COMI CDS CPS QoL Work NRS COMI CDS CPS QoL Work
Sample Size (N) 65.0 65.0 65.0 65.0 65.0 63.0 Sample Size (N) 19.0 19.0 19.0 19.0 19.0 18.0
Mean Pre 8.4 8.0 4.5 7.3 6.9 3.8 Mean Pre 8.7 8.5 3.8 7.30 6.1 3.5
Mean Post 2.6 2.7 1.8 2.7 2.8 1.6 Mean Post 2.8 2.7 0.7 2.3 2.5 0.3
Difference -5.7 -5.3 -2.8 -4.6 -4.0 -2.3 Difference -5.9 -5.8 -3.1 -4.7 -3.6 -3.2
Significance (%) 100.0 100.0 100.0 100.0 100.0 100.0 Significance (%) 100.0 100.0 99.6 100.0 99.9 99.5
Supplemental Table 2. Results for the subgroup considering Supplemental Table 5. Results for the subgroup considering male
both sexes, for both cervical and lumbar treatments and for ages patients, for both cervical and lumbar treatments and for all ages
ranging 19-40. (19-76).
NRS COMI CDS CPS QoL Work NRS COMI CDS CPS QoL Work
Sample Size (N) 13.0 13.0 13.0 13.0 13.0 13.0 Sample Size (N) 38.0 38.0 38.0 38.0 38.0 38.0
Mean Pre 9.1 8.3 5.6 7.7 7.1 4.6 Mean Pre 8.1 7.7 4.7 7.2 6.8 4.0
Mean Post 3.4 3.2 2.7 3.2 3.5 2.7 Mean Post 2.3 2.2 1.7 2.4 2.5 1.7
Difference -5.7 -5.2 -2.9 -4.5 -3.7 -1.9 Difference -5.8 -5.5 -3.0 -4.8 -4.3 -2.3
Significance (%) 99.8 99.8 96.5 99.7 99.5 82.0 Significance (%) 100.0 100.0 100.0 100.0 100.0 99.9
Supplemental Table 3. Results for the subgroup considering Supplemental Table 6. Results for the subgroup considering male
both sexes, for both cervical and lumbar treatments and for ages patients, for both cervical and lumbar treatments and for ages
ranging 41-60. ranging 19-40.
NRS COMI CDS CPS QoL Work NRS COMI CDS CPS QoL Work
Sample Size (N) 33.0 33.0 33.0 33.0 33.0 32.0 Sample Size (N) 8.0 8.0 8.0 8.0 8.0 8.0
Mean Pre 7.8 7.5 4.5 7.4 7.3 3.8 Mean Pre 8.9 8.4 4.4 7.4 6.9 4.1
Mean Post 2.2 2.5 2.0 2.7 2.8 1.9 Mean Post 3.4 3.0 3.0 3.4 3.8 3.1
Difference -5.6 -5.0 -2.6 -4.7 -4.5 -1.9 Difference -5.6 -5.4 -1.4 -4.0 -3.1 -0.9
Significance (%) 100.0 100.0 100.0 100.0 100.0 99.7 Significance (%) 98.6 98.1 79.8 96.1 95.1 58.6Supplemental Table 7. Results for the subgroup considering male Supplemental Table 12. Results for the subgroup considering
patients, for both cervical and lumbar treatments and for ages female patients, for both cervical and lumbar treatments and for
ranging 41-60. ages ranging 61-76.
NRS COMI CDS CPS QoL Work NRS COMI CDS CPS QoL Work
Sample Size (N) 19.0 19.0 19.0 19.0 19.0 19.0 Sample Size (N) 8.0 8.0 8.0 8.0 8.0 7.0
Mean Pre 7.3 6.9 5.5 7.4 7.0 4.6 Mean Pre 8.7 8.6 4.1 7.2 5.6 4.3
Mean Post 2.0 2.2 2.0 2.6 2.5 2.1 Mean Post 3.8 4.1 1.4 3.5 3.8 0.7
Difference -5.3 -4.7 -3.5 -4.8 -4.5 -2.5 Difference -4.9 -4.5 -2.7 -3.7 -1.9 -3.6
Significance (%) 100.0 100.0 99.9 100.0 100.0 98.7 Significance (%) 97.8 97.8 85.1 99.2 95.1 91.1
Supplemental Table 8. Results for the subgroup considering male Supplemental Table 13. Results for the subgroup considering both
patients, for both cervical and lumbar treatments and for ages sexes, for a cervical treatment and for all ages (19-76).
ranging 61-76.
NRS COMI CDS CPS QoL Work
NRS COMI CDS CPS QoL Work Sample Size (N) 18.0 18.0 18.0 18.0 18.0 16.0
Sample Size (N) 11.0 11.0 11.0 11.0 11.0 11.0
Mean Pre 8.1 7.9 3.9 7.3 7.2 3.9
Mean Pre 8.8 8.5 3.6 6.8 6.4 3.0
Mean Post 3.0 3.1 2.3 2.9 3.1 1.9
Mean Post 2.1 1.6 0.2 1.4 1.6 0.0
Difference -5.1 -4.9 -1.6 -4.4 -4.2 -2.0
Difference -6.7 -6.8 -3.4 -5.5 -4.8 -3.0
Significance (%) 99.9 99.9 92.6 100.0 99.9 98.0
Significance (%) 99.6 99.6 97.8 99.5 99.5 96.6
Supplemental Table 14. Results for the subgroup considering both
Supplemental Table 9. Results for the subgroup considering sexes, for a cervical treatment and for ages ranging 19-40.
female patients, for both cervical and lumbar treatments and for
NRS COMI CDS CPS QoL Work
all ages (19-76).
Sample Size (N) 2.0 2.0 2 2.0 2.0 2
NRS COMI CDS CPS QoL Work
Mean Pre 8.5 8.0 5 7.3 7.5 5
Sample Size (N) 27.0 27.0 27.0 27.0 27.0 25.0
Mean Post 1.0 0.5 0 0.6 1.2 0
Mean Pre 8.8 8.4 4.3 7.4 7.0 3.6
Difference -7.5 -7.5 -5 -6.8 -6.2 -0.9
Mean Post 3.1 3.4 1.8 3.1 3.3 1.4
Significance (%) 0.0 0.0 0 0.0 0.0 0
Difference -5.7 -5.0 -2.5 -4.4 -3.7 -2.2
Significance (%) 100.0 100.0 99.5 100.0 100.0 98.2 Supplemental Table 15. Results for the subgroup considering both
sexes, for a cervical treatment and for ages ranging 41-60.
Supplemental Table 10. Results for the subgroup considering NRS COMI CDS CPS QoL Work
female patients, for both cervical and lumbar treatments and for
ages ranging 19-40. Sample Size (N) 9.0 9.0 9.0 9.0 9.0 8.0
Mean Pre 8.1 7.9 4.9 7.9 8.3 5.0
NRS COMI CDS CPS QoL Work
Mean Post 3.1 3.3 4.0 3.6 3.6 3.8
Sample Size (N) 5.0 5.0 5.0 5.0 5.0 5.0
Difference -5.0 -4.6 -0.8 -4.3 -4.7 -1.2
Mean Pre 9.4 8.2 7.5 8.1 7.5 5.5
Significance (%) 97.9 98.0 50.2 99.2 98.6 82.6
Mean Post 3.4 3.4 2.2 2.9 3.0 2.0
Difference -6.0 -4.8 -5.2 -5.2 -4.5 -3.5
Supplemental Table 16. Results for the subgroup considering both
Significance (%) 93.8 94.2 89.8 87.5 94.3 72.4 sexes, for a cervical treatment and for ages ranging 61-76.
Supplemental Table 11. Results for the subgroup considering NRS COMI CDS CPS QoL Work
female patients, for both cervical and lumbar treatments and for Sample Size (N) 7.0 7.0 7.0 7.0 7.0 6.0
ages ranging 19-40. Mean Pre 7.9 8.0 2.3 6.6 5.7 2.1
NRS COMI CDS CPS QoL Work Mean Post 3.5 3.4 0.7 2.6 2.9 0.0
Sample Size (N) 14.0 14.0 14.0 14.0 14.0 13.0 Difference -4.4 -4.6 -1.6 -3.9 -2.9 -2.1
Mean Pre 8.6 8.3 3.2 7.3 7.7 2.5 Significance (%) 96.5 96.4 77.7 98.4 97.4 86.6
Mean Post 2.5 2.9 1.9 2.9 3.2 1.5
Difference -6.1 -5.4 -1.3 -4.4 -4.5 -1.0
Significance (%) 99.8 99.8 94.4 100.0 99.8 82.6Supplemental Table 17. Results for the subgroup considering male Supplemental Table 22. Results for the subgroup considering
patients, for a cervical treatment and for all ages (19-76). female patients, for a cervical treatment and for ages ranging
19-40.
NRS COMI CDS CPS QoL Work
Sample Size (N) 7.0 7.0 7.0 7.0 7.0 7.0 NRS COMI CDS CPS QoL Work
Mean Pre 7.3 7.1 3.9 7.1 7.5 3.6 Sample Size (N) 1 1 1 1.0 1.0 1
Mean Post 2.3 1.7 2.9 2.5 2.5 2.9 Mean Pre 10 8 10 8.6 7.5 10
Difference -5.0 -5.4 -1.1 -4.6 -5.0 -0.7 Mean Post 0 0 0 0.0 0.0 0
Significance (%) 96.6 96.6 65.4 98.4 97.9 65.4 Difference -10 -8 -10 -8.6 -7.5 -10
Significance (%) 0 0 0 0.0 0.0 0
Supplemental Table 18. Results for the subgroup considering male
patients, for a cervical treatment and for ages ranging 19-40. Supplemental Table 23. Results for the subgroup considering
female patients, for a cervical treatment and for ages ranging
NRS COMI CDS CPS QoL Work 41-60.
Sample Size (N) 1 1 1 1.0 1.0 1
NRS COMI CDS CPS QoL Work
Mean Pre 7 8 0 6.1 7.5 0
Sample Size (N) 5.0 5.0 5.0 5.0 5.0 4.0
Mean Post 2 1 0 1.2 2.5 0
Mean Pre 9.0 9.0 4.0 8.0 8.5 4.4
Difference -5 -7 0 -4.9 -5.0 0
Mean Post 3.6 4.2 3.2 3.7 4.0 2.5
Significance (%) 0 0 0 0.0 0.0 0
Difference -5.4 -4.8 -0.8 -4.3 -4.5 -1.9
Supplemental Table 19. Results for the subgroup considering male Significance (%) 90.2 90.2 28.7 87.5 89.8 62.9
patients, for a cervical treatment and for ages ranging 41-60.
Supplemental Table 24. Results for the subgroup considering
NRS COMI CDS CPS QoL Work female patients, for a cervical treatment and for ages ranging
Sample Size (N) 4.0 4.0 4.0 4.0 4.0 4.0 61-76.
Mean Pre 7.0 6.5 5.9 7.7 8.1 5.6 NRS COMI CDS CPS QoL Work
Mean Post 2.5 2.2 5.0 3.4 3.1 5.0 Sample Size (N) 5.0 5.0 5.0 5.0 5.0 4.0
Difference -4.5 -4.2 -0.9 -4.3 -5.0 -0.6 Mean Pre 7.9 8.0 2.5 6.7 5.5 2.5
Significance (%) 75.0 75.0 0.0 87.5 90.2 0.0 Mean Post 4.1 4.4 1.0 3.2 3.5 0.0
Difference -3.8 -3.6 -1.5 -3.5 -2.0 -2.5
Supplemental Table 20. Results for the subgroup considering male
patients, for a cervical treatment and for ages ranging 61-76. Significance (%) 90.0 90.2 53.9 93.8 92.8 62.9
NRS COMI CDS CPS QoL Work
Sample Size (N) 2 2 2.0 2.0 2.0 2.0
Mean Pre 8 8 1.9 6.2 6.2 1.2
Mean Post 2 1 0.0 1.2 1.2 0.0
Difference -6 -7 -1.9 -5.0 -5.0 -1.2
Significance (%) 0 0 0.0 0.0 0.0 0.0
Supplemental Table 21. Results for the subgroup considering
female patients, for a cervical treatment and for all ages (19-76).
NRS COMI CDS CPS QoL Work
Sample Size (N) 11.1 11.1 11.0 11.0 11.0 9.0
Mean Pre 8.6 8.5 3.9 7.5 7.0 4.2
Mean Post 3.5 3.9 1.9 3.1 3.4 1.1
Difference -5.1 -4.5 -1.9 -4.3 -3.6 -3.1
Significance (%) 99.1 99.1 82.9 99.8 98.7 94.2Supplemental Table 25. Results for the subgroup considering both sexes, for a lumbar
treatment and for all ages (19-76).
NRS COMI CDS CPS OPS ODI QoL Work Sleep
Sample Size (N) 47.0 47.0 47.0 47.0 47.0 47.0 47.0 47.0 47.0
Mean Pre 8.5 8.0 4.8 7.3 20.1 40.3 6.8 3.8 1.4
Mean Post 2.5 2.5 1.5 2.6 6.4 13.2 2.8 1.5 0.6
Difference -6.0 -5.4 -3.2 -4.7 -13.7 -27.1 -4.0 -2.3 -0.9
Significance (%) 100.0 100.0 100.0 100.0 100.0 100.0 100.0 100.0 100.0
Supplemental Table 26. Results for the subgroup considering both sexes, for a lumbar
treatment and for ages ranging 19-40.
NRS COMI CDS CPS OPS ODI QoL Work Sleep
Sample Size (N) 11.0 11.0 11.0 11.0 11.0 11.0 11.0 11.0 11.0
Mean Pre 9.2 8.4 5.7 7.8 19.5 39.1 7.0 4.5 1.7
Mean Post 3.8 3.6 3.2 3.7 9.2 18.6 3.9 3.2 0.7
Difference -5.4 -4.7 -2.5 -4.1 -10.4 -20.5 -3.2 -1.4 -1.0
Significance (%) 99.6 99.4 93.6 98.6 99.1 99.5 98.7 65.2 98.2
Supplemental Table 27. Results for the subgroup considering both sexes, for a lumbar
treatment and for ages ranging 41-60.
NRS COMI CDS CPS OPS ODI QoL Work Sleep
Sample Size (N) 24.0 24.0 24.0 24.0 24.0 24.0 24.0 24.0 24.0
Mean Pre 7.8 7.3 4.4 7.2 19.5 38.9 6.9 3.3 1.4
Mean Post 1.9 2.2 1.2 2.4 4.7 9.6 2.5 1.2 0.4
Difference -5.9 -5.2 -3.2 -4.8 -14.8 -29.3 -4.4 -2.1 -1.0
Significance (%) 100.0 100.0 100.0 100.0 100.0 100.0 100.0 98.7 99.9
Supplemental Table 28. Results for the subgroup considering both sexes, for a lumbar
treatment and for ages ranging 61-76.
NRS COMI CDS CPS OPS ODI QoL Work Sleep
Sample Size (N) 12.0 12.0 12.0 12.0 12.0 12.0 12.0 12.0 12.0
Mean Pre 9.2 8.8 4.7 7.2 22.0 44.0 6.2 4.2 1.2
Mean Post 2.4 2.2 0.7 2.1 7.5 15.3 2.3 0.4 0.7
Difference -6.8 -6.6 -4.0 -5.2 -14.5 -28.7 -4.0 -3.8 -0.6
Significance (%) 99.8 99.8 98.7 99.7 99.5 99.5 99.2 97.8 87.6
Supplemental Table 29. Results for the subgroup considering male patients, for a
lumbar treatment and for all ages (19-76).
NRS COMI CDS CPS OPS ODI QoL Work Sleep
Sample Size (N) 31.0 31.0 31.0 31.0 31.0 31.0 31.0 31.0 31.0
Mean Pre 8.2 7.8 4.9 7.3 19.9 39.7 6.6 4.1 1.3
Mean Post 2.3 2.3 1.5 2.4 5.6 11.4 2.5 1.5 0.4
Difference -5.9 -5.5 -3.5 -4.9 -14.2 -28.3 -4.1 -2.7 -0.9
Significance (%) 100.0 100.0 100.0 100.0 100.0 100.0 100.0 99.9 100.0Supplemental Table 30. Results for the subgroup considering male patients, for a
lumbar treatment and for ages ranging 19-40.
NRS COMI CDS CPS OPS ODI QoL Work Sleep
Sample Size (N) 7.0 7.0 7.0 7.0 7.0 7.0 7.0 7.0 7.0
Mean Pre 9.2 8.4 5.0 7.6 15.4 30.9 6.8 4.6 1.1
Mean Post 3.6 3.3 3.4 3.7 7.1 14.3 3.9 3.6 0.4
Difference -5.6 -5.1 -1.6 -3.9 -8.3 -16.6 -2.9 -1.1 -0.7
Significance (%) 97.8 96.7 79.8 92.2 92.2 92.2 91.1 58.6 91.1
Supplemental Table 31. Results for the subgroup considering male patients, for a
lumbar treatment and for ages ranging 41-60.
NRS COMI CDS CPS OPS ODI QoL Work Sleep
Sample Size (N) 15.0 15.0 15.0 15.0 15.0 15.0 15.0 15.0 15.0
Mean Pre 7.3 7.0 5.4 7.3 21.1 42.3 6.7 4.3 1.3
Mean Post 1.8 2.1 1.2 2.4 4.5 9.3 2.3 1.3 0.3
Difference -5.5 -4.9 -4.2 -4.9 -16.6 -33.0 -4.3 -3.0 -1.1
Significance (%) 99.9 99.9 99.8 99.9 99.9 99.9 99.8 97.9 99.5
Supplemental Table 32. Results for the subgroup considering male patients, for a
lumbar treatment and for ages ranging 61-76.
NRS COMI CDS CPS OPS ODI QoL Work Sleep
Sample Size (N) 9.0 9.0 9.0 9.0 9.0 9.0 9.0 9.0 9.0
Mean Pre 8.9 8.6 4.0 7.0 21.2 42.4 6.4 3.3 1.2
Mean Post 2.1 1.8 0.3 1.4 6.3 12.7 1.7 0.0 0.4
Difference -6.8 -6.8 -3.8 -5.5 -14.9 -29.8 -4.7 -3.3 -0.8
Significance (%) 99.1 99.1 96.5 99.6 98.8 98.8 98.6 94.3 89.4
Supplemental Table 33. Results for the subgroup considering female patients, for a
lumbar treatment and for all ages (19-76).
NRS COMI CDS CPS OPS ODI QoL Work Sleep
Sample Size (N) 16.0 16.0 16.0 16.0 16.0 16.0 16.0 16.0 16.0
Mean Pre 8.9 8.3 4.5 7.4 20.6 41.2 7.0 3.3 1.8
Mean Post 2.8 3.0 1.7 3.0 8.0 16.6 3.3 1.6 0.9
Difference -6.2 -5.3 -2.8 -4.4 -12.6 -24.7 -3.8 -1.7 -0.9
Significance (%) 100.0 100.0 98.8 100.0 100.0 100.0 99.9 85.3 96.3
Supplemental Table 34. Results for the subgroup considering female patients, for a
lumbar treatment and for ages ranging 19-40.
NRS COMI CDS CPS OPS ODI QoL Work Sleep
Sample Size (N) 4.0 4.0 4.0 4.0 4.0 4.0 4.0 4.0 4.0
Mean Pre 9.2 8.2 6.9 8.0 26.8 53.5 7.5 4.4 2.8
Mean Post 4.2 4.2 2.8 3.7 12.8 26.2 3.8 2.5 1.2
Difference -5.0 -4.0 -4.1 -4.4 -14.0 -27.3 -3.8 -1.9 -1.5
Significance (%) 87.5 90.2 80.3 75.0 87.5 87.5 90.5 41.9 82.6Supplemental Table 35. Results for the subgroup considering female patients, for a
lumbar treatment and for ages ranging 41-60.
NRS COMI CDS CPS OPS ODI QoL Work Sleep
Sample Size (N) 9.0 9.0 9.0 9.0 9.0 9.0 9.0 9.0 9.0
Mean Pre 8.4 7.9 2.8 6.9 16.7 33.3 7.2 1.7 1.6
Mean Post 1.9 2.2 1.1 2.4 4.9 10.1 2.8 1.1 0.7
Difference -6.5 -5.7 -1.7 -4.5 -11.8 -23.3 -4.4 -0.6 -0.9
Significance (%) 99.1 99.1 96.9 99.6 99.1 99.6 98.7 0.0 81.9
Supplemental Table 36. Results for the subgroup considering female patients, for a
lumbar treatment and for ages ranging 61-76.
NRS COMI CDS CPS OPS ODI QoL Work Sleep
Sample Size (N) 3.0 3.0 3.0 3.0 3.0 3.0 3.0 3.0 3.0
Mean Pre 10.0 9.7 6.7 8.1 24.3 48.7 5.8 6.7 1.3
Mean Post 3.3 3.7 2.1 4.2 11.0 23.3 4.2 1.7 1.3
Difference -6.7 -6.0 -4.6 -3.9 -13.3 -25.3 -1.7 -5.0 0.0
Significance (%) 75.0 75.0 58.6 75.0 75.0 75.0 41.4 65.4 0.0You can also read