December 2016 - TPG Capital
←
→
Page content transcription
If your browser does not render page correctly, please read the page content below

December 2016

Disclaimer
No Offer or Solicitation
This presentation is for informational purposes only and is neither an offer to purchase, nor a solicitation of an offer to sell, subscribe for or buy any securities or the solicitation of any vote in any jurisdiction pursuant to the proposed transactions or
otherwise, nor shall there be any sale, issuance or transfer or securities in any jurisdiction in contravention of applicable law. No offer of securities shall be made except by means of a prospectus meeting the requirements of Section 10 of the
Securities Act of 1933, as amended, and applicable regulations in the Netherlands and Cayman Islands.

Use of Projections
This presentation contains financial forecasts including with respect to Playa Hotels & Resorts B.V. (“Playa”) projected revenue, Adjusted EBITDA, Capex and Adjusted EBITDA less Maintenance Capex (or FCF) for Playa’s fiscal years 2016 and
2017. Neither Pace Holding Corp.’s (“Pace”) nor Playa’s independent auditors have audited, reviewed, compiled, or performed any procedures with respect to the projections for the purpose of their inclusion in this presentation, and accordingly,
neither of them expressed an opinion or provided any other form of assurance with respect thereto for the purpose of this presentation. These projections are for illustrative purposes only and should not be relied upon as being necessarily
indicative of future results.

In this presentation, certain of the above-mentioned projected information has been repeated (in each case, with an indication that the information is subject to the qualifications presented herein), for purposes of providing comparisons with
historical data. The assumptions and estimates underlying the prospective financial information are inherently uncertain and are subject to a wide variety of significant business, economic and competitive risks and uncertainties that could cause
actual results to differ materially from those contained in the prospective financial information. Even if our assumptions and estimates are correct, projections are inherently uncertain due to a number of factors outside our control. Accordingly, there
can be no assurance that the prospective results are indicative of the future performance of Pace or Playa or the combined company after completion of any business combination or that actual results will not differ materially from those presented
in the prospective financial information. Inclusion of the prospective financial information in this presentation should not be regarded as a representation by any person that the results contained in the prospective financial information will be
achieved.

The Playa projections assume a merger with Pace is consummated and assume a number of additional changes that are expected to result from a merger with Pace. The projections provided herein do not reflect Playa’s expectations of future
results in the event a merger with Pace is not consummated.

Forward Looking Statements
This presentation includes “forward looking statements” within the meaning of the “safe harbor” provisions of the United States Private Securities Litigation Reform Act of 1995. Forward-looking statements may be identified by the use of words such
as "forecast," "intend," "seek," "target," “anticipate,” “believe,” “expect,” “estimate,” “plan,” “outlook,” and “project” and other similar expressions that predict or indicate future events or trends or that are not statements of historical matters. Such
forward looking statements include projected financial information. Such forward looking statements with respect to revenues, earnings, performance, strategies, prospects and other aspects of the businesses of Pace, Playa or the combined
company after completion of any proposed business combination are based on current expectations that are subject to risks and uncertainties. A number of factors could cause actual results or outcomes to differ materially from those indicated by
such forward looking statements. These factors include, but are not limited to: (1) the inability to complete the transactions contemplated by the proposed business combination; (2) the inability to recognize the anticipated benefits of the proposed
business combination, which may be affected by, among other things, competition, and the ability of the combined business to grow and manage growth profitably; (3) the ability to meet NASDAQ’s listing standards following the consummation of
the transactions contemplated by the proposed business combination; (4) costs related to the proposed business combination; (5) changes in applicable laws or regulations; (6) the possibility that Playa or Pace may be adversely affected by other
economic, business, and/or competitive factors; and (7) other risks and uncertainties indicated from time to time in the final prospectus of Pace, including those under “Risk Factors” therein, and other documents filed or to be filed with the
Securities and Exchange Commission by Pace. You are cautioned not to place undue reliance upon any forward-looking statements, which speak only as of the date made. Pace and Playa undertake no commitment to update or revise the
forward-looking statements, whether as a result of new information, future events or otherwise.

Industry and Market Data
We use market data and industry forecasts throughout this presentation. These market data and industry forecasts are based on or derived from a market study prepared for us in June 2016 by Jones Lang LaSalle (“JLL”), a financial and
professional services firm that specializes in commercial real estate services and investment management. We believe the data prepared by JLL is reliable, but we have not independently investigated or verified this information. Any forecasts
prepared by JLL are based on data (including third party data), models and experience of various professionals, and are based on various assumptions, all of which are subject to change without notice. The industry forecasts are based on surveys
and JLL’s experience in the industry, and there is no assurance that any of the forecasts will be achieved.

Use of non-GAAP Financial Measures
This presentation includes non-GAAP financial measures, including Adjusted EBITDA, Adjusted EBITDA less Maintenance Capex (or FCF), and FCF Conversion for Playa. Please refer to the Appendix for a reconciliation of these measures to the
nearest comparable GAAP measures.

Playa believes that these non-GAAP measures are useful to investors for two principal reasons. First, Playa believes these measures assist investors in comparing its performance over various reporting periods on a consistent basis by removing
from operating results the impact of items that do not reflect core operating performance. Second, these measures are used by Playa’s Board and management to assess its performance and may (subject to the limitations described herein)
enable investors to compare the performance of Playa’s portfolio to its competitors.

Playa believes that the use of these non-GAAP financial measures provides an additional tool for investors to use in evaluating ongoing operating results and trends. Management of Playa does not consider these non-GAAP measures in isolation
or as an alternative to financial measures determined in accordance with GAAP.

Other companies may calculate Adjusted EBITDA, Adjusted EBITDA Margin, EBITDA less Capex (or FCF), and FCF Conversion and other non-GAAP measures differently, and therefore Playa’s Adjusted EBITDA, Adjusted EBITDA Margin,
Adjusted EBITDA less Maintenance Capex (or FCF), and FCF Conversion and other non-GAAP measures may not be directly comparable to similarly titled measures of other companies.

Definitions
See the Appendix for certain definitions used in this presentation.

                                                                                                                                                                                                                                                                2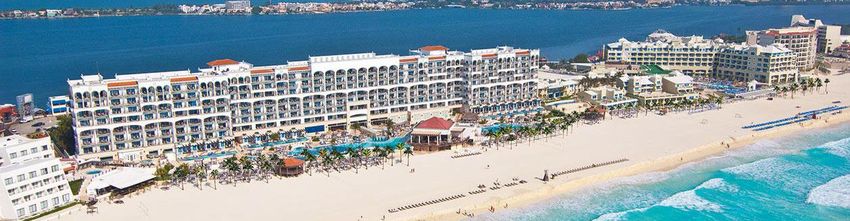
Disclaimer

Additional Information and Where to Find It
Pace and Playa intend to cause Playa Holdco B.V. (“Holdco”) to file with the SEC a registration statement on Form S-4 (the “Registration Statement”), which will include a proxy statement/prospectus with respect to Holdco’s securities to be issued
in connection with the proposed business combination between Pace and Playa. The definitive Registration Statement will contain important information about the proposed business combination and related matters. PACE SHAREHOLDERS ARE
URGED AND ADVISED TO READ THE REGISTRATION STATEMENT CAREFULLY WHEN IT BECOMES AVAILABLE. The Registration Statement and other relevant materials (when they become available) and any other documents filed by
Pace, Holdco or Playa with the SEC may be obtained free of charge at the SEC’s website, at www.sec.gov. In addition, shareholders will be able to obtain free copies of the Registration Statement by directing a request to: Pace Holdings Corp.,
301 Commerce Street, Suite 3300, Fort Worth, Texas 76102, phone: +1 (212) 405-8458, email: Pace@tpg.com, Attn: Mr. Clive D. Bode.

Participants in the Solicitation.
Pace, Playa, Holdco and their respective directors and executive officers may be deemed to be participants in the solicitation of proxies from Pace’s shareholders in connection with the proposed business combination. Information about Pace’s
directors and executive officers is set forth in Pace’s Annual Report on Form 10-K for the fiscal year ended December 31, 2015, which was filed with the SEC on January 26, 2016. These documents are available free of charge at the SEC’s web
site at www.sec.gov, or by directing a request to: Pace Holdings Corp., 301 Commerce Street, Suite 3300, Fort Worth, Texas 76102, phone: +1 (212) 405-8458, email: Pace@tpg.com, Attn: Mr. Clive D. Bode. Information regarding the persons
who may, under SEC rules, be deemed participants in the solicitation of proxies to Pace stockholders in connection with the proposed business combination will be set forth in the Registration Statement for the proposed business combination when
available. Additional information regarding the interests of participants in the solicitation of proxies in connection with the proposed business combination will be included in the Registration Statement that Pace and Playa intend to cause Holdco to
file with the SEC.

                                                                                                                                                                                                                                                       3
Presenters

             Bruce Wardinski                       Karl Peterson
        Chairman & Chief Executive Officer   President & Chief Executive Officer

                                                                                   4
Playa and Pace is a Powerful Combination

                                                     (1)                                                                                                                   (2)

               Highland
              Hospitality

Strategic             Hotel                    Customer                                           Product /                                            Revenue
                                                                         Strategic                                                                                                 Online
 Vision             Operations                 Experience                                          Project                       M+A                  Management
                                                                       Relationships                                                                                             Distribution
                                                                                                 Development
                                         Combination provides significant capital and
                                   complementary capabilities to accelerate the business plan
     (1) Bruce Wardinski, Playa’s CEO, previously served as Chairman and CEO of Barceló Crestline Corporation, Chairman of Highland Hospitality Corporation (NYSE: HIH), Chairman, President
         and CEO of Crestline Capital (NYSE: CLJ), Senior Vice President and Treasurer of Host Marriott Corporation (NYSE: HMT), and currently serves on the Board of Directors of DiamondRock
         Hospitality (NYSE: DRH); Alex Stadlin, Playa’s COO, had an extensive career at Marriott, holding numerous leadership positions globally; Larry Harvey, Playa’s CFO, previously served as
         CFO of Host Hotels and Resorts (NYSE: HST) and is currently Audit Committee Chairman of American Capital Agency (NASDAQ: AGNC) and American Capital Senior Floating (NASDAQ:
         ACSF); Kevin Froemming, Playa’s CMO, previously served for 10 years as President of Unique Vacations (worldwide representative for Sandals and Beaches resorts) and as COO of The
         Mark Travel Corporation’s owned brands
     (2) Karl Peterson, PHC’s CEO was the Co-Founder, President, CEO and a Director of Hotwire.com, is on the Board of Directors of Sabre, and was formerly on the Board of Directors of
         Norwegian Cruise Line; David Bonderman, PHC’s Chairman was on the Board of Directors of Hotwire.com, is Chairman of the Board of Ryanair, is on the Board of Directors of Airbnb, and is   5
         on the Board of Directors of Uber; Karl Peterson to be nominated to the Playa Hotels & Resorts B.V. Board
Playa – The Opportunity

                            Leading Company
                            in Emerging High
                              Growth Sector

     Experienced                                    Attractive Unit
  Management Driving                                Economics and
     Growth and                                          ROIC
     Profitability

     Attractive Valuation                        Current Portfolio
      Relative to Peers                         Not Fully Optimized

                            Pace Transaction
                            Reduces Leverage
                               and Should
                            Accelerate Growth

                                                                      6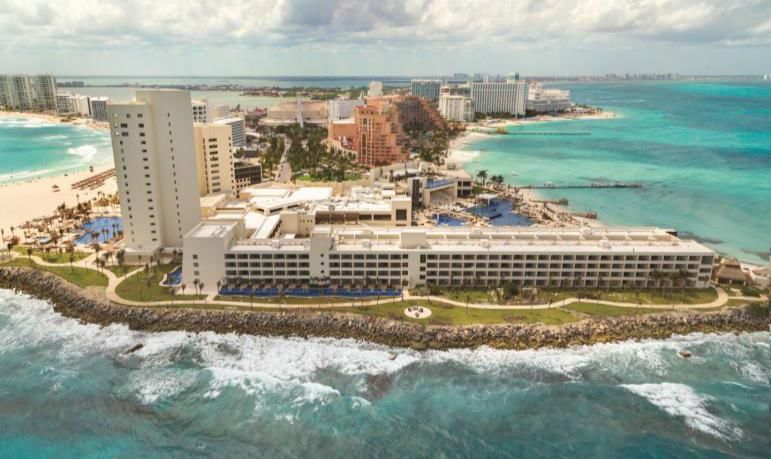
Leading Company in High Growth Emerging Sector

                1   Premier Collection of All-Inclusive Resorts in Desirable Locations

                           2   All-Inclusive is a Superior Business Model within Lodging

                           3    Differentiated Model, Resilient Through Cycles

                           4    Favorable Geographic and Leisure Industry Trends

                               Strategic Relationship with Hyatt to Develop
                           5   All-Inclusive Resorts

                       6   Fragmented Industry Provides Acquisition Opportunities

                7   Experienced Leadership Team with a Proven Track Record

                                                                                           7
1. Premier Collection of All-Inclusive Resorts in Desirable Locations

  Hyatt Ziva and Zilara Rose Hall                               Hyatt Ziva Cancún                      Hyatt Zilara Cancún

   The Royal Playa del Carmen                                 Hyatt Ziva Los Cabos                     Dreams Palm Beach

              13                                       6,142                              193                         $1.6B
        All-Inclusive                                                                Food & Beverage                  Gross
                                                        Rooms
          Resorts                                                                     Establishments               Asset Value (1)

       (1) Represents total gross PP&E as of June 30, 2016.                                                                          8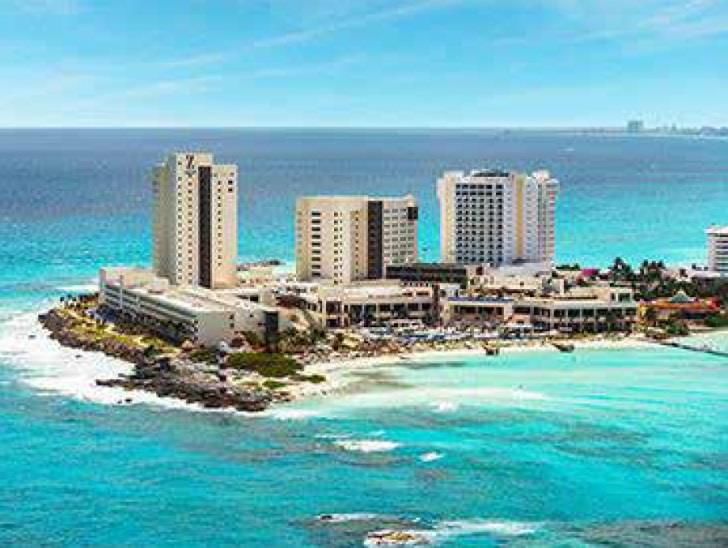
1. Premier Collection of All-Inclusive Resorts in Desirable Locations (Cont’d)

 Playa owns prime beachfront locations
       Situated in Puerto Vallarta’s only private cove               Highly desirable Cancún location

 Hyatt Ziva Puerto Vallarta                                        Hyatt Ziva Cancún

                        1,250 feet of beach front in the heart of Cancún’s Hotel Zone

                                                                                        Gran Caribe Real

 Hyatt Zilara Cancún

                                                                                                           9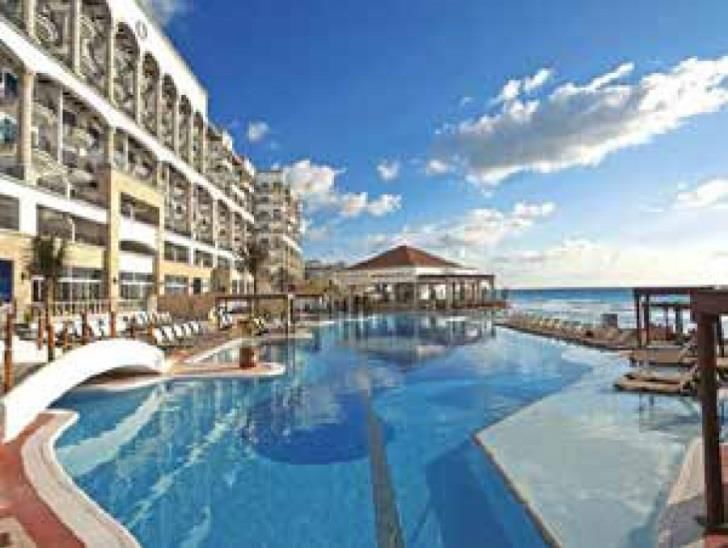
1. Premier Collection of All-Inclusive Resorts in Desirable Locations (Cont’d)

                                                                                                       Managed by Playa Hotels & Resorts
      Location (by rooms)1
                                                                                                       Managed by AMResorts
 13 Resorts / 6,142 Total Rooms
           Jamaica
             10%
Los Cabos /
  Puerto                                     Cancύn /
  Vallarta                                 Riviera Maya
   15%                                         44%

                                                                Mexico
 Dominican
  Republic
   31%                                                    Los Cabos
                                                                                        Cancún /
        Brands (by rooms)1                                            Puerto Vallarta   Riviera Maya   Jamaica
                                                                                                                          Punta Cana
                                                                                                                          La Romana

         30%
                                           36%                                                                             Dominican
                                                                                                                            Republic

             9%
                  8%                 12%
                         5%

                             Strong presence in leading destinations in Mexico and the Caribbean

       (1)   As of October 7, 2016
                                                                                                                                           10
2. All-Inclusive is a Superior Business Model within Lodging
Playa Pacings vs Last Year1 Better Occupancy
Gross Package Revenue On The Books 87% - Playa Stabilized Assets2 90%
13% 75% 75%
13% 12% 15% 66% 70%
14% 75%
15/16 65%
16/17 55% 55%
50%
Nov. Dec. Jan. Feb. Mar.
1. Guests book and pay further in advance with fewer cancelations than US Traditional Traditional All-Inclusive All-Inclusive
European Plan Guests Resort Resort Year- Resort Resort Year-
2. More accurate planning of resources (e.g. in F&B) leads to the efficient
use of labor and less waste Seasonal Round Seasonal Round
High-Margin Ancillary Sales Higher Adjusted EBITDA Margins3
• Non-Package Revenue Opportunities: 30% 27% 25%
1. Spa 22%
2. Fine Wine/Premium Alcohol 10%
3. Wedding Packages
4. Room Upgrades
Playa Upscale Leisure Global Hotel Emerging
• Guests Are More Likely To Buy Non-Package 2016E Lodging Companies Companies Markets Hotel
Products At All-Inclusive Resorts Compared To REITS Companies
Traditional Resorts
Compelling value proposition and defensible high-end positioning
(1) As of November 15, 2016
(2) Reflects FY 2015 figure. Stabilized assets exclude Hyatt Ziva Los Cabos, Hyatt Ziva Cancún, Hyatt Ziva Puerto Vallarta and Hyatt Ziva and Hyatt Zilara Rose Hall
(3) Other companies may calculate Adjusted EBITDA differently than Playa, and therefore, Playa’s Adjusted EBITDA may not be directly comparable to similarly titled measures of other companies
Note: See “Important Information – Use of Projections” at the beginning of this presentation for important qualifications and limitations on the use of projections. Actual results may differ materially. In addition,
please refer to the Appendix for a reconciliation of Adjusted EBITDA to the most comparable GAAP Measure 11
Source: STR and JLL research3. Differentiated Model, Resilient Through Cycles
2008-2009 Decline in Property Adjusted EBITDA (%)
1
-10%
-23% -24%
-32%
-37% -38%
-49% -50%
-63%
The resilience of the all-inclusive model is proven during the 2008-9 economic downturn
(1) Represents Resort Adjusted EBITDA from Dreams Cancún, The ROYAL Cancún, Secrets Capri, Dreams Puerto Aventuras, Dreams Puerto Vallarta, Dreams Punta Cana,
Dreams Palm Beach, Dreams La Romana, Gran Caribe Real, Gran Porto Real and THE Royal Playa del Carmen. Other companies may calculate Property EBITDA differently
than Playa, and therefore, Playa’s Property Adjusted EBITDA may not be directly comparable to similarly titled measures of other companies. See Appendix for a reconciliation of
Adjusted EBITDA to the most comparable GAAP Measure
Source: Playa Hotels & Resorts B.V. for Playa and publically available sources for other companies
124. Favorable Geographic and Leisure Industry Trends
Constrained Supply Favourable Customer Mix
Relatively Low Supply Pipeline Leisure Business
(Pipeline as a % of Existing Supply1)
29%
27%
22% 22%
21%
70%
20%
19%
100%
14% 14% 14%
Playa’s Primary Markets
13%
12%
11%
10% 10% 10% 10%
9% 9% 9%
7% 7% 7%
30%
5% 5%
2% 2% 2%
Selected US Public Lodging Playa Hotels
Companies & Resorts B.V.
Miami
Denver
Dom. Rep.
New York
Detroit
Chicago
Houston
Washington
Phoenix
Las Vegas
Dallas
Philadelphia
Anaheim
Los Angeles
New Orleans
San Diego
St. Louis
Virginia Beach
Boston
Tampa
Atlanta
Orlando
Oahu
Nashville
Seattle
Minneapolis
Yucatan Pen.
San Francisco
Price elasticity of leisure travelers vs business allows
for better RevPAR management
Secular Penetration of Visitors
(000’s of Tourist Arrivals)
Mexico Dominican Republic Jamaica
42,028 5,892
5,081 2,638
34,078
4,465
29,346 2,189
2,080
2014 2016E 2020E 2014 2016E 2020E 2014 2016E 2020E
More stable macro fundamentals…
(1) As of May 2016
Source: Wall Street research, BMI research, Smith Travel research, and JLL research 134. Favorable Geographic and Leisure Industry Trends (Cont’d)
Benefit to consumer: increased supply and
Open Skies Agreement
lower rates2
Agreement provides unregulated access
$242
for passenger airlines to fly between any 10,724
9,999
city in Mexico and any city in the United $207
States
Seat Capacity Average Fares
Has led to:
Sep-Dec 15 Sep-Dec 16 Jan-Aug 15 Jan-Aug 16
1. Increased flights
Positive RevPar vs US
• Capacity through October 2017 is
scheduled to increase 8% YoY2 Cancύn RevPAR¹
US Upper-Upscale RevPAR
$208 $217
2. Lower Prices $173
$148
$129 $133
$113 $115 $104
As local customs enter some markets $124 $130
$111 $110 $116
should also lead to more non-stop city $102 $91 $97 $103
2007 2008 2009 2010 2011 2012 2013 2014 2015
pairs
…and U.S. Open Skies helps to drive better RevPAR outlook
(1) Average annual RevPAR from Barcelό Costa Cancún, Barcelό TuCancún, Hyatt Ziva Cancún (FKA Dreams Cancún), Secrets Capri, Dreams Puerto Aventuras, Hyatt Zilara
Cancún (FKA THE Royal Cancún), THE Royal Playa del Carmen, Gran Caribe Real and Gran Porto Real
(2) Sabre data 14
Source: Wall Street research; BMI research; Smith Travel research; JLL research; Sabre Consulting, Impact of Open-Skies Aviation Bilateral Agreement (October 2016)5. Strategic Relationship With Hyatt To Develop All-Inclusive Resorts
Locations Strategic Alliance Overview Positive Impact
• Partnership with Hyatt to develop and operate Pre Post
all-inclusive resorts under Hyatt Ziva and $298
Zilara brands
ADR $225
• Sole franchisee of Hyatt all-inclusive brands
($)
• Playa owns and manages
Hyatt Zilara Cancún Hyatt Ziva Cancún the properties
• Opportunity to expand into
2013A (1) 2016E (1)
additional markets
• Hyatt will own 11% of Playa post combination2 $220
$169
RevPAR
($)
Hyatt Ziva / Zilara Rose Hall
Key Benefits
• Hyatt’s commitment contributes 2013A (1) 2016E (1)
to Playa’s success
• Hyatt brand drives visitation
$58mm
Adjusted
• Hyatt distribution channel is a driver
EBITDA
of higher occupancy and rates $31mm
($M)
• Improved business economics
Hyatt Ziva Puerto Vallarta Hyatt Ziva Los Cabos • Higher average rate and number of groups
• Improvement in TripAdvisor ratings 2013A (1) 2016E (1)
Hyatt partnership drives higher ADR and occupancy leading to increased Adjusted EBITDA
But still potential for upside from better marketing of “All-Inclusive”
(1) Includes Hyatt Ziva Cancύn, Hyatt Zilara Cancύn, Hyatt Ziva Los Cabos, and Hyatt Ziva Puerto Vallarta; See “Important Information – Use of Projections” at the beginning of this
presentation for important qualifications and limitations on the use of projections. Actual results may differ materially. In addition, please refer to the Appendix for a reconciliation
of Adjusted EBITDA to the most comparable GAAP Measure 15
(2) Assumes transaction structure and summary from pg. 336. Fragmented Industry Provides Acquisition Opportunities
Overview Industry Fragmentation
• High degree of
fragmentation in Playa’s 987
markets with only 19% of
hotels under internationally
recognized brands
• Playa intends to acquire
resorts that are
undermanaged or 798
inappropriately branded
and to pursue select Total Hotels 379
development projects
• Will be only dedicated player Unbranded 328 182
in space with access to 126 112 108
151 68 189
public equity capital Internationally 110 85 59 11
12
Branded 51 49 14 54 1
31 16 27
• Active pipeline and regularly Riviera Cancún Puerto
Maya
Los
Vallarta Cabos
Punta Montego
Cana
La
Bay Romana
Total
evaluates acquisition and
M&A opportunities
Branded 13% 17% 13% 24% 45% 21% 8% 19%
Playa
4 3 1 1 2 1 1
Hotels
Source: TripAdvisor
167. Experienced Leadership Team with a Proven Track Record
Years in Time at
Experience
Industry Playa
• Founded Playa Hotels & Resorts in 2006
• Previously served as Chairman and CEO of Barceló Crestline Corporation
Bruce
Wardinski 29 10 • Former Chairman of Highland Hospitality Corporation (NYSE: HIH)
Chairman & Chief
Executive Officer
years years • Former Chairman, President and CEO of Crestline Capital (NYSE: CLJ)
• Former Senior Vice President and Treasurer of Host Marriott Corporation (NYSE: HMT)
• Serves on the Board of Directors of DiamondRock Hospitality (NYSE: DRH)
Alex Stadlin • Joined Playa as COO in 2008
Chief Operating Officer 38 8
and Chief Executive
years years • CEO of Playa Management
Officer of Management
Co • Extensive career at Marriott, holding numerous leadership positions globally
• Joined Playa as CFO in 2015
Larry Harvey 22 1+ • Served as CFO of Host Hotels and Resorts (NYSE: HST)
years years
Chief Financial Officer
• Audit Committee Chairman of American Capital Agency (NASDAQ: AGNC) and
American Capital Senior Floating (NASDAQ: ACSF)
• Joined Playa as CMO in 2013
Kevin
Froemming
21 3 • Previously served for 10 years as President of Unique Vacations (worldwide
years years representative for Sandals and Beaches resorts)
Chief Marketing Officer
• Served as COO of The Mark Travel Corporation’s owned brands
Experienced
Experiencedteam
teamwith
with strong executioncapabilities
strong execution capabilities
17Financial Overview
Current Portfolio Not At Full Potential
A Transaction Designed to Help Accelerate Growth

                      Optimize Current Portfolio

                     Recently Redeveloped Assets Still Ramping Up

                         Recognizable Consumer Branding Opportunity

                            Externally Managed Resorts Understate Potential Portfolio
                            Profitability

                             Significant Improvement of the Distribution Strategy

                                Strong Balance Sheet to Expand

                            Capital Deployment: Pent Up Demand of Projects in Existing Assets

                         Capital Deployment: Buy and Upgrade Undermanaged Assets

                      Capital Deployment: Develop New Properties

                      Other Upsides

                                                                                                19
Recently Redeveloped Assets Still Ramping Up
Redevelopment Assets – Operating Metrics
Hyatt Ziva and Zilara Rose Hall Adjusted EBITDA ($M) Hyatt Ziva Cancύn Adjusted EBITDA ($M)
$20 $25
Renovations: $17
Grand Re-Opening: $13
[Q2’14 – Q4’15]
[December 2014]
$7
$3
$0 $0 $1 $1
2013 2014 2015 2016 2017 2013 2014 2015 2016 2017
Occupancy 0% 56% 63% 65% 70% Occupancy 85% 87% 43% 76% 84%
RevPAR $0 $97 $184 $232 $259 RevPAR $171 $201 $143 $229 $278
Hyatt Ziva Puerto Vallarta Adjusted EBITDA ($M) Hyatt Ziva Los Cabos Adjusted EBITDA ($M)
Renovations: $22
$8
[Q2’14 – Q4’14] Renovations: $19
$6 [Q3’14 – Q3’15]
$4 $10
$3
$2 $6 $6
2013 2014 2015 2016 2017 2013 2014 2015 2016 2017
Occupancy 78% 73% 57% 70% 72% Occupancy 58% 63% 47% 69% 70%
RevPAR $141 $173 $119 $161 $175 RevPAR $136 $148 $117 $203 $222
4 resorts expected to drive Adjusted EBITDA growth of an estimated $20mm in 2017
Note: See “Important Information – Use of Projections” at the beginning of this presentation for important qualifications and limitations on the use of projections. Actual results may differ
materially. In addition, please refer to the Appendix for a reconciliation of Adjusted EBITDA to the most comparable GAAP Measure 20
Source: Playa Hotels & Resorts B.V.Recognizable Consumer Branding Opportunity and Ability to
Internalize Management
Panama Jack Branding Overview Overview of Externally Managed Assets
• Partnership with Panama Jack for an exclusive licensing • 5 Playa resorts currently managed by AMResorts
agreement, pairing Playa with a well-known, respected
global consumer brand that is well positioned to accelerate Resort Contract Expiration
demand in consumer markets Dreams La Romana 2017
• Signed in November 2016; will be announced to trade in Secrets Capri 2022
January 2017
• Goal is to create an exclusive 4-star brand that sits right Dreams Puerto Aventuras 2022
below the Hyatt offering and will help refresh existing Dreams Palm Beach 2022
assets
Dreams Punta Cana 2022
• Opportunity to lift ADR and improve distribution through
improved direct bookings
Planned Initial Resort Conversions Contract Internalization Opportunity
• Successful history of internalization of Barceló and
AMResorts contracts:
– Barceló Los Cabos (2013)
– Dreams Puerto Vallarta (2014)
– Dreams Cancύn (2015)
• Potential savings from management fees
• Potential upside from internalization of distribution could
provide additional high margin savings
Expect Panama Jack partnership will help improve ADRs and reduce distribution costs;
Management fees currently paid to AMResorts understate the potential profitability of the portfolio
Source: Playa Resorts & Hotels B.V.
21Significant Improvement of the Distribution Strategy
Direct Distribution Key Initiatives
Playa Comparables • Improve Website
Channel Better
Conversion
Increased
Marketing
50% Efficiency
60%
80% Higher
Other 91% Traffic
Of which
66% • Downward trend in
wholesale commissions
50%
40%
20% • Continue to Focus on Higher
Direct 9% Value, Lower Cost Third
Current Target U.S. Independent U.S. Party Channels
Lodging Branded Lodging
Illustrative • Other Direct Initiatives
Distribution Cost 1 23% 15% 21% 17%
• Additional Hyatt Mix
Illustrative Adjusted
EBITDA $51M $14M $39M • Repeat/Loyalty/Club
Improvement (’17E)2 Initiatives
(1) Assumes Direct Distribution cost of 5% and Other cost of 25%
(2) Percentage margin increase multiplied by forecasted 2017E Gross Package Revenue of $621M. See “Important Information – Use of Projections” at the beginning of this presentation for important qualifications and limitations on the use of projections.
Actual results may differ materially. In addition, please refer to the Appendix for a reconciliation of Adjusted EBITDA to the most comparable GAAP Measure. Other companies may calculate Adjusted EBITDA differently than Playa, and, therefore, Playa’s
Adjusted EBITDA may not be directly comparable to similarly titled measures of other companies.
Source: Playa Hotels & Resorts B.V. (June 2016), Phocuswright, Independent Lodging Market: Marketing, Distribution and Technology Strategies for Non-Branded Properties (October 2015); Morgan Stanley, Hotel Brands vs. OTAs: Who Will Win the War?
(May 2016)
22Playa Has a Pipeline of Attractive ROIC Opportunities
Redevelop Existing Buy and Upgrade
Small Investment Projects
Assets Undermanaged Assets
Hyatt Ziva & Dreams La Dreams Palm
Hyatt Ziva Cancύn
Zilara Rose Hall Romana Beach
Example
Acquisition: $66M
Capital Redevelopment: $81M
Redevelopment: $87M
Project Costs: $3M Project Costs: $3M
Jun. 2014 – Nov. 2015 Sep. 2014 Sep. 2014
Expenditure Aug. 2013 – Dec. 2014
New Construction New Construction
1. New beach tower 1. Zilara Building
• 12 floors, as well as 169 new rooms, New Construction
• 124 New Rooms New Construction
a spa, and beach restaurant 1. Addition of 6 new rooms
• Lobby-reception, bar & lounge and 1. Addition of Preferred Lounge
2. New central facilities building 2. Addition of bar and preferred
restaurant Renovations
• Lobby / reception, rooftop lounge & lounge
2. Rose Hall Village
Capital pool and 7 restaurants & bars
3. New village corridor
• 69 new rooms
Renovations
1. Renovation of 122 rooms
1.
2.
Renovation of 120 rooms
Renovation of pool
• 5 restaurants & 3 bars 3. Renovation of Kid’s Club
Deployment • 3 F&B outlets, gym, kid’s club, sky
wedding roof deck and retail shops
• Outdoor terrace for dining and shows
2.
3.
Renovation of pool
Renovation of El Patio restaurant 4. Renovation of Corezone
• Sky wedding lounge
Description 4. New parking structure
• 128 parking spaces and rooftop
Renovations
tennis courts 1. Soft-goods renovation of all rooms and
public areas
5. External areas
2. New laundry and kitchen equipment
• New pools, including completely
refurbished dolphin pool and new 3. 12 new pools with 2 wet and dry bars
beach restaurant 4. New Zilara Beach Restaurant & Spa
CoC Return1 2017E: 22% 2017E: 14% 2015A: 30% 2015A: 30%
Playa has invested in opportunistic ROIC opportunities
(1) Redevelop Existing Assets and Buy and Upgrade Undermanaged Assets: Cash-on-Cash return calculated by dividing the incremental Adjusted EBITDA generated by the renovation by the redevelopment
cost. Small Investment Projects: Incremental Revenue divided by Total Project Costs. See “Important Information – Use of Projections” at the beginning of this presentation for important qualifications and
limitations on the use of projections. Actual results may differ materially.
23Playa Has a Pipeline of Attractive ROIC Opportunities (Continued)
Greenfield Developments Pipeline of Actionable Projects
Hyatt Cap Cana2 Improvements in Jamaica
Example
DOMINICAN REPUBLIC Punta
Punta Cana
Cana
Punta Cana Royal Playa del Carmen
Cap Cana
Capital 2 Year Development Hyatt Zilara Cancun
Expenditure Timeline
Gran Porto
Capital • Cap Cana is one of the best
Deployment beach resort areas in the
Gran Caribe
Dominican Republic
Description
2017E Discretionary Project
Capex: $25m3
CoC Return1 2022E2,3: ~17% CoC Returns: 20%+3
Pace/Playa will accelerate investments in high ROIC investments
(1) Cap Cana: Cash-on-Cash return calculated by dividing the estimated incremental Adjusted EBITDA generated by the renovation by the redevelopment cost; Pipeline of Actionable Projects: Estimated
Incremental Revenue divided by Total Project Costs
(2) There remain significant contingencies that would need to be satisfied prior to Playa being able to purchase and develop the asset. Currently Playa has deposited $6M in an escrow account for this
transaction. If developed, Cap Cana construction is expected to be complete by end of 2018E and the resort would open in 2019E. Steady state reached in 2022E.
(3) See “Important Information – Use of Projections” at the beginning of this presentation for important qualifications and limitations on the use of projections. Actual results may differ materially.
24Other Upsides
Manage External Resorts FX Tailwinds Tax Structure
• Substantial opportunity to grow USDMXN Exchange Rate • Structurally lower tax rate as a
asset light by adding resorts result of Mexican and Caribbean
under management Each Mex$1 change resort locations as well as Dutch
$24 in the Peso/Dollar incorporation
• Playa plans to leverage its exchange rate
Spot:
management platform to add a $22 represents a ~$6M
Mex$20.33
capital-light growth component reduction in opex
to its business model $20 Outlook Rate: Mex$18.25
• Projected future annual effective
• Combines the benefit of $18
tax rate of less than 15% of
owned assets generating Earnings before Taxes
robust cash flow with $16
managed assets generating
high returns $14
on invested capital • Cash taxes typically significantly
$12 ~80% of Playa’s costs are less than book tax
• Playa is currently in in local currencies and
~40% are in Mexican Pesos
discussions to obtain
$10
a number of third party Jan 14 Jan 15 Jan 16
management contracts
MXNUSD Annual Average
Attractive and quantifiable additional upsides
Note: Market data as of December 9, 2016
Source: Playa Hotels & Resorts B.V. & Capital IQ 25Summary Historical Financial Data and Projections (Assumes Mex$18.25 in
2017E)
Net Revenue Adjusted EBITDA
In USDm ’15A-’17E In USDm ’15A-’17E
Stabilized Redevelopment¹ CAGR Stabilized² Redevelopment¹ CAGR
700 250
600 553 18%
510 200 180 33%
500 153
399 211 64%
400 362 359 186 150 74 178%
51 78 102 55
300 86 89 90
100 10
21 13
200 3%
308 321 324 342 7%
276 50 92 98 105
100 68 76
0 0
2013A 2014A 2015A 2016E 2017E 2013A 2014A 2015A 2016E 2017E
% Margin 24.6% 24.9% 25.5% 30.0% 32.5%
Capex3 Adjusted EBITDA – Maintenance Capex
In USDm In USDm ’15A-’17E
Maintenance Other Growth CAGR
200 200
158 29%
150 132 150 134
120
94
100 84 100 84 77
119 50
112
50 79 50
19 28
1
12 7 19 22
0 5 0
Maintenance 2013A 2014A 2015A 2016E 2017E 2013A 2014A 2015A 2016E 2017E
% of 1.5% 3.4% 1.9% 3.7% 4.0% % Margin 23.1% 21.6% 23.6% 26.3% 28.5%
Revenue
Strong growth and margin expansion in 2017
(1) Includes Hyatt Zilara and Ziva Rose Hall, Hyatt Ziva Cancύn, Hyatt Ziva Los Cabos, Hyatt Puerto Vallarta
(2) Includes corporate expenses
(3) Does not include capex for Cap Cana development
Note: 2017E projections based on a USDMXN FX rate of Mex$18.25. See “Important Information – Use of Projections” at the beginning of this presentation for important qualifications and limitations on the use of projections. Actual results may
differ materially. In addition, please refer to the Appendix for a reconciliation of Adjusted EBITDA to the most comparable GAAP Measure 26
Source: Playa Hotels & Resorts B.V.Playa Adjusted EBITDA Bridge –
Existing Portfolio Before New Projects and Developments (Assumes
Mex$18.25 in 2017E)
Additional
($ in Millions)
Opportunities
$17 $5 $180 1. Further Improved
($2) Distribution
$45 $7
$153 2. AMResorts
management
($6) internalization
3. Continued
$23 $12 stabilisation of
$102 redeveloped
$90 ($4) properties
($7)
2014A Adjusted Existing Redev. Corporate 2015A Adjusted Existing Redev. Corporate 2016E Adjusted Existing Redev. Distribution Corporate 2017E Adjusted
EBITDA Assets Assets¹ Expenses EBITDA Assets Assets¹ Expenses EBITDA Assets Assets¹ and Other Expenses EBITDA
Improvements Guidance
Pace estimates 2017E Adjusted EBITDA of $180m
(1) Includes Hyatt Zilara and Ziva Rose Hall, Hyatt Ziva Cancύn, Hyatt Ziva Los Cabos, Hyatt Puerto Vallarta
Note: 2017E projections based on a USDMXN FX rate of Mex$18.25. See “Important Information – Use of Projections” at the beginning of this presentation for important qualifications and 27
limitations on the use of projections. Actual results may differ materially. In addition, please refer to the Appendix for a reconciliation of Adjusted EBITDA to the most comparable GAAP MeasureProposed Transaction Overview
Proposed Transaction Overview1

                                   • Enterprise value to Playa shareholders of $1,753m
                                   • All current Playa Common Shareholders rolling 100% of their stakes
                                   • Pace Sponsor Shares of $75m
                                        • Pace Sponsor will cancel $37.5m out of $112.5m Sponsor Shares
                                        • Pace Sponsor will cancel one third of the Sponsor Warrants and new warrants of
                                          equivalent value will be issued to the Playa Shareholders
   Transaction
                                   • $30m of Earnout warrants(2) vesting at $13.00
    Highlights
                                        • One third to Playa Shareholders
                                        • Balance to Pace Sponsor
                                   • $500m raise
                                        • $450m from Pace cash in trust
                                        • $50m from additional PIPE raise
                                   • 2016E Net Debt of $679m post money

                                    • Repayment of Prefs of $346m
                                    • Fees: $28m
 Use of Proceeds                       • $16m Pace underwriting fees
                                       • $12m deal fees
                                    • Additional cash on balance sheet: $127m

  Management                          • Current Playa management to continue to run the business
   and Board                          • Pace to appoint 3 Board seats out of 10

    (1)   Balance sheet estimates as of 12/31/2016
    (2)   Exercise price equal to 10 Euro cents. Warrants become exercisable upon Holdco stock trading at $13 or higher for 20 out of any consecutive 30 days. Expire five years from Closing.   29
Playa Comparable Companies: Operating Performance
2015A-17E Revenue CAGR
18%
Stronger Playa forecasted
revenue growth 5% 7%
Forecasted 4%
meaningfully 1%
0%
Revenue… higher than peers
Select Lodging Cruises Ski Resorts REITs
C-Corps
2015A-17E Adj. EBITDA CAGR
33%
Adj. EBITDA
…And growth 17%
9% 10%
EBITDA significantly 4%
higher than peer (1%)
Growth
average Select Lodging Cruises Ski Resorts REITs
C-Corps
2015A Free Cash Flow Conversion¹
93%
78%
Highly cash 52% 65% 63%
Superior
generative 24%
Cash compared with
Conversion peers
Select Lodging Cruises Ski Resorts REITs
C-Corps
Playa displays superior operating performance to peers…
(1) Defined as Adj. EBITDA minus CapEx divided by Adj. EBITDA for comparable companies; Adj. EBITDA minus Maintenance CapEx divided by Adj. EBITDA for Playa.
Note: Market data as of December 9, 2016; Select Lodging C-Corps is median of Hilton, Hyatt, and Melia; Cruises is median of Carnival, Royal Caribbean, and Norwegian Cruise Line; Ski Resorts is median of Vail Resorts and Intrawest Resorts; REITs is median of Host
Hotels, Sunstone Hotel, LaSalle Hotel, DiamondRock, Pebblebrook, FelCor, Xenia, Ryman, Ashford. Note: 2017E projections based on a USDMXN FX rate of $18.25. See “Important Information – Use of Projections” at the beginning of this presentation for important
qualifications and limitations on the use of projections. Actual results may differ materially. In addition, please refer to the Appendix for a reconciliation of Adjusted EBITDA to the most comparable GAAP Measure. Other companies may calculate Adjusted EBITDA and FCF
Conversion differently than Playa, and, therefore, Playa’s measures may not be directly comparable to similarly titled measures of other companies.
Source: Capital IQ
30Playa Comparable Companies: Valuation
EV/2017E Adjusted EBITDA
13.6x
13.0x
Deal valuation at
Attractive discount to 11.5x
Valuation peers on Adj. 10.6x 10.7x
on EBITDA EBITDA multiple 9.7x
basis
Select Cruises Ski Resorts REITs
Lodging C-
Corps
EV/2017E Adjusted - CapEx EBITDA
23.1x
21.4x
Playa is valued
…And even more 15.5x
16.9x 16.9x
EBITDA - favorably on an
CapEx Adj. EBITDA – 11.1x
CapEx basis
Select Cruises Ski Resorts REITs
Lodging C-
Corps
…at a discounted multiple to comparable companies
Note: Market data as of December 9, 2016; Select Lodging C-Corps is median of Hilton, Hyatt, and Melia; Cruises is median of Carnival, Royal Caribbean, and Norwegian Cruise Line; Ski Resorts is median of Vail Resorts and Intrawest Resorts; REITs is median of Host
Hotels, Sunstone Hotel, LaSalle Hotel, DiamondRock, Pebblebrook, FelCor, Xenia, Ryman, Ashford. Note: 2017E projections based on a USDMXN FX rate of $18.25. See “Important Information – Use of Projections” at the beginning of this presentation for important
qualifications and limitations on the use of projections. Actual results may differ materially. In addition, please refer to the Appendix for a reconciliation of Adjusted EBITDA to the most comparable GAAP Measure. Other companies may calculate Adjusted EBITDA differently
than Playa, and Playa calculates Adjusted EBITDA – CapEx as Adjusted EBITDA – Maintenance CapEx. Therefore, Playa’s measures may not be directly comparable to similarly titled measures of other companies.
Source: Capital IQ
31An Attractive Entry Valuation – Other Statistics
EV / EBITDA
39.0x
Precedent
17.0x
Transaction 9.7x 11.9x 13.5x 14.0x
11.0x 10.0x 10.0x
13.4x 11.3x 12.7x 14.0x
8.2x
EV/ EBITDA
1
Hilton Mariott Fairmont Louvre Club Med Delta Hotels Protea Hilton Four Fairmont Hilton La Quinta Wyndham
/ HNA / Starwood / Accor Hotels / Fosun / Marriott² Hospitality Hotels / Seasons Raffles International / Blackstone Intl.
/ Jin Jiang / Mariott² Blackstone / Kingdom / Kingdom / Hilton / Blackstone
$285k
$1,753
$1,644
$1,406
Significant
Embedded
Real Estate
Value ($M,
Key in
$000s)
Enteprise Value Gross PP&E Net PP&E $/
(Sep-16) (Sep-16) Key
Attractive entry valuation and significant asset backing compared to comps
(1) Based on $1.75B enterprise value and $180M of Adjusted EBITDA
(2) Represents a trailing 12-month EBITDA multiple
Note: Other companies may calculate Adjusted EBITDA differently than Playa, and, therefore, Playa’s Adjusted EBITDA may not be directly comparable to similarly titled measures of other 32
companiesProposed Transaction Summary
Illustrative PF Valuation(1) Ownership at Close(3)
Playa illustrative share price $10.00 Other Playa 8%
Pro forma shares outstanding 107.38 Hyatt 11%
Total pro forma equity value $1,074
(1)
Pro forma net debt $679 Pace Public 42%
Pro forma enterprise value $1,753
Transaction Multiples
Farallon 28%
2017E EBITDA $180 9.7
2017E EBITDA - Maintenance Capex $158 11.1 Pace - PIPE 5% Pace - Founder 7%
Sources and Uses(1) PF Capitalisation – Dec 16(1)
Sources USDm USDm
Existing SPAC cash in trust 451 Cash (1) (159)
PIPE Proceeds 50 RCF -
Total Sources 501 TLB 363
Senior Unsecured 475
Net Debt 679
Uses
(1)
x 2017 Adjusted EBITDA 3.8
Repayment of Preferred Shares 346
Fees(2) 28
Extra cash on Balance Sheet 127
Total Uses 501
(1) Estimated December 31, 2016 balance sheet values. Cap Cana escrow cash included in unrestricted cash. Assumes no redemptions.
(2) Current estimate: $16m Pace underwriting fees, $13m deal fees 33
(3) Other outstanding instruments: 45m warrants for 15m shares at $11.50 per share; 22m founder warrants for 7.3m shares at $11.50 per share; 30m of Earnout warrants vesting at $13.00Indicative Timetable
Date Event
• Business Combination Agreement Executed
December 13
• Transaction Announced
As Soon As Possible After Announcement • Preliminary Proxy Materials Filed with SEC
Q1 2017 • Set Record Date for Shareholder Vote
Q1 2017 • Mail Final Proxy Materials to Shareholders
Q1 2017 • Hold Shareholder Vote and Close Transaction
Note: Subject to SEC review timetable
34Appendix
Playa Portfolio Overview

                                               1                                                        2
    Hyatt Zilara Cancún                                                     Hyatt Ziva Cancún                                                            3
                                                                                                                           Gran Caribe Real

                                               4                                                       5                                                 6
      Gran Porto Real                                              THE Royal Playa del Carmen                               Secrets Capri

                                                                                                                                              Significant (1)
                                                                                                                            Year Built       Renovations Rooms
                                                          1 Hyatt Zilara Cancún                 Cancún, Mexico                2006       /      2013      307
                                                          2 Hyatt Ziva Cancún                   Cancún, Mexico                1975       /      2015      547
                                                          3 Gran Caribe Real                    Cancún, Mexico                1985       /      2009      470
                                                          4 Gran Porto Real                     Playa del Carmen, Mexico      1996       /      2012      287
                                                          5 THE Royal Playa del Carmen          Playa del Carmen, Mexico      2002       /      2009      513
                                               7          6 Secrets Capri                       Riviera Maya, Mexico          2003       /      2003      291
  Dreams Puerto Aventuras
                                                          7 Dreams Puerto Aventuras             Riviera Maya, Mexico          1991       /      2009      305

    (1) Includes renovations, repositionings and expansions
                                                                                                                                                             36
Playa Portfolio Overview
8 9
Hyatt Ziva Puerto Vallarta Hyatt Ziva Los Cabos
10 11 12
Dreams La Romana Dreams Palm Beach Dreams Punta Cana
Significant (1)
Year Built Renovation Rooms
8 Hyatt Ziva Puerto Vallarta Puerto Vallarta, Mexico 1969 / 2014 335
9 Hyatt Ziva Los Cabos Cabo San Lucas, Mexico 2007 / 2015 591
10 Dreams La Romana La Romana, Dominican Republic 1997 / 2008 756
11 Dreams Palm Beach Punta Cana, Dominican Republic 1994 / 2008 500
13 12 Dreams Punta Cana
Hyatt Ziva & Zilara Rose Hall – Jamaica Punta Cana, Dominican Republic 2004 / 2004 620
13 Hyatt Ziva and Hyatt Zilara Rose Hall Montego Bay, Jamaica 2000 / 2014 620
(1) Includes renovations, repositionings and expansions
37Reconciliation of EBITDA and Adjusted EBITDA
($ in Millions)
Nine Months Ended September 30, Year Ended December 31,
2016 2015 2015 2014
Net income (loss) $45 $23 $10 ($38)
Interest Expense $41 $37 $50 $41
Income tax benefit ($5) ($5) ($2) ($29)
Depreciation and amortization $39 $34 $46 $66
EBITDA $119 $89 $104 $40
Other expense (income), net $2 $1 $2 $11
Impairment loss - - - $7
Management termination fees - - - $0
Pre-opening expense - $3 $4 $13
Transaction expense $4 $5 $5 $12
Severance expense - - - $3
Other tax expense $1 $2 $2 $1
Jamaica delayed opening accrual - ($0) ($1) $2
Insurance proceeds ($0) ($14) ($14) -
Adjusted EBITDA $126 $85 $102 $90
Less: Non-comparable Adjusted EBITDA ($27) ($5) ($10) ($14)
Comparable Adjusted EBITDA EBITDA $99 $79 $92 $76
38Definitions
Gross ADR
“Gross ADR” represents total Gross Package Revenue for a period divided by the total number of rooms sold during such period. Gross
Package ADR trends and patterns provide useful information concerning the pricing environment and the nature of the guest base of
Playa’s total portfolio or comparable portfolio, as applicable. Gross Package ADR is a commonly used performance measure in the all-
inclusive segment of the lodging industry, and is commonly used to assess the stated rates that guests are willing to pay through various
distribution channels.
Net ADR
“Net ADR” represents total Net Package Revenue, defined as Gross Package Revenue less Distribution and Marketing Fees as well as
Compulsory Tips and Taxes, for a period divided by the total number of rooms sold during such period. Net Package ADR trends and
patterns provide useful information concerning the pricing environment and the nature of the guest base of Playa’s total portfolio or
comparable portfolio, as applicable. Net Package ADR is a commonly used performance measure in the all-inclusive segment of the
lodging industry, and is commonly used to assess the stated rates that guests are willing to pay through various distribution channels.
Net RevPAR
“Net RevPAR” is the product of Net ADR and the average daily occupancy percentage. Net RevPAR does not reflect the impact of non-
package revenue. Although Net RevPAR does not include this additional revenue, it generally is considered the key performance measure
in the all-inclusive segment of the lodging industry to identify trend information with respect to net room revenue produced by our total
portfolio or comparable portfolio, as applicable, and to evaluate operating performance on a consolidated basis or a regional basis, as
applicable.
Total Net Revenue
We derive “Total Net Revenue” from the sale of all-inclusive packages, which include room accommodations, food and beverage services
and entertainment activities, net of compulsory tips paid to employees in Mexico and Jamaica. Government mandated compulsory tips in
the Dominican Republic are not included in this adjustment as they are already excluded from revenue.
EBITDA
We define “EBITDA,” a non-GAAP financial measure, as net income (loss), determined in accordance with GAAP, for the period
presented, before interest expense, income tax benefit and depreciation and amortization expense.
FCF
We define “FCF” as Adjusted EBITDA minus Maintenance CapEx
39Definitions
Adjusted EBITDA
Playa defines “Adjusted EBITDA,” a non-GAAP financial measure, as EBITDA further adjusted to exclude the following items:
• Other expense (income), net
• Impairment loss
• Management termination fees
• Pre-opening expenses
• Transaction expenses
• Severance expenses
• Other tax expense
• Jamaica delayed opening expenses
• Insurance proceeds
Playa believes that Adjusted EBITDA is useful to investors for two principal reasons. First, Playa believes Adjusted EBITDA assists investors in comparing Playa's
performance over various reporting periods on a consistent basis by removing from Playa's operating results the impact of items that do not reflect Playa's core
operating performance. For example, changes in foreign exchange rates (which are the principal driver of changes in other expense (income), net), and expenses
related to capital raising, strategic initiatives and other corporate initiatives, such as expansion into new markets (which are the principal drivers of changes in
transaction expenses), are not indicative of the operating performance of Playa's resorts. The other adjustments included in Playa's definition of Adjusted EBITDA
relate to items that occur infrequently and therefore would obstruct the comparability of Playa's operating results over reporting periods. For example, impairment
losses, such as those resulting from hurricane damage, and related revenue from insurance policies, other than business interruption insurance policies, as well as
expenses incurred in connection with closing or reopening resorts that undergo expansions or renovations, are infrequent in nature, and Playa believes excluding
these expense and revenue items permits investors to better evaluate the core operating performance of Playa's resorts over time.
The second principal reason that Playa believes Adjusted EBITDA is useful to investors is that it is considered a key performance indicator by Playa's Board and
management. In addition, the compensation committee of Playa's Board determines the annual variable compensation for certain members of Playa's management
based, in part, on consolidated Adjusted EBITDA. Playa believes that Adjusted EBITDA is useful to investors because it provides investors with information utilized by
Playa's Board and management to assess Playa's performance and may (subject to the limitations described below) enable investors to compare the performance of
Playa's portfolio to Playa's competitors.
Adjusted EBITDA is not a substitute for net income (loss) or any other measure determined in accordance with GAAP. There are limitations to the utility of non-GAAP
financial measures, such as Adjusted EBITDA. For example, other companies in Playa's industry may define Adjusted EBITDA differently than Playa does. As a result,
it may be difficult to use Adjusted EBITDA or similarly named non-GAAP financial measures that other companies publish to compare the performance of those
companies to Playa's performance. Because of these limitations, Adjusted EBITDA should not be considered as a measure of the income or loss generated by Playa's
business or discretionary cash available for investment in Playa's business, and investors should carefully consider Playa's GAAP results presented in this
presentation.
Adjusted EBITDA Margin (Page 11 Comparison)
Upscale Lodging REIT: DiamondRock Hospitality Company, FelCor Lodging Trust Inc., Host Hotels & Resorts, Inc., Sunstone Hotel Investors Inc., Wyeth Common
Stock; Leisure: Carnival Corp., Intrawest Resorts Holdings, Inc., Norwegian Cruise Line Holdings Ltd., Royal Caribbean Cruises Ltd., Vail Resorts, Inc.; Global Hotel:
Belmond Ltd., Hilton Hotels Corp., Hyatt Hotels Corp., InterContinental Hotels Group, Marriott International Inc., Meliã Hotels International, Starwood Hotels & Resorts;
Emerging Market: Brazil Hospitality Group
40You can also read