Polar Portal Season Report 2021
←
→
Page content transcription
If your browser does not render page correctly, please read the page content below
Polar Portal Season Report 2021
2021 is the 25th year in a row in which Greenland’s Ice Sheet lost more mass dur-
ing the course of the melting season than it gained during the winter. The early
part of the summer was cold and wet with unusually heavy and late snowfall in
June, which delayed the onset of the melting season, whilst a heatwave at the
end of July led to a considerable loss of ice.

The Greenlandic Ice Sheet ended the 2020-2021         Greenland’s Ice Sheet lost around 166 billion
season with a net surface mass balance of ap-         tonnes of ice during the 12-month period end-
proximately 396 billion tonnes (Gt). According        ing in August 2021. This means that 2021 is the
to calculations performed by the Danish Mete-         25th year in succession in which Greenland’s Ice
orological Institute (DMI), this makes the cur-       Sheet has shrunk. Winter snowfall in 2020-2021
rent season the 28th lowest in the 41-year time       was close to average for the period 1981-2010,
series. Seen from a current perspective, this can     which was good news for the Ice Sheet. A com-
be regarded as a somewhat average year. How-          bination of low winter snowfall and a warm
ever, it is thought-provoking to realise how our      summer can result in very large losses of ice, as
perspective changes in line with climate              was the case in 2019.
change: at the end of the 1990s, for example,
the same figure would have been regarded as a         Incidentally, the cause of the cold and wet early
year with a very low surface mass balance in          part of the summer across the Ice Sheet is
the climate picture at that time.                     found a long way away – over southwest Cana-
                                                      da and northwest USA. Over the western part
2021 was notable for several reasons. It was the      of Canada and the USA an enormous “blocking"
year in which precipitation at Summit Station,        high pressure system was formed. Shaped like
which is located at the “top” of the Ice Sheet at     the Greek capital letter Omega (Ω), this flow
an altitude of 3,200 metres above sea level, was      pattern actually occurs regularly in the tropo-
registered in the form of rain. Furthermore,          sphere, and not just over North America, but
2021 saw an acceleration of the loss of ice at        this blocking anticyclone has never been ob-
the Sermeq Kujalleq glacier – or Ilulissat glacier    served with such strength before. An analysis
– where the rate of loss had otherwise been           by World Weather Attribution demonstrates
stagnant for several years. Turning to the total      that such a circulation pattern can only be ex-
mass balance, which is the sum of surface melt-       plained as a result of atmospheric warming
ing and calving of icebergs, in addition to melt-     caused by human activity.
ing of glacier tongues in contact with seawater,

In the following, we will look at the most important results observed in the Arctic in 2021:
    • Unusual weather during the Arctic summer 2021
    • Close to average melting of the surface of the Ice Sheet in 2021
    • Extreme melting periods despite average temperatures
    • The overall loss – the total mass balance
    • Smaller growth in the period 2018-2021
    • The extent of the sea ice fell to its second-lowest level in July 2021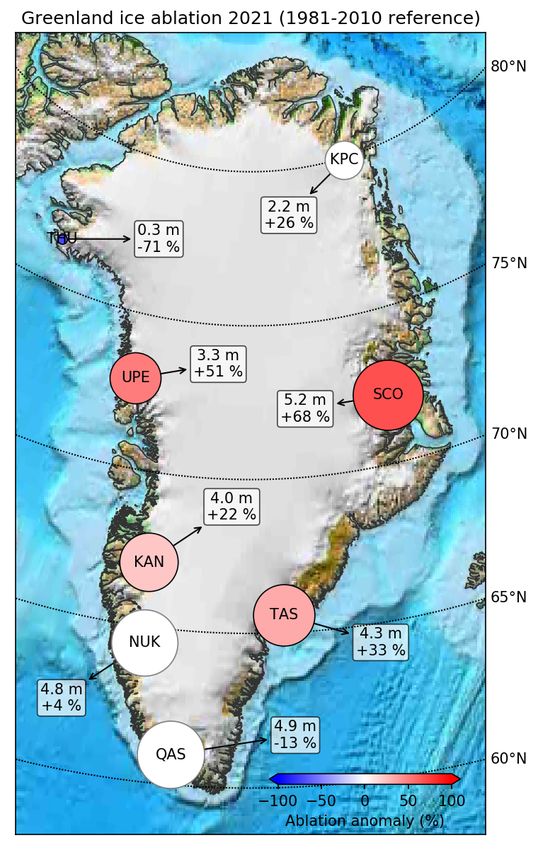
Unusual weather in the Arctic summer 2021

The Arctic weather in the summer of 2021 was              of 145 mm was set on the summer solstice,
out of the ordinary. In spite of the cool early           while there were reports of flooding in the
part of the summer, the end of July saw a peri-           town of Qaanaaq in northwest Greenland.
od with very high temperatures at the onset of
the melting season. This resulted in a consider-
able degree of melting around the Ice Sheet –
and a very high loss of ice within just a couple
of days.

Fig. 1: The map shows cool, moist summer weather
over Greenland (in the middle of the map) and the
extreme heat over North America. Colours indicate
temperatures warmer (red) or colder (blue) than the
average temperature. The arrows show the atmos-
pheric circulation patterns (credit: Polar Portal).

                                                          Fig. 2: Top: Map of Greenland showing regions with
The map in Figure 2 shows the area of melting
                                                          surface melting over Greenland on 28 July 2021
ice on 28th July (red area), whilst the table be-
                                                          (red). Bottom: Percentage of the area of the inland
low confirms that melting took place on more              ice with melting conditions in 2021 (blue line ending
than 60 % of the surface of the Ice Sheet on this         on 28 July). The grey line shows the 1981-2010 aver-
particular day.                                           age (credit: Polar Portal).

The East Greenlandic airport community,
Nerlerit, close to Ittoqqortoormiit, registered a         The second unusual event occurred on 14th
new record-high temperature of 23.4°C at the              August 2021, when it rained at Greenland’s
time.                                                     highest-lying weather station, literally at the
                                                          top of Greenland. The weather station has a
Rain was also a constant theme in the early part          very remote location some 3,216 metres above
of the summer in 2020-2021. In Qaqortoq in                sea level and has an average annual tempera-
southern Greenland a new precipitation record             ture of -30°C.
                                                      2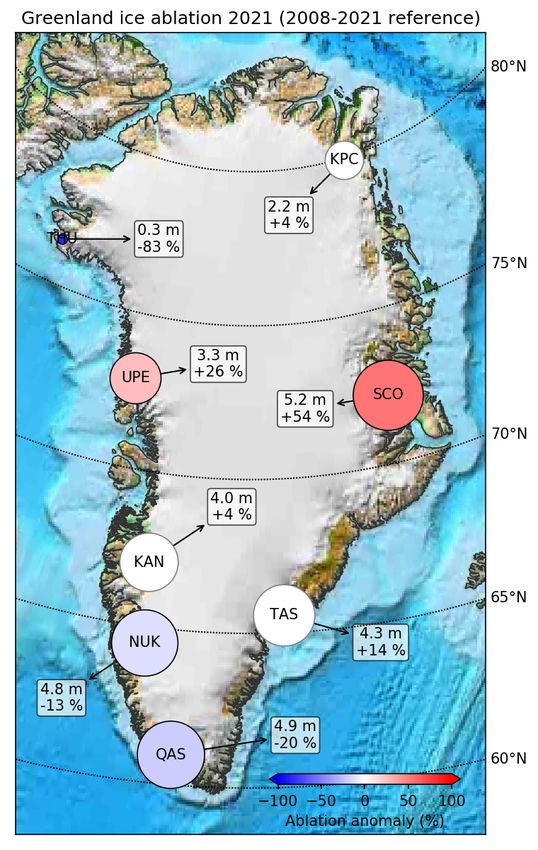
Rain occurs at temperatures close to or above             During the course of the last 2000 years a melt
freezing point, with melting at this altitude be-         layer has only been observed nine times (Alley
ing extremely rare. It is thus the first time since       et al. 1995); in 2021, 2019 and 2012, a melt
observations began in 2008 that employees at              layer was also observed directly by the person-
the station had observed rain.                            nel at the station. If we go further back in time,
                                                          we find further layers of ice during the course
Records from Summit Station only go back to               of the last 2000 years – in 1889, 1094, 992, 758,
the 1990s, so we cannot say much about rain-              753 and 244. Unfortunately, we cannot go any
fall at Summit Station. However, if we look at            further back in time because the ice and snow
data from the GISP2 ice core which has been               becomes more compacted the deeper we go. At
drilled out here, thin layers of ice can be identi-       a depth of between 400 and 500 m you can no
fied that reveal that there must have been                longer see individual layers of ice. Melting
thawing and that rain possibly fell, as meltwater         and/or rain is thus an extremely rare occur-
and/or rain could refreeze in the snow. As                rence at Summit. Incidentally, the highest tem-
summer and winter snow look different in such             perature ever observed at the top of Greenland
a core, the years can be counted back and a               was 2.2°C on 13th July 2012.
year in which melting took place can be identi-
fied.

Close to average melting of the surface of the Ice Sheet in 2021

In 2021, the onset of the melting season was              accumulates (through snowfall) or loses
delayed by record-high snowfall at the begin-             (through run-off). Based on these simulations,
ning of June. As new snow is brighter in terms            an overall measurement of how the surface
of whiteness and reflects sunlight better than            mass balance develops across the entire Ice
the old dark glacier ice below, melting was low           Sheet is obtained (Fig. 2).
at the beginning of the melting season. The
weather was also rather cold and wet in June              According to DMI’s calculations, the net result
and at the beginning of July.                             of the surface mass balance for Greenland’s Ice
                                                          Sheet in 2021 was 396 billion tonnes (Gt). This
Changes to the mass of Greenland’s Ice Sheet              is not far off the average for 1981-2020 of 341
reflect the combined effects of the surface               Gt. The period from September 2020 until Au-
mass balance (SMB), which is defined as the               gust 2021 ranks as the 28th lowest out of the
difference between snowfall and run-off from              41-year time series. In the current climate, this
the Ice Sheet – which is always positive at the           would be regarded as a rather average year. At
end of a year – and the loss of mass at the coast         the end of the 1990s, the same result would
as a result of calving of icebergs and melting of         have been seen as a very low year. As a com-
glacier tongues that meet the sea.                        parison, the lowest calculated SMB was just 38
                                                          Gt in 2012.
The surface mass balance, which is an expres-
sion of the isolated growth and melting of the            The map in Figure 3 shows how the geographic
surface of the Ice Sheet, is monitored via actual         distribution of SMB gain (blue) and SMB loss
measurements (PROMICE stations from GEUS)                 (red) for 2020-2021 can be compared to the
and computer simulations. The Danish Meteor-              long-term average (grey).
ological Institute (DMI) performs daily simula-
tions of how much ice or water the Ice Sheet
                                                      3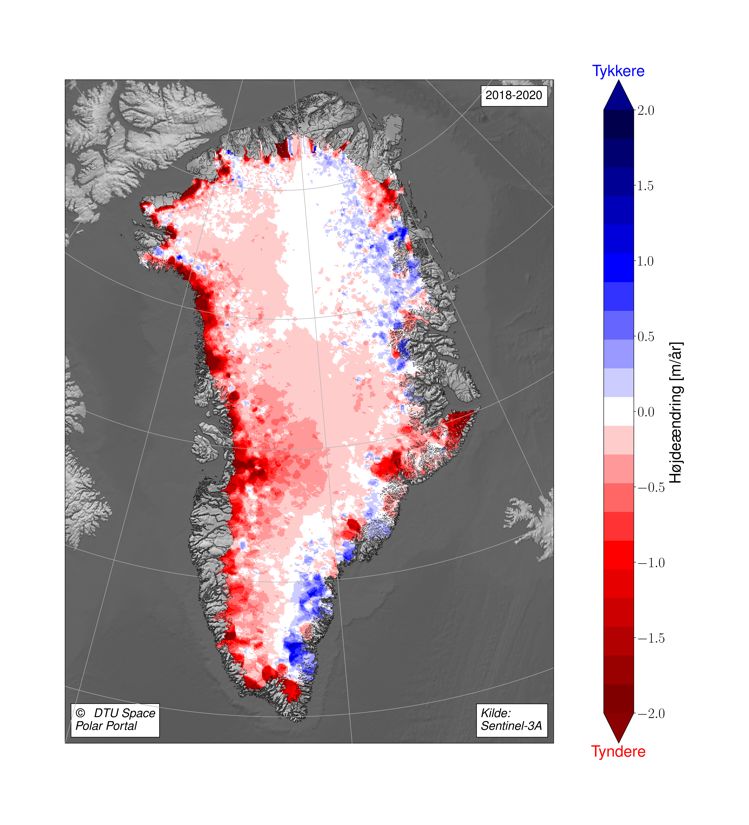
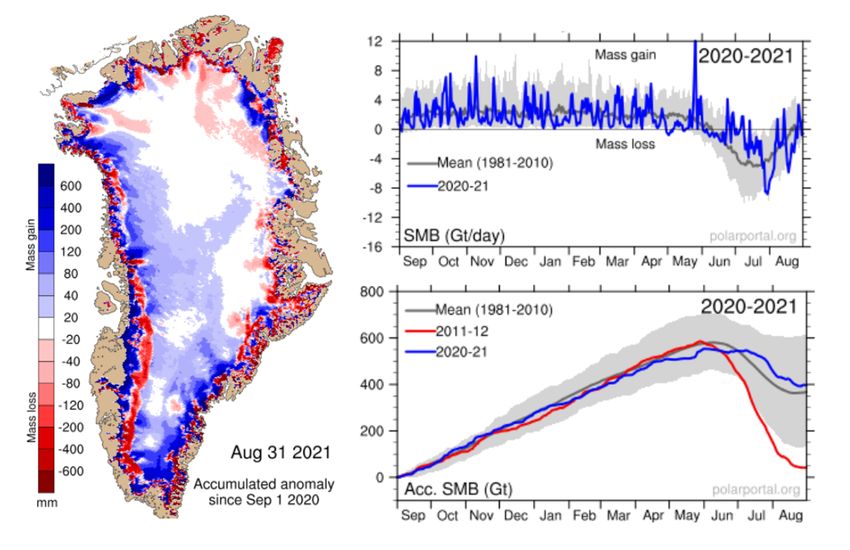
Fig. 3: Left: Difference between the annual SMB for the periods 2010-2021 and 1981-2010 (expressed as mm ice
melt). Blue indicates a larger accumulation than average, and red shows a larger ice melt than average. Right:
Daily (top) and accumulated (bottom) SMB over the Greenland Ice Sheet, expressed in Gt (billion tonnes) per day,
and Gt (billion tonnes) respectively. Blue lines show the SMB in 2020-2021. The grey lines show the average for
the period 1981-2010. The red line in the lower diagram shows the record low SMB in 2011-2012.

 Surface mass balance

 Surface mass balance is an expression of the isolated growth and melting of the surface of the
 Ice Sheet. Precipitation contributes to an increase of the mass of the Ice Sheet, whilst melting
 causes the Ice Sheet to lose mass. In relation to the total mass balance, the surface mass bal-
 ance says something about the contribution on the surface of the Ice Sheet – i.e. excluding that
 which is lost when glaciers calve icebergs and melt as they meet the warm seawater. Since the
 1990s, the surface mass balance has generally been declining.

Extreme melting periods despite average temperatures

The automated weather stations that are part               Sheet. The third such event took place on 14th
of the PROMICE project measured tempera-                   August, with a melting area of 53 % of the Ice
tures in June and July 2021 that were within +/-           Sheet. This final melting period was also the
1 standard deviation. At the end of July and               event in which melting was registered highest
August, however, there were three occurrences              up on the Ice Sheet, i.e. at National Science
of extreme melting. The first of these took place          Foundation’s (NSF) Summit Station at an alti-
on 19th July. Melting was observed over an area            tude of 3,216 metres.
of 702,000 km2 of the surface of the Ice Sheet.
This corresponds to 43 % of the total surface              At all the weather stations along the edge of
area of the Ice Sheet. The second extreme                  the Ice Sheet, temperatures were measured
event occurred on 28th July, when melting was              that were above average during all three of the
observed on 54 % of the surface of the Ice                 extreme melting events mentioned above.
                                                       4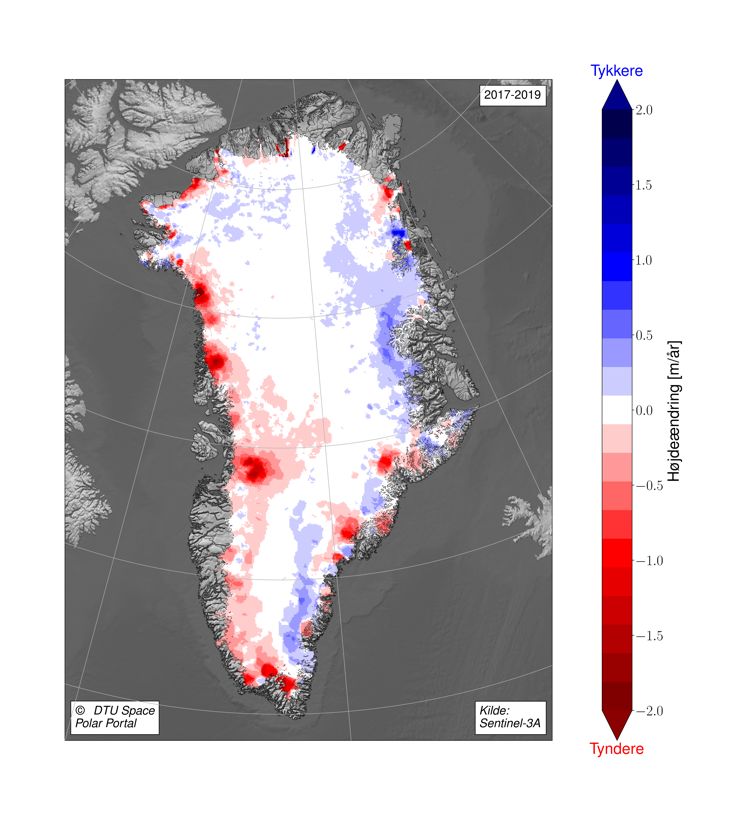
At Polar Portal we work with two different defi-
nitions of the onset of the melting season:

Onset of the melting season: The first day of at
least three days in a row in which more than 5
% of the surface of the ice undergoes melting of
more than 1 mm/day.

Onset of the ablation season: The first of day of
at least three days in a row in which the Ice
Sheet loses more than one gigatonne per day
from the surface.

Throughout the entire ablation season the
PROMICE weather monitoring stations located
along the edge of the Ice Sheet have registered
melting that was significantly higher than aver-
age along central western and eastern coasts.

The melting season on the Ice Sheet in 2020-
2021 began on 27th May. The ablation season
began on 17th June, which is 4 days later than
the average for 1981-2020.

                                                        Fig. 4: The maps show the net melt anomalies for the
                                                        lower elevation PROMICE stations compared to
                                                        2008-2021 (left) and 1981-2010 (right) (credit: van
                                                        As (2016), updated).

The total loss – total mass balance

Greenland’s Ice Sheet can only gain more ice by         where they meet the sea. The combination of
having a so-called "positive" surface mass bal-         these losses and the SMB results in a "total
ance (SMB). This occurs when more snow falls            mass balance" for the year. Over the long term
than melts. However, the Ice Sheet also loses           this should average out at zero – i.e. there is no
ice via other processes, primarily "calving" of         net gain or loss of ice, but this is not the case.
glaciers and melting of the glaciers’ tongues

                                                    5
Satellites can be used to measure the rate at              1986, when satellite registrations began. Fur-
which the ice flows through checkpoints along              thermore, the fastest-moving glacier in the
the edges of the Ice Sheet where we know the               world, Sermeq Kujalleq (also known as the
thickness and shape of the ice. By combining               Ilulissat glacier) began accelerating again in
this data concerning the thickness of the ice, we          2020-2021 after a couple of relatively “quiet”
can estimate the amount of ice that is lost                years. At the same time, the glacier produced a
through the process of calving and underwater              huge quantity of icebergs, and calculations re-
melting.                                                   veal that it lost around 45 Gt of ice in 2021.
                                                           Indeed, this is more than 10 % of the total fig-
This data makes it possible to monitor the over-           ure for the annual surface mass, which thus has
all “account” of the Ice Sheet. The figures reveal         a considerable impact on the year’s overall ice
that 2020-2021 had the highest loss of ice in the          account.
form of calving and underwater melting since

Fig. 5: The satellite images show the Sermeq Kujalleq glacier on 22 August 2021, as seen from the ERA Sentinel-2
satellite. The glacier accelerated considerably in 2020-2021 compared to previous years and lost approximately
45 Gt of ice (credit: ESA/Sentinel-2).

Although Greenland did not experience a rec-               tember 1986 until 31st August 2021 Greenland’s
ord high loss of ice – including calving – during          Ice Sheet has lost approximately 5,500 Gt of ice.
the 2020-2021 season, it was still the 25th year           This corresponds to a contribution of 1.5 cm to
in succession that the Ice Sheet lost more ice             the average global rise in sea levels of approxi-
than it gained.                                            mately 12 cm – note that is only due to loss of
                                                           mass from Greenland’s Ice Sheet. For the peri-
The total mass balance for 2020-2021 shows a               od 1st September 2002 until 31st August 2021,
loss of around 166 Gt of ice from Greenland.               which is covered by GRACE data (see below),
This figure is close to the average annual loss of         the loss is 4,352 Gt, corresponding to a 1.2 cm
ice for the period 1987-2021. Based on these               rise in sea level.
figures, it can be calculated that from 1st Sep-

                                                       6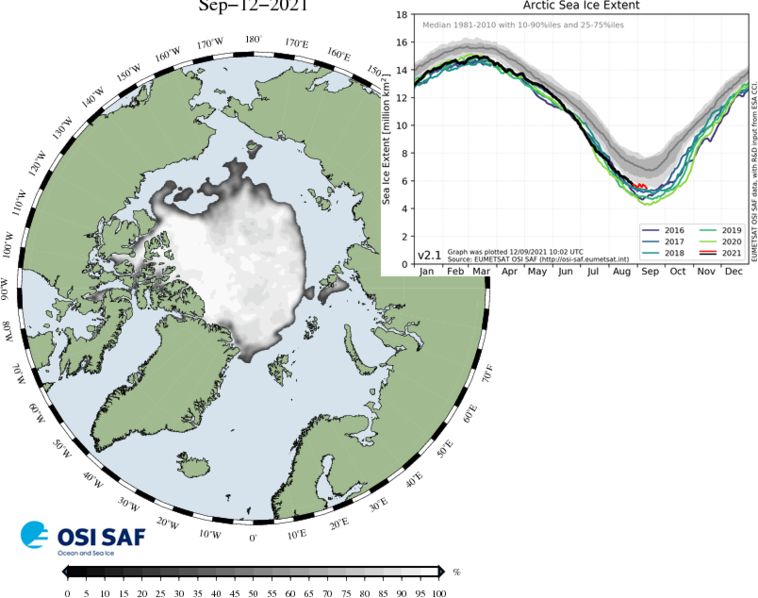
Lower growth during the period 2018-2021

The GRACE satellites and their successors,
GRACE-FO, measure small changes in the
Earth’s gravitational field, such that changes in
the mass of the Ice Sheet can be determined.

According to measurements from GRACE and
GRACE-FO, the Ice Sheet has suffered a total
loss of ice of around 4,470 Gt during the period
from April 2002 until June 2021, corresponding
to a rise in sea level of 1.2 cm. This provides
good agreement with the mass balance data
described above. Note that these methods are
independent of each other.

The maps in Figure 6 illustrate how the Ice
Sheet has become thinner or thicker respective-
ly during the period from January 2017 until
December 2020. The map on the left shows the
three-year period from January 2017 until De-
cember 2019, whilst the map on the right
shows how it has changed during the period
from January 2018 until December 2020. The
data originates from the Sentinel-3A satellite,
which is a so-called radar altimeter mission. The
satellite emits a radar signal which is reflected
from the surface of the Earth back up to the
satellite.

The ice has become thinner even at the centre
of the Ice Sheet. This has never been the case
before, where the major reduction in thickness
was associated with the large marine terminat-
ing glaciers. The image confirms a relatively
small loss of ice from the Ice Sheet from 2017-
18, followed by a high degree of melting in
2019 and 2020. It can also be seen how the              Fig. 6: The map shows data from the satellite Senti-
                                                        nel-3A. Red tones show areas where the ice has
heavy snowfall in southeast Greenland has
                                                        become thinner, whilst blue indicates regions with
helped put a brake on the rate of melting. This
                                                        an increase in ice thickness. The figure confirms a
area is one of the only areas on the map from
                                                        relatively small mass loss in 2017-2018 followed by a
2018-2020 where we can see that the ice has             large mass loss in 2020. It can also be seen how
become thicker.                                         heavy snowfall events decelerate melting. This is the
                                                        only region with an increase of ice mass (credit: DTU
                                                        Space. Data source: ESA/Sentinel-3A).

                                                    7
The sea ice fell to its second-lowest level in July 2021

July 2021 saw the second-lowest extent of sea           the average for 1981-2010 (10th September).
ice being measured since 1979. In August and            Refreezing of the sea ice thus also commenced
September, however, melting was not as high,            a little later than normal. Many of the lowest
and when the extent of sea ice reached its an-          extents of sea ice have been measured within
nual minimum on 12th September, its overall             the last 20 years, and the downward trend is
extent was just outside the top 10 of years with        bad news for the climate in the Arctic, as sea ice
the lowest extent of sea ice since 1979.                plays a major role in the global climate system.
                                                        This is due, among other things, to the fact that
In 2021, the date of the annual minimum of              the reduction of sea ice drives a vicious circle in
extent of the sea ice was two days later than           which warming in the Arctic accelerates.

Fig. 7: DMI graph of extent of the sea ice on 12 September 2020, the day of the annual sea ice minimum. The
map and graphics are based on EUMETSAT's OSISAF ice concentration calculations. They show where the sea ice
concentration exceeds 15% (credit: Polar Portal).

                                                    8
Fig. 8: The figure shows the ranking of sea ice extents over the years, from low to high. The extent is calculated
based on OSISAF data (OSI 450), the temporary climate dataset ICDR, OSI-430-b and a Near Real Time (NRT)
product. The monthly record low ice extents are marked in red.
(credit: http://ocean.dmi.dk/arctic/sie_monthmean.php).
Extent of the Arctic sea ice
The extent of the Arctic sea ice is analysed by both the American NSIDC and the European EU-
METSAT – and thus in turn by DMI. Both centres use the same satellite data, but they treat
noise over open water and along the edges of the ice slightly differently. This means that the
graphs for the extent of the sea ice are not quite identical. The European figures are compiled
via data from DMI researchers and are published in The Cryosphere scientific journal.
Observations of the extent of the sea ice reveal that the area of the Arctic summer ice has fall-
en annually by an average of approx. 94,000 km2 since the end of the 1970s. This corresponds
to more than twice Denmark’s total land area.
9You can also read