Pollen transport networks reveal highly diverse and temporally stable plant-pollinator interactions in an Appalachian floral community
←
→
Page content transcription
If your browser does not render page correctly, please read the page content below
AoB PLANTS 2021, Vol. 13, No. 5

                                                                                  https://doi.org/10.1093/aobpla/plab062
                                                                                  Advance Access Publication September 19, 2021
                                                                                  Studies

Studies
Pollen transport networks reveal highly diverse and

                                                                                                                                                 Downloaded from https://academic.oup.com/aobpla/article/13/5/plab062/6372435 by guest on 07 December 2021
temporally stable plant–pollinator interactions in an
Appalachian floral community
Daniel A. Barker and Gerardo Arceo-Gomez*
Department of Biological Sciences, East Tennessee State University, Johnson City, TN 37614, USA
*Corresponding author’s e-mail address: gomezg@etsu.edu

Populations & Communities. Chief Editor: Jean Burns

Associate Editor: James Cahill

Abstract
Floral visitation alone has been typically used to characterize plant–pollinator interaction networks even though it ignores
differences in the quality of floral visits (e.g. transport of pollen) and thus may overestimate the number and functional
importance of pollinating interactions. However, how network structural properties differ between floral visitation and
pollen transport networks is not well understood. Furthermore, the strength and frequency of plant–pollinator interactions
may vary across fine temporal scales (within a single season) further limiting our predictive understanding of the drivers
and consequences of plant–pollinator network structure. Thus, evaluating the structure of pollen transport networks and
how they change within a flowering season may help increase our predictive understanding of the ecological consequences
of plant–pollinator network structure. Here we compare plant–pollinator network structure using floral visitation and pollen
transport data and evaluate within-season variation in pollen transport network structure in a diverse plant–pollinator
community. Our results show that pollen transport networks provide a more accurate representation of the diversity
of plant–pollinator interactions in a community but that floral visitation and pollen transport networks do not differ in
overall network structure. Pollen transport network structure was relatively stable throughout the flowering season despite
changes in plant and pollinator species composition. Overall, our study highlights the need to improve our understanding
of the drivers of plant–pollinator network structure in order to more fully understand the process that govern the assembly
of these interactions in nature.

Keywords: Community structure; interaction diversity; plant–pollinator networks; pollen; pollination success.


Introduction
Plant–pollinator interactions typically take place within large                interactions is thus essential for gaining a complete
and diverse communities where plant and pollinator species can                 understanding of the processes that shape natural communities
interact directly and/or indirectly (Roughgarden 1979; Thompson                and how these will respond in the face of increasing human
1999; Jordán et al. 2008; Burkle and Alarcón 2011; Carstensen                  disturbances (Memmott et al. 2004; Katariya et al. 2017; Pérez-
et al. 2014). The complex make-up of these interactions can in                 Méndez et al. 2018).
turn affect the stability of natural communities (Bascompte et al.                 Network theory has been successfully used to describe
2003; Olesen et al. 2007; Stouffer and Bascompte 2011; Valido                  complex      community-level    plant–pollinator   interactions
et al. 2019). Knowledge of the overall structure, as well as the               (Memmott 1999; Bascompte et al. 2003; Memmott et al. 2004;
drivers and consequences of community-wide plant–pollinator                    Palla et al. 2005; Mason and Verwoerd 2006; Popic et al. 2013;

Received: 14 May 2021; Editorial decision: 17 August 2021; Accepted: 15 September 2021
© The Author(s) 2021. Published by Oxford University Press on behalf of the Annals of Botany Company.
This is an Open Access article distributed under the terms of the Creative Commons Attribution License (https://creativecommons.
org/licenses/by/4.0/), which permits unrestricted reuse, distribution, and reproduction in any medium, provided the original work is
                                                                                                                                         1
properly cited.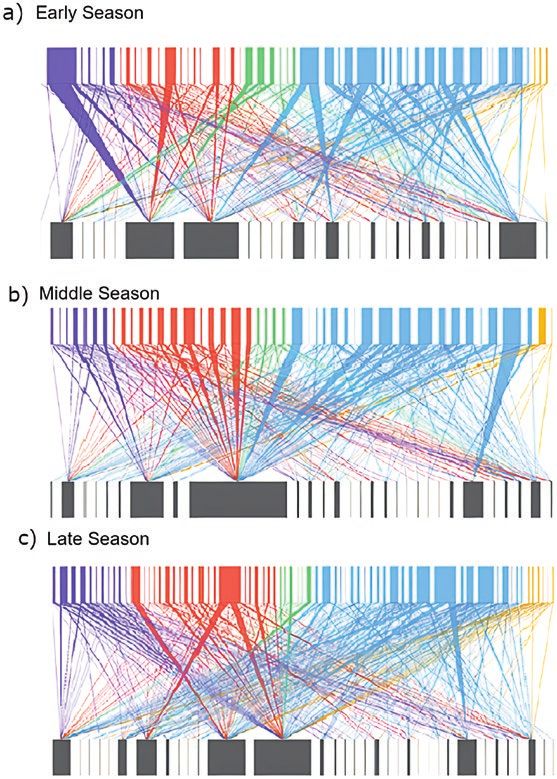
2   |   AoB PLANTS, 2021, Vol. 13, No. 5

Pocock et al. 2016) and has revealed key generalities in the                the field (Jędrzejewska-Szmek and Zych 2013). In the few studies
assembly of plant–pollinator communities (Ollerton et al. 2006;             conducted to date (e.g. Alarcón 2010; Jędrzejewska-Szmek and
Jędrzejewska-Szmek and Zych 2013; Pocock et al. 2016). These                Zych 2013) PT networks have been shown to capture a larger
studies have uncovered plant–pollinator communities that are                diversity and number of interactions compared to FV networks
highly connected, generalized, nested and robust to human                   and thus may have the potential to provide a more accurate
disturbances (e.g. Dupont et al. 2003; Fortuna and Bascompte                depiction of the functional relevance of plant–pollinator
2006; Burgos et al. 2007; Piazzon et al. 2011; Nielsen and Totland          interactions in a community (Bosch et al. 2009; Alarcón 2010;
2014). However, recent studies have suggested that plant–                   Jacobs et al. 2010; Olesen et al. 2011a). Thereby revealing patterns
pollinator networks, and our interpretation of their structural             of network structure that may be more informative for assessing
patterns, are limited in that they typically overlook the temporal          overall community robustness and stability. However, how
dynamics of these interactions (CaraDonna and Waser 2020;                   plant–pollinator network structural properties based on FV
Thomson 2021). It is also not well known how patterns of                    differ from those constructed from PT remains little studied (but
pollinator visitation reflect other key aspects of the pollination          see Alarcón 2010; Jędrzejewska-Szmek and Zych 2013).

                                                                                                                                                   Downloaded from https://academic.oup.com/aobpla/article/13/5/plab062/6372435 by guest on 07 December 2021
process such as pollen transport and deposition on stigmas                      A second key limitation in most plant–pollinator network
(Parra-Tabla and Arceo-Gómez 2021; Thomson 2021). These                     studies has been the pooling of interactions across one or
two shortcomings thus hamper our ability to fully evaluate                  multiple flowering seasons (e.g. Basilio et al. 2006; Olesen et al.
the role of plant–pollinator interactions in the ‘stability’ of             2008, 2011b), thus assuming these interactions are static over
natural communities, hence preventing advancing towards a                   time (Thomson 2021). A few studies however have shown that
more predictive understanding of the causes and functional                  plant–pollinator networks can vary substantially between years
consequences of plant–pollinator network structure in nature.               with as much as 25 % species turnover in plant and pollinator
    Specifically, plant–pollinator interactions have been typically         species composition (e.g. Petanidou et al. 2008). Furthermore,
characterized based on the observation of floral visitation                 temporal turnover in species interactions may not only occur
(hereafter FV) to help establish links between plants and                   between different years but may also occur within the same
pollinators in a network context (e.g. Alarcón et al. 2008; Baldock         flowering season (e.g. CaraDonna et al. 2017; Thomson 2021),
et al. 2011; Vazquez et al. 2012; Lázaro et al. 2008). However, utilizing   although this has been far less explored. Within-season
FV alone likely ignores differences in the quality of floral visits (i.e.   variability in network structure could occur due to variation
transport and deposition of pollen), and may overestimate the               in species flowering phenology (flowering time) as well as due
number and functional importance of ‘pollination interactions’              to variation in the timing of activity of pollinators during the
(from a plant fitness perspective; e.g. King et al. 2013; Parra-Tabla       flowering season (Olesen et al. 2008; CaraDonna et al. 2017).
and Arceo-Gómez 2021; Thomson 2021). For instance, a recent                 In this case, plant–pollinator interactions can be expected to
study showed that when pollinator efficiency (contribution to               change as pollinator preferences change with changes in the
pollen transport) is considered, only half of pollinators and 27 %          availability of floral resources and/or as new pollinator species
of all interactions in a network contribute to plant fitness (de            emerge (Fowler et al. 2016; CaraDonna et al. 2017; Thomson 2021).
Santiago-Hernández et al. 2019). It is also possible that rare (i.e.        Understanding how plant–pollinator network structure changes
infrequent and difficult to observe), but functionally important            at finer temporal scales such as within a single season and how
(e.g. high pollen transport) interactions are overlooked when               patterns of FV reflect those of PT will greatly help advance our
relying on FV alone (Jędrzejewska-Szmek and Zych 2013). These               understanding of the drivers and functional consequences of
limitations of using FV may in turn obscure our understanding               changes in plant–floral visitor network structure.
of the overall structure and functional consequences of plant–                  In this study we evaluate differences in plant–floral visitor
pollinator networks. For instance, it was recently suggested                network structure (e.g. nestedness, modularity, connectance)
that an increase in plant–pollinator specialization (based on               based on FV and PT data and evaluate how the structure of PT
FV) within nested communities could lead to higher levels of                networks changes a different time points within a single season
heterospecific pollen transfer (Arceo-Gomez et al. 2020), hence             in a plant–pollinator community in southern Appalachia. We ask
decreasing pollination quality (Morales and Traveset 2008).                 the following specific questions: (i) do network structure derived
This because in nested plant–pollinator networks specialized                from PT data differs significantly from FV networks? and (ii)
plant species tend to interact more frequently with generalist              does PT network structure differ between the early, middle and
pollinators that in turn visit many other plant species (Arceo-             late portions of the flowering season?
Gomez et al. 2020). Thus, networks derived from the use of
FV alone may lead to an incomplete characterization of the
fitness consequences of plant–pollinator network structure and              Materials and Methods
consequently of its implications for community robustness and
resilience (Alarcón 2010; Jędrzejewska-Szmek and Zych 2013;                 Study site
Popic et al. 2013).                                                         The study was conducted in Hampton Creek Cove State Natural
    Using information on the size and identity of pollen loads              Area in Tennessee, USA (36°08.843′N, 82°02.794′W, elevation: 971
carried by floral visitors (i.e. pollen transport) to infer plant–          m). The site is a 1.87-ha field undergoing secondary succession
pollinator network structure may help overcome the limitations              with a mix of animal-pollinated annual and perennial, as well as
of the use of FV (Alarcón 2010; Tur et al. 2014). For instance,             native and non-native plants inhabiting the site [see Supporting
pollen transport (hereafter PT) data may allow the identification           Information—Fig. S1]. The study site is bordered by a mixed
of floral visitors that contribute very little to the pollination           deciduous forest. Flowering starts in late April and continues
process (i.e. do not carry pollen) and thus may be functionally             into early September (Daniels and Arceo-Gómez 2020).
irrelevant from a plant fitness perspective (de Santiago-                   Temperature at the study site ranges from 22 to 34 °C during
Hernández et al. 2019). Furthermore, PT data may increase the               the day. There are several federally recognized endangered and
likelihood of detecting rare plant–pollinator interactions that             threatened plant species located at the study site including:
are critical for plant fitness, but that are difficult to observe in        Blue Ridge Goldenrod (Soldiago spithamaea), Roan Mountain
Barker and Arceo-Gomez | 3
Bluet (Houstonia montana) and Spreading Avens (Geum radiatum) If identification of pollen could not be confirmed to match any
and thus this plant–pollinator community is also of potential of the species present at the studied community, they were
conservation concern. recorded as unknown and were not included in the network
(only 4 % of total pollen counted). In the few instances where
Pollinator collection two plant species had similar pollen morphology as determined
To sample the pollinator community four 1 × 40 m transects by the pollen reference library, these were combined into one
were set up at the study site. Pollinators were sampled by group (four species were dived into two pollen groups). In total,
walking each transect at a constant pace collecting all insects 214 346 pollen grains were counted and identified to 48 species
observed visiting flowers until a maximum of 60 (range 45–60) of plants [see Supporting Information—Fig. S1].
floral visitors were sampled each day. Since in plant–pollinator
networks the unit of ‘sampling’ are the individual interactions FV and PT networks
we established a maximum number of floral visitors (i.e. Plant–floral visitor interactions were characterized using PT and
60) collected each day in order to standardize for sampling FV data collected across the entire flowering season (13 weeks).
Downloaded from https://academic.oup.com/aobpla/article/13/5/plab062/6372435 by guest on 07 December 2021
effort (i.e. number of interactions observed) and thus be able Within each interaction matrix (PT and FV), the frequency
to evaluate differences in network structure among different of plant–floral visitor interactions was determined by the
time periods (early, middle, late flowering season). This number of observed flower visits (FV) and the average pollen
standardization further avoids large differences in network size load (PT) found on the body of each floral visitor species. The
which have been shown to greatly influence network structure number of flower visits was determined from the number of
and thus allowed us to safely compare between distinct time insect collections on flowers of a given plant species. For the
periods without biasing our results. Sampling took place PT network, the average number of pollen grains of each plant
between May and August 2019 during peak pollinator activity species found on each insect morphogroup was used in place of
between 8:00 AM and 3:00 PM (Daniels and Arceo-Gómez 2020) the number of floral visits. However, it has been suggested that
for 21 days across 13 weeks. We sampled 7 days per time period, pollinators can pick up pollen grains during ‘accidental’ visits
i.e. early season (ES), middle of the season (MS) and late in the to flowers (e.g. flowers that pollinators do not typically visit), or
season (LS). All insects were collected with butterfly nets when pick up pollen grains from more than one species on a single
they were observed making contact with the floral reproductive flower, thus overestimating the ‘functionally relevant’ number of
structures (anthers and stigma). Upon collection, insects were interactions (Ne’Eman et al. 2010). To account for ‘incidental’ PT,
stored in individual containers and placed in a cooler until we are considering interactions with an average of five or more
processing in the laboratory. The identity of the plant species pollen grains of a specific plant species as actual pollination
where each pollinator was captured was recorded. events (less than five grains has been considered incidental
A total of 917 insects were collected and identified to pollination; e.g. Johnson and Ashman 2019). We further improved
the lowest taxonomic group possible using several insect the reliability of our estimate by only removing interactions
identification guides (Field Guide to Insects of North America, of ≤5 pollen grains that also constituted less than 5 % of the
Peterson Field Guides Insects, Field Guide to Insects and total pollen load carried by each insect species. By doing this
Spiders of North America). Where species identity could not we avoided removing interactions that may be ‘functionally
be confirmed, individuals were assigned to morphogroups or relevant’ but where pollen grains are naturally transported in
recognizable taxonomic units (Vanbergen et al. 2014; Oliver and small amounts (e.g. pollinator size constraints). For instance,
Beattie 2016). In total 103 insect morphogroups were found at five pollen grains could be 50 % of total pollen load if pollinators
the study site [see Supporting Information—Fig. S2]. only carry 10 total pollen grains and thus this interaction would
not be considered ‘incidental’. In total, 336 ‘incidental’ plant
Pollen load sampling and pollinator species interactions were removed from the PT
Insect pollen loads were sampled by swabbing the body of each network. If no interaction (visit/pollen) was observed between a
floral visitor collected with fuchsin jelly cubes (Beattie 1971; plant and insect species a zero was recorded.
Kearns and Inouye 1993). The fuchsin jelly was made by mixing
175 mL of distilled water to 150 mL of glycerol and 50 g of gelatin Temporal variation in PT networks
which was then mixed with basic fuchsin crystals (Beattie 1971). Within-season variability was only assessed using PT data
The jelly was cut into approximately 3 × 3 × 1 mm cubes and because these have been shown here (see Results) and in
then applied to the top and bottom of the thorax and abdomen, other studies (e.g. Alarcón 2010; King et al. 2013; de Manincor
the head and mouth parts, antennae if present, and to the legs et al. 2020) to provide the most complete, diverse and reliable
of each insect. The corbiculae of bee species was avoided as the characterization of functionally relevant plant–pollinator
pollen located within it is not typically available for pollination interactions in a community. Thus, from a plant fitness
(i.e. deposition on the stigma; Horskins and Turner 1999; Popic perspective, changes in PT network structure across time
et al. 2013; Johnson and Ashman 2019). Each appendage was may be more ecologically relevant than changes in flower
swabbed three times to standardize sampling. Fuchsin jelly visitation networks. We evaluated PT network structure
swabs with pollen samples were then placed on microscope across early (ES), middle (MS) and late flowering season (LS) by
slides and melted over a hot plate before being sealed under a constructing plant–floral visitor networks for each individual
glass coverslip. The pollen loads of all 917 insects were sampled. week (13 total weeks) and then categorizing each week as
After pollen samples had been mounted, each sample was early, middle or late flowering. Each time period was then
observed under a microscope and all pollen in the sample was composed of 4–5 replicates per week (i.e. ES weeks 1–4, MS
identified and counted. Identification of pollen grains was done weeks 5–8 and LS weeks 9–13). We divided the growing season
with the aid of a pollen reference library constructed for all plant into 4- to 5-week time periods (ES, MS, LS) as they coincide
species at the study site (also see Daniels and Arceo-Gómez with ample plant species turnover in the studied community
2020). Quantification and identification of pollen grains was (D. A. Barker, pers. obs.; see Supporting Information—Fig. S3).
done with a compound light microscope at 400× magnification. Previous studies have shown that differences in plant–floral4 | AoB PLANTS, 2021, Vol. 13, No. 5
visitor network structure can be expected as a result of high two networks is then reduced by rotating, inverting, enlarging
plant and pollinator species turnover (CaraDonna et al. 2017; or reducing the networks (Alarcón et al. 2008). As such,
CaraDonna and Waser 2020). For instance, at our study site, Procrustes analysis evaluates differences in network structure
Jacobaea vulgaris (ES), Glechoma hederacea (MS) and Achillea taking into account the identity and position of each species
millefolium (LS) were observed flowering in only one of the (landmarks) within the networks (Alarcon et al. 2008; Wang
three time periods studied (Daniels and Arceo-Gomez 2020; et al. 2010; Demayo et al. 2011; Piazzon et al. 2011; Dehling et al.
see Supporting Information—Fig. S3). 2016). This approach differs from our previous analyses in
that mixed models only evaluate changes in overall network
Statistical analysis structure irrespective of species identities/roles within the
We evaluated overall differences between FV and PT network network. On the other hand, significant differences using
structure in two ways. First, we performed mixed models using Procrustes analyses reflect network structural differences that
the 13 weekly networks (see above) as replicates of FV and PT result from changes in individual species position (role) within
networks (26 total networks). Although networks are built from a network.
Downloaded from https://academic.oup.com/aobpla/article/13/5/plab062/6372435 by guest on 07 December 2021
samples collected at the same study site, weekly networks We also evaluated if observed network metrics in PT and FV
represent a distinct plant and pollinator community as the networks, constructed from data across all 13 weeks (i.e. one PT
abundance and diversity of plant and pollinator species changes and one FV network), are the result of a random assembly using
week to week (see Supporting Information—Fig. S3; also see null model analysis. For this, we used the ‘vaznul’ algorithm in
CaraDonna and Waser 2020). This not only results in weekly the bipartite package, as it is least sensitive to the abundances
changes in plant and pollinator species composition but can of interactions (Vázquez et al. 2007; Dormann et al. 2009; Souza
also lead to a significant turnover of interactions (Carstensen et al. 2018). We generated 9999 random networks maintaining
et al. 2016; CaraDonna et al. 2017). Weekly networks thus capture the number of interactions constant and compared the observed
distinct plant–pollinator communities and the interactions network metrics with those of the randomly generated networks
among a specific subset of plant and pollinator species. Since using Spearman’s correlation coefficient to generate z-scores for
we are interested in sampling biological communities and not each metric (Vázquez et al. 2007).
physical locations weekly plant and pollinator communities To evaluate within-season variation in PT network structure
may be considered distinct replicates of FV and PT networks. (using the same network metrics described above) we performed
We evaluated differences in overall network metrics using a mixed model using the 13 weekly networks (see above) as
network type (FV or PT) as a fixed effect and sampling week as replicates of early (4 weeks), middle (4 weeks), late (5 weeks)
a random effect. We evaluated differences in network structure flowering season. Flowering period (ES, MS, LS) was considered
by estimating weighted network connectance, average links as a fixed effect and individual week as random effect. As above,
per species, weighted nestedness, specialization (H2) and we further conducted Procustes analyses to evaluate within-
modularity. Specifically, connectance represents the proportion season (ES, MS, LS; one network per time period) differences in PT
of realized interactions out of the total number of possible network structure considering changes in species position within
interactions, while the number of links per species represents the network. Interaction sampling completeness (including all
the average number of interactions for each species in the interactions observed) was evaluated via rarefaction analyses
network, both reflect differences in the size and complexity of for overall FV and PT networks and for each sampling period
the network (Bascompte et al. 2003; Blüthgen et al. 2006; Olesen (ES, MS, LS) using EstimateS (ver. 9.1.0). For this, we used the
et al. 2007). Nestedness reflects the degree to which specialist Jackknife and bootstrap richness estimation methods as these
species interact with subsets of the species interacting with have been shown to perform best at small (21 days) but intense
generalists, while modularity reflects the existence of highly sampling efforts (Poulin 1998; Walther and Morand 1998), thus
connected, non-overlapping groups of species (i.e. plant– avoiding underestimating sampling completeness compared
pollinator interactions that occur within certain groups/modules to other estimators (Macgregor et al. 2017). We compared both
and no others; Bascompte et al. 2003). Network specialization richness estimators (Jackknife and bootstrap) with the observed
(H2) on the other hand reflects differences in the degree of niche number of unique plant–pollinator species interactions
partitioning across species (i.e. specialization) between networks observed. All bipartite networks and network metrics were
(Dunne et al. 2002; Blüthgen et al. 2006; Olesen et al. 2007). All generated using the bipartite package in R (Dormann et al. 2008;
these metrics were generated using the bipartite package in R Core Team 2017). Residuals were normally distributed in all
R and have been commonly used to describe plant–pollinator models (Shapiro–Wilkes, P > 0.05).
network structure (e.g. Dunne et al. 2002; Basilio et al. 2006;
Petanidou et al. 2008; Bosch et al. 2009; Alarcón 2010; Olesen et al.
2011b). Furthermore, these network properties are dependent
on the number, identity and frequency of the interactions
Results
among network participants, which have been shown to vary Rarefaction analysis showed that our sampling captured
temporally (Ponisio et al. 2017; Valido et al. 2019; CaraDonna and between 62 and 79 % (Jackknife and bootstrap, respectively)
Waser 2020). of all FV and between 64 and 81 % of all PT interactions in the
Second, we evaluated differences between FV and PT community [see Supporting Information—Fig. S4]. Of the 917
networks using Procrustes analysis (Alarcón 2010; Johnson insects collected and identified, Hymenoptera and Diptera
and Ashman 2019). For this, we used two networks constructed accounted for 44 and 26 %, respectively. Hemiptera, Coleoptera,
from pooled data collected across all 13 weeks (i.e. one PT and Lepidoptera and Orthoptera represented 8.5, 14.7, 6 and 0.2 %,
one FV network). Procrustes analysis evaluates differences in respectively. Although Hemipterans are not typically considered
network shape using corresponding landmarks (i.e. network pollinators, our data showed that these may transport pollen
nodes/species) within the networks. (Wang et al. 2010; between flowers as their pollen loads exceeded 100 grains
Demayo et al. 2011; Piazzon et al. 2011; Dehling et al. 2016). The per individual on average. Hence, these were included in the
congruence in the position of the nodes (i.e. species) between networks.Barker and Arceo-Gomez | 5
Congruence between FV and PT networks LS networks were all significantly different from each other
(PSS > 0.91, P < 0.05 for all).
Pollen transport and FV networks contained 554 and 357 unique
interactions, respectively (Fig. 1). There were 95 (PT) and 103 (FV)
floral visitors interacting with 43 (PT) and 39 (FV) plant species
(Fig. 1). Pollen transport and FV network structure differed
Discussion
significantly in weighted connectance (F24, 1 = 5.73, P = 0.02), Our results show that PT networks may provide a more
average links per species (F24,1=65.84, P< 0.01), and weighted complete depiction of the diversity and complexity of plant–
nestedness (F24, 1 = 9.16, P = 0.006) (Table 1). There was also a floral visitor interactions in a community. Specifically, PT
marginal difference in specialization (H2) (F24, 1 = 3.76, P = 0.06) networks captured 38 % more unique interactions and twice
but no differences in network modularity (F24, 1 = 0.04, P = 0.9; as many links per species compared to the FV network (4.6 vs.
Table 1). Null model analyses showed that all network properties 2.7; Table 1). Moreover, six insect species ‘dropped out’ of the
were significantly different than what would be expected by plant–floral visitor network when pollen loads were considered,
random (P < 0.05). Procrustes analysis showed no significant likely because these species do not contribute to PT and
Downloaded from https://academic.oup.com/aobpla/article/13/5/plab062/6372435 by guest on 07 December 2021
differences between PT and FV networks (PSS = 0.96, P = 0.2). therefore may be functionally irrelevant in a pollination context.
Surprisingly, this was the case for the fiery skipper Hylephila
Within-season variation phyleus (Lepidoptera) who was never found carrying pollen
Rarefaction analysis showed that our sampling captured even though it was somewhat abundant at the site (i.e. multiple
between 63 and 80 % (Jackknife and bootstrap respectively) of individuals were collected and swabbed). It is important to
all expected plant–pollinator interactions across in each of the point out, however, that interactions that we considered here
three time periods, i.e. early, middle and late in the flowering as ‘functionally irrelevant’ from a pollination perspective can
season [see Supporting Information—Fig. S4]. Early (ES), middle be biologically relevant in other contexts. For instance, some
(MS) and late season (LS) networks contained 260, 229 and 333 of these can be antagonistic interactions (e.g. nectar robbers;
unique interactions, 51, 45 and 68 floral visitors and 29, 29 and Thomson 2021), may contribute to viral/microbial transport
34 plant species, respectively (Fig. 2). There was no within- or may contribute to pollinator food provisioning, all of which
season differences in the average number of links per species can directly or indirectly impact plant or pollinator fitness
(F10, 2 = 0.02, P = 0.98), weighted nestedness (F10, 2 = 0.65, P = 0.5), (Bronstein 2001; Morris et al. 2019). In our study, for example, we
weighted connectance (F10, 2 = 1.39, P = 0.29), specialization (H2; observe six insects that do not seem to contribute to pollination
F10, 2 = 0.61, P = 0.56) and modularity (F10, 2 = 0.21, P = 0.816; Table 1). (i.e. insects observed visiting flowers but not carrying pollen)
Procrustes analysis, however, indicated that the ES, MS and but may be serving other important ecological functions in the
Figure 1. Plant–pollinator interaction networks constructed based on (A) PT and (B) FV data. Networks were constructed from pooled data across all 13 weeks. Insect
morphogroups are represented by nodes on the top (purple = Coleoptera, red = Diptera, green = Hemiptera, blue = Hymenoptera, orange = Lepidoptera) and plants at
the bottom. Interactions are represented by the lines between nodes. The thickness of the lines reflects the frequency of those interactions.6 | AoB PLANTS, 2021, Vol. 13, No. 5
Table 1. Average (± SD) and range (min–max) for each network structural metric (links per species, weighted nestedness, weighted connectance,
modularity and specialization [H2]) generated for FV and PT networks and for early (ES), middle (MS) and late (LS) flowering periods within
a single season. The number of replicates (weekly networks) for each network type is provided in parentheses. Significantly different values
(P < 0.05) are shown in bold, *P = 0.06.
FV (13) PT (13) ES (4) MS (4) LS (5)
Links per species Mean 1.11 2.01 2.02 2.03 1.98
SD 0.14 0.37 0.29 0.32 0.53
Min/max 0.89/1.31 1.2/2.5 1.71/2.31 1.82/2.5 1.2/2.5
Weighted nestedness Mean 0.3 0.45 0.46 0.4 0.5
SD 0.13 0.12 0.06 0.19 0.1
Downloaded from https://academic.oup.com/aobpla/article/13/5/plab062/6372435 by guest on 07 December 2021
Min/max 0.08/0.50 0.23/0.58 0.40/0.52 0.23/0.57 0.34/0.58
Weighted connectance Mean 0.07 0.84 0.08 0.09 0.08
SD 0.03 0.01 0.01 0.01 0.02
Min/max 0.02/0.10 0.06/0.10 0.06/0.09 0.08/0.1 0.06/0.1
Modularity Mean 0.52 0.52 0.5 0.54 0.53
SD 0.12 0.09 0.13 0.05 0.09
Min/max 0.34/0.70 0.35/0.69 0.35/0.62 0.47/0.60 0.46/0.69
Specialization (H2) Mean 0.77* 0.63* 0.65 0.67 0.59
SD 0.23 0.1 0.05 0.08 0.14
Min/max 0.37/0.99 0.35/0.69 0.59/0.72 0.54/0.71 0.48/0.82
community [see Supporting Information—Fig. S5]. In a similar Nielsen and Totland 2014) and tolerance to human-mediated
manner, four plant species were included in the PT network but disturbances (Dunne et al. 2002). Higher levels of nestedness have
were not present in the FV network. This likely occurred because also been associated with increased resistance to species loss
visits to these plant species are infrequent and therefore hard (Bascompte et al. 2003; Burgos et al. 2007). Thus, a strong reliance
to observe. For example, Prunella vulgaris and Solanum carolinense on FV networks may still limit our predictive understanding
were not observed receiving any insect visits, although pollen of the effect of human disturbances on plant and pollinator
from both plants was found on the bodies of 20 and 2 pollinator communities.
morphogroups, respectively. Overall, our results suggest that Our results also show that plant–pollinator networks
PT networks are more accurate descriptors of the diversity and based on PT although much more diverse, their structure is
frequency of community-level plant–pollinator interactions. relatively stable throughout the flowering season. None of the
Our results further show that FV and PT networks differ in network metrics we evaluated differed significantly between
their overall structure, although these differences seem to be early, middle and late flowering season. This stability in overall
only related to the strength of network structural properties. For network structure is intriguing given that the diversity and
instance, while both network types were significantly nested identity of the interacting plant and pollinator species (and
(compared to random assembly), the PT networks had significantly their interactions) changed considerably along the season at
higher nestedness values compared to the FV networks (Table 1). the study site. For example, J. vulgaris was the dominant plant
This difference may be due to an increase in number of interactions species early in the season (mid-May) but it is completely
in PT networks compared to the FV network (Dupont et al. 2003). replaced in early June by Crepis capillarus, and this species is
Interestingly, FV networks were not significantly different from in turn replaced by A. millefolium, at the end of the season [see
PT networks when evaluated via Procrustes analysis, suggesting Supporting Information—Fig. S3]. In fact, Procustes analysis
that species’ position/roles within the networks do not change revealed changes in individual species roles within the network
between the two network types. These results combined suggest throughout the flowering season likely reflecting the high plant
that event though PT networks capture a much larger number species turnover observed over time. However, despite this high
and diversity of interactions, FV networks may still be reliably plant species turnover, overall PT network structure remained
describing the overall assembly of plant–pollinator interactions in constant. For instance, average number of links per plant
terms of their overall structure. In a recent study, de Manincor et al. species (1.98–2.03), nestedness (0.4–0.5) and modularity (0.5–
(2020) showed similar results and concluded that FV networks 0.53) remained relatively stable throughout the season (Table 1).
provide a suitable representation of plant–pollinator interactions These results may hence suggest the existence of an overarching
despite the fact that they capture significantly less interactions ‘blueprint’ in the structure of plant–pollinator interactions
compared to PT networks. In our study, however, we did observed regardless of community species composition (also see Alarcón
differences in the overall strength of structural network properties et al. 2008). A similar trend has also been observed at larger time
with potential implications for network structure and stability. For scales, where network structure remains constant across years
instance, increasing network nestedness and connectance have despite a vast turnover in the identity of the interacting species
been associated with increasing community stability (Memmott (Alarcón et al. 2008). These results, however, differ from recent
and Waser 2002; Bastolla et al. 2009; Thébault and Fontaine 2010; work by CaraDonna and Waser (2020) which showed changes inBarker and Arceo-Gomez | 7
Supporting Information
The following additional information is available in the online
version of this article—
Figure S1. Plant species documented at the study site.
Figure S2. Insect species documented visiting flowers at the
study site.
Figure S3. Phenologies of plant species at the study site
throughout the sampling period (13 weeks).
Figure S4. Rarefaction curves representing sampling
completeness for each network type a) floral visitation-whole,
b) pollen transport-whole and for each time period within a
season, c) early season (ES), d) middle season (MS) and e) late
Downloaded from https://academic.oup.com/aobpla/article/13/5/plab062/6372435 by guest on 07 December 2021
season (LS).
Figure S5. Bipartite network of ‘non-pollinating’ interactions
between plants and insects. The network was generated by
subtracting ‘pollen-transport’ interactions from the ‘floral
visitation’ network.
Sources of Funding
D.A.B. funded by East Tennessee State University Denise
Pav Scholarship and G.A.-G. funded by East Tennessee State
University RDC Grant.
Conflict of Interest
None declared.
Acknowledgements
The authors thank the Editor J. Cahill and an anonymous
Figure 2. Plant–pollinator interaction networks constructed from PT data reviewer for their valuable comments on this manuscript.
collected (A) early in the season (ES): mid-May to early June, (B) middle of the
Thanks to J. Daniels, E. Hendrix, S. Duncan and A. Stanley for
season (MS): June to early July and (C) late season (LS): July to mid-August.
their assistance during sample collection and processing. We
Each time period (network) consists of pooled data across 4-/5-week intervals.
Insect morphogroups are represented by nodes on the top (purple = Coleoptera, also thank G. Estrada for help with floral visitor identification
red = Diptera, green = Hemiptera, blue = Hymenoptera, orange = Lepidoptera) and M. Crocket for permitting work at the study site.
and plants on the bottom. Interactions are represented by the lines between
nodes. The thickness of the lines reflects the frequency of those interactions.
Contributions by the Authors
network structure with plant and pollinator species turnover. Both authors contributed to data collection, manuscript writing
The apparent constancy in plant–pollinator network structure, and editing, and conceptualization of the ideas.
like the one observed here, however, has been attributed to the
dominance of generalist species that serve as ‘anchor’ or ‘bridge’
species that help maintain network structure (Olesen et al. 2011b; Data Availability
Koski et al. 2015). In our study, Trifolium pratense and Trifolium All data used for analysis in this publication can be found in the
repens were both abundantly available throughout the flowering following Dryad repository (doi:10.5061/dryad.f1vhhmgxk).
season and could help serve as ‘bridge’ maintaining network
structure despite further changes in plant species composition
(e.g. Koski et al. 2015). However, to our knowledge, few studies Literature Cited
have evaluated structural changes in plant–pollinator network Alarcón R. 2010. Congruence between visitation and pollen-transport
structure at short temporal scales (within a single season; e.g. networks in a California plant–pollinator community. Oikos
Saavedra et al. 2016; CaraDonna and Waser 2020). Thus, we 119:35–44.
highlight the need for more studies that evaluate the causes Alarcón R, Waser NM, Ollerton J. 2008. Year-to-year variation in the
and consequences of fine-scale temporal changes (e.g. within a topology of a plant–pollinator interaction network. Nordic Society Oikos
season and within a day) in plant–pollinator network structure 117:1796–1807.
in order to more fully understand the process that governs the Arceo-Gómez G, Barker D, Stanley A, Watson T, Daniels J. 2020. Plant–
pollinator network structural properties differentially affect pollen
assembly of these interactions in nature. Overall, our results
transfer dynamics and pollination success. Oecologia 192:1037–1045.
emphasize the need for studies that evaluate the drivers
Baldock KCR, Memmott J, Ruiz-Guajardo JC, Roze D, Stone GN. 2011. Daily
of plant–pollinator network stability beyond FV and across temporal structure in African savanna flower visitation networks and
changing plant and pollinator communities in space and time. consequences for network sampling. Ecology 92:687–698.
Such studies would help improve our predicative understanding Bascompte J, Jordano P, Melián CJ, Olesen JM. 2003. The nested assembly of
of the consequences of human-mediated disturbances on plant–animal mutualistic networks. Proceedings of the National Academy
natural plant and pollinator communities. of Sciences of the United States of America 100:9383–9387.8 | AoB PLANTS, 2021, Vol. 13, No. 5
Basilio AM, Medan D, Torretta JP, Bartoloni NJ. 2006. A year-long plant– Jędrzejewska-Szmek K, Zych M. 2013. Flower-visitor and pollen transport
pollinator network. Austral Ecology 31:975–983. networks in a large city: structure and properties. Arthropod-Plant
Bastolla U, Fortuna MA, Pascual-García A, Ferrera A, Luque B, Bascompte J. Interaction 7:503–516.
2009. The architecture of mutualistic networks minimizes competition Johnson AL, Ashman TL. 2019. Consequences of invasion for pollen
and increases biodiversity. Nature 458:1018–1020. transfer and pollination revealed in a tropical island ecosystem. The
Beattie AJ. 1971. A technique for the study of insect-borne pollen. Pan- New Phytologist 221:142–154.
Pacific Entomologist 47:82. Jordán F, Okey TA, Bauer B, Libralato S. 2008. Identifying important species:
Blüthgen N, Menzel F, Blüthgen N. 2006. Measuring specialization in linking structure and function in ecological networks. Ecological
species interaction networks. BMC Ecology 6:9. Modelling 216:75–80.
Bosch J, González AM, Rodrigo A, Navarro D. 2009. Plant–pollinator Katariya L, Ramesh PB, Gopalappa T, Borges RM. 2017. Sex and diversity:
networks: adding the pollinator’s perspective. Ecology Letters 12:409–419. the mutualistic and parasitic fungi of a fungus-growing termite
Bronstein JL. 2001. The exploitation of mutualisms. Ecology Letters 4:277–287. differ in genetic diversity and reproductive strategy. Fungal Ecology
Burgos E, Ceva H, Perazzo RP, Devoto M, Medan D, Zimmermann M, 26:20–27.
María Delbue A. 2007. Why nestedness in mutualistic networks? Kearns CA, Inouye DW. 1993. Techniques for pollination biologists. Boulder,
Downloaded from https://academic.oup.com/aobpla/article/13/5/plab062/6372435 by guest on 07 December 2021
Journal of Theoretical Biology 249:307–313. CO: University Press of Colorado.
Burkle LA, Alarcón R. 2011. The future of plant–pollinator diversity: King C, Ballantyne G, Willmer PG. 2013. Why flower visitation is a poor
understanding interaction networks across time, space, and global proxy for pollination: measuring single-visit pollen deposition, with
change. American Journal of Botany 98:528–538. implications for pollination networks and conservation. Methods in
CaraDonna PJ, Petry WK, Brennan RM, Cunningham JL, Bronstein JL, Ecology and Evolution 4:811–818.
Waser NM, Sanders NJ. 2017. Interaction rewiring and the rapid Koski MH, Meindl GA, Arceo-Gómez G, Wolowski M, LeCroy K, Ashman TL.
turnover of plant–pollinator networks. Ecology Letters 20:385–394. 2015. Plant–flower visitor networks in a serpentine metacommunity:
CaraDonna PJ, Waser NM. 2020. Temporal flexibility in the structure of assessing traits associated with keystone plant species. Arthropod-Plant
plant–pollinator interaction networks. Oikos 129:1369–1380. Interaction 9:9–21.
Carstensen DW, Sabatino M, Morellato LP. 2016. Modularity, pollination Lázaro A, Hegland SJ, Totland O. 2008. The relationships between floral
systems, and interaction turnover in plant–pollinator networks across traits and specificity of pollination systems in three Scandinavian
space. Ecology 97:1298–1306. plant communities. Oecologia 157:249–257.
Carstensen DW, Sabatino M, Trøjelsgaard K, Morellato LP. 2014. Beta Macgregor CJ, Evans DM, Pocock MJO. 2017. Estimating sampling
diversity of plant–pollinator networks and the spatial turnover of completeness of interactions in quantitative bipartite ecological
pairwise interactions. PLoS One 9:e112903. networks: incorporating variation in species’ specialization. bioRxiv,
Daniels JD, Arceo-Gómez G. 2020. Effects of invasive Cirsium arvense on doi:10.1101/195917.
pollination in a southern Appalachian floral community vary with Mason O, Verwoerd M. 2006. Graph theory and networks in biology. IET
spatial scale and floral symmetry. Biological Invasions 22:783–797. Systems Biology. doi:10.1049/iet-syb:20060038.
de Manincor N, Hautekèete N, Mazoyer C, Moreau P, Pisquot Y, Schatz B, Memmott J. 1999. The structure of a plant–pollinator food web. Ecology
Schmitt E, Zélazny M, Massol F. 2020. How biased is our perception of Letters 2:276–280.
plant–pollinator networks? A comparison of visit- and pollen-based Memmott J, Waser NM. 2002. Integration of alien plants into a native
representations of the same networks. Acta Oecologica 105:103–551. flower–pollinator visitation web. Proceedings of the Royal Society of
de Santiago-Hernández MH, Martén‐Rodríguez S, Lopezaraiza‐Mikel M, London. Series B, Biological Sciences 269:2395–2399.
Oyama K, González‐Rodríguez A. 2019. The role of pollination Memmott J, Waser NM, Price MV. 2004. Tolerance of pollination networks
effectiveness on the attributes of interaction networks: from floral to species extinctions. Proceedings of the Royal Society of London. Series B,
visitation to plant fitness. Ecology 100:1–15. doi:10.1002/ecy.2803. Biological Sciences 271:2605–2611.
Dehling DM, Jordano P, Schaefer HM, Böhning-Gaese K, Schleuning M. Morris MM, Frixione NJ, Burkert AC, Dinsdale EA, Vanette RL. 2019.
2016. Morphology predicts species’ functional roles and their degree Microbial abundance, composition, and function in nectar are shaped
of specialization in plant–frugivore interactions. Proceedings of the Royal by flower visitor identity. FEMS Microbiology Ecology 96:1–14.
Society of London. Series B, Biological Sciences 283:20152444. doi:10.1098/ Morales CL, Traveset A. 2008. Interspecific pollen transfer: magnitude,
rspb.2015.2444. prevalence and consequences for plant fitness. Critical Reviews in Plant
Demayo CG, Harun SA, Torres MAJ. 2011. Procrustes analysis of wing shape Sciences 27:221–238.
divergence among sibling species of Neurothemis dragonflies. Australian Ne’eman G, Jürgens A, Newstrom-Lloyd L, Potts SG, Dafni A. 2010. A
Journal of Basic and Applied Sciences 5:748–759. framework for comparing pollinator performance: effectiveness
Dormann CF, Fruend J, Bluethgen N, Gruber B. 2009. Indices, graphs and null and efficiency. Biological Reviews of the Cambridge Philosophical Society
models: analyzing bipartite ecological networks. Open Ecology Journal 85:435–451.
2:7–24. Nielsen A, Totland Ø. 2014. Structural properties of mutualistic networks
Dormann C, Gruber B, Fründ J. 2008. Introducing the bipartite package: withstand habitat degradation while species functional roles might
analysing ecological networks. Interaction 1:0.2413793. change. Oikos 123:323–333.
Dunne JA, Williams RJ, Martinez ND. 2002. Network structure and Olesen JM, Bascompte J, Dupont YL, Elberling H, Rasmussen C, Jordano P.
biodiversity loss in food webs: robustness increase with connectance. 2011a. Missing and forbidden links in mutualistic networks. Proceedings
Ecology Letters 5:558–567. of the Royal Society of London. Series B, Biological Sciences 278:725–732.
Dupont YL, Hansen DM, Olesen JM. 2003. Structure of a plant-flower- Olesen JM, Bascompte J, Dupont YL, Jordano P. 2007. The modularity of
visitor network in the high-altitude sub-alpine desert of Tenerife, pollination networks. Proceedings of the National Academy of Sciences of
Canary Islands. Ecography (Cop) 26:301–310. the United States of America 104:19891–19896.
Fortuna MA, Bascompte J. 2006. Habitat loss and the structure of plant– Olesen JM, Bascompte J, Elberling H, Jordano P. 2008. Temporal dynamics in
animal mutualistic networks. Ecology Letters 9:281–286. a pollination network. Ecology 89:1573–1582.
Fowler RE, Rotheray EL, Goulson D. 2016. Floral abundance and resource Olesen JM, Stefanescu C, Traveset A. 2011b. Strong, long-term temporal
quality influence pollinator choice. Insect Conservation and Diversity dynamics of an ecological network. PLoS One 6:e26455.
9:481–494. Oliver IAN, Beattie AJ. 2016. Designing a cost-effective invertebrate survey:
Horskins K, Turner VB. 1999. Resource use and foraging patterns of a test of methods for rapid assessment of biodiversity. Ecological
honeybees, Apis mellifera, and native insects on flowers of Eucalyptus Applications 6:594–607.
costata. Austral Ecology 24:221–227. Ollerton J, Johnson SD, Hingston AB. 2006. Geographical variation in
Jacobs JH, Clark SJ, Denholm I, Goulson D, Stoate C, Osborne JL. 2010. diversity and specificity of pollination. In: Waser NM, Ollerton J, eds.
Pollinator effectiveness and fruit set in common ivy, Hedera helix Plant–pollinator interaction: from specialization to generalization. Chicago:
(Araliaceae). Arthropod-Plant Interaction 4:19–28. The University of Chicago Press, 283–308.Barker and Arceo-Gomez | 9
Palla G, Derényi I, Farkas I, Vicsek T. 2005. Uncovering the overlapping tropical environments: higher specialization when resources are
community structure of complex networks in nature and society. scarce. Journal of Ecology 106:2409–2420. doi:10.1111/1365-2745.12978
Nature 435:814–818. Stouffer DB, Bascompte J. 2011. Compartmentalization increases food-web
Parra-Tabla V, Arceo-Gómez G. 2021. Impacts of plant invasions in native persistence. Proceedings of the National Academy of Sciences of the United
plant–pollinator networks. The New Phytologist 230:2117–2128. States of America 108:3648–3652.
Pérez-Méndez N, Jordano P, Valido A. 2018. Persisting in defaunated Thébault E, Fontaine C. 2010. Stability of ecological communities
landscapes: reduced plant population connectivity after seed dispersal and the architecture of mutualistic and trophic networks. Science
collapse. Journal of Ecology 106:936–947. 329:853–856.
Petanidou T, Kallimanis AS, Tzanopoulos J, Sgardelis SP, Pantis JD. 2008. Thompson JN. 1999. The evolution of species interactions. Science
Long-term observation of a pollination network: fluctuation in 284:2116–2118.
species and interactions, relative invariance of network structure and Thomson JD. 2021. How worthwhile are pollination networks? Journal
implications for estimates of specialization. Ecology Letters 11:564–575. of Pollination Ecology 28:i–vi.
Piazzon M, Larrinaga AR, Santamaría L. 2011. Are nested networks more Tur C, Vigalondo B, Trøjelsgaard K, Olesen JM, Traveset A. 2014. Downscaling
robust to disturbance? A test using epiphyte-tree, comensalistic pollen-transport networks to the level of individuals. The Journal of
Downloaded from https://academic.oup.com/aobpla/article/13/5/plab062/6372435 by guest on 07 December 2021
networks. PLoS One 6:e19637. Animal Ecology 83:306–317.
Pocock MJO, Evans DM, Fontaine C, Harvey M, Julliard R, McLaughlin Ó, Valido A, Rodríguez-Rodríguez MC, Jordano P. 2019. Honeybees disrupt
Silvertown J, Tamaddoni-Nezhad A, White PCL, Bohan DA. 2016. The the structure and functionality of plant–pollinator networks. Scientific
visualisation of ecological networks, and their use as a tool for engagement, Reports 9:4711.
advocacy and management. Advances in Ecological Research 54:41–85. Vanbergen AJ, Woodcock BA, Gray A, Grant F, Telford A, Lambdon P,
Ponisio LC, Gaiarsa MP, Kremen C. 2017. Opportunistic attachment Chapman DS, Pywell RF, Heard MS, Cavers S. 2014. Grazing alters
assembles plant–pollinator networks. Ecology Letters 20:1261–1272. insect visitation networks and plant mating systems. Functional Ecology
Popic TJ, Wardle GM, Davila YC. 2013. Flower-visitor networks only partially 28:178–189.
predict the function of pollen transport by bees. Austral Ecology 38:76–86. Vázquez DP, Lomáscolo SB, Maldonado MB, Chacoff NP, Dorado J, Steyani EL,
Poulin R. 1998. Comparison of three estimators of species richness in Vitale NL. 2012. The strength of plant–pollinator interactions. Ecology
parasite component communities. The Journal of Parasitology 84:485–490. 93:719–725.
R Core Team. 2017. R: a language and environment for statistical. Vienna, Vázquez DP, Melián CJ, Williams NM, Blüthgen N, Krasnov BR, Poulin R.
Austria: R Foundation for Statistical Computing. 2007. Species abundance and asymmetric interaction strength in
Roughgarden J. 1979. Theory of population genetics and evolutionary ecology: an ecological networks. Oikos 116:1120–1127.
introduction. Upper Saddle River, NJ: Prentice Hall. Walther BA, Morand S. 1998. Comparative performance of species richness
Saavedra S, Rohr RP, Olesen JM, Bascompte J. 2016. Nested species estimation methods. Parasitology 116:395–405.
interactions promote feasibility over stability during the assembly of a Wang C, Szpiech ZA, Degnan JH, Jakobsson M, Pemberton TJ, Hardy JA,
pollinator community. Ecology and Evolution 6:997–1007. Singleton AB, Rosenberg NA. 2010. Comparing spatial maps of human
Souza CS, Maruyama PK, Aoki C, Sigrist MR, Raizer J, Gross CL, de Araujo AC. population-genetic variation using Procrustes analysis. Statistical
2018. Temporal variation in plant–pollinator networks from seasonal Applications in Genetics and Molecular Biology 9:Article 13.You can also read