Pollination services support for agriculture productions values - IOPscience
←
→
Page content transcription
If your browser does not render page correctly, please read the page content below
IOP Conference Series: Earth and Environmental Science

PAPER • OPEN ACCESS

Pollination services support for agriculture productions values
To cite this article: N Adnan et al 2021 IOP Conf. Ser.: Earth Environ. Sci. 756 012089

View the article online for updates and enhancements.

                               This content was downloaded from IP address 46.4.80.155 on 18/07/2021 at 14:07
ARCoFS 2021 IOP Publishing
IOP Conf. Series: Earth and Environmental Science 756 (2021) 012089 doi:10.1088/1755-1315/756/1/012089
Pollination services support for agriculture productions values
N Adnan1,*, M P Mamat1 and T M Tuan Ibrahim2
1
Social Forestry Program, Forest Research Institute Malaysia, Kepong, Selangor,
Malaysia
2
Forest Economics Section, Forestry Department of Peninsular Malaysia, Kuala
Lumpur
*E-mail: norliyana@frim.gov.my
Abstract. Pollination is one of ecosystem services provided by tropical forest as addressed in
The Millennium Ecosystem Assessment. Roughly, two-third of the world’s agriculture species
cultivation required pollination. Studies shows that 70% of tropical crops seem to have at least
one variety for which production is improved by animal pollinators. Most common pollinators
live naturally in the ecosystem known as wild pollinators. The objective of this study was to
quantify the economic value of pollination services by wild pollinators of Gunung Tebu Forest
Reserves, Besut, Terengganu. Agricultural data was obtained from Department of Agriculture
Terengganu. Data incorporated the list of farmers/villages, types of crops planted, annual area
planted (ha), annual area harvested (ha) annual production (kg) and annual production value
(RM). The economic value of pollination services was estimated by multiplying production
value of each crops with its pollinator dependence ratio. This paper considered four types of
crops, namely durian, watermelon, melon and rambutan. Results of analysis on economic value
of natural pollinator services based on pollinator dependence ratio was RM 6,588,630.91.
These accounted for 56% of the total production values for the region. It demonstrated that the
natural pollinators have important impacts and benefits to agricultural sectors through
pollination services provided by the nearby forest. With improved pollination services, crop
production could be further increased, successful agricultural production, pollination would
contribute significantly to world food security.
1. Introduction
Millenium Ecosystem Assessment (2003) and The Economics of Ecosystem Services and Biodiversity
(TEEB) has outlined pollination services as one of the regulating service [1, 2]. Globally, one thirds of
the total human food supply depend on the pollination. The production of agriculture crops is
increasing by 50% through pollination [3]. With improved pollination, crop yields could be further
increased by about 25 percent. By ensuring higher yields and successful agricultural production,
pollination would contribute significantly to world food security [4].
Pollination services for tropical crops have been compiled by [5] with a list of potential breeding
systems and pollinating taxa. Throughout the list, about 70% of tropical crops seem to have at least
one variety for which production is improved by animal pollinators. Most common pollinators live
naturally in the ecosystem known as wild pollinators. It refers to a species of animals and insects
native to particular area, aiding in the pollination of both agricultural and wild plants. The distance
between nesting place and food is also important as flight involves a cost for insects. It is also thought
that the amount of nectar and pollen and the length of the period when food is available are important
in maintaining populations of wild pollinators.
Relationships between natural areas such as forest and pollination are closely linked. Rickett et al.
[6] illustrate this with the results of the synthesis of previous related studies that the number of crops
visited by wild pollinators is lower for crops areas farther from natural habitat. For tropical crops area
Content from this work may be used under the terms of the Creative Commons Attribution 3.0 licence. Any further distribution
of this work must maintain attribution to the author(s) and the title of the work, journal citation and DOI.
Published under licence by IOP Publishing Ltd 1ARCoFS 2021 IOP Publishing
IOP Conf. Series: Earth and Environmental Science 756 (2021) 012089 doi:10.1088/1755-1315/756/1/012089
within 5000 metres of their natural habitat receives about 0.5 percent of visits by wild pollinators. The
farther the crops from natural habitat, the less potential the pollinators visits.
Two main ways have been used to date to assess the monetary value of pollinators [7]. The first
consists in simply assessing the total value of insect-pollinated crops. This approach has been used at a
national scale in the USA and as well as in the world scale [8, 9, 10]. However, the production of the
most crops only partially reduces in the absence of the pollinators, more refined approach has been
developed based on the previous approach. It takes into account the real impact of pollinators on crop
production, called dependence ratio. Dependence ratio enables the calculation of the production loss in
case of complete disappearance of pollinators, and the economic value of pollination services would
assimilate with the loss of crop value.
The dependence of tropical crops on pollen animals has been extensively studied [3, 5, 11, 12].
Klien et al. [3] published the dependency ratio. The value of this ratio determine the average values of
the level of dependency of pollinators to the crops. There are several stages of dependency ratio;
i) 95% refers to the average value of reduction of pollen-driven yields is between 100% and
90% in experiments comparing commercial produce with and without animal pollinators.
Pollination is reported as “Essential”.
ii) 65% refers to reduction of pollen driven revenue is between 40% and less than 90%.
Pollination is reported as "Great".
iii) 25% refers to reduction of pollen driven revenue is between 10% and less than 40%.
Pollination is reported as "Modest".
iv) 5% refers to reduction of pollen driven revenue is between> 0% and less than 10%.
Pollination is reported as "Little".
v) There are also some plants that are not dependent on animal pollination and are also known
as ‘Parthenocarpic’. However, the list of crops does not cover many crops found in the
tropics.
Malaysia is rich with wild pollinator such as bee, stingless bees and bats. Several agricultural crops
such as starfruits, guava, citrus, mango, watermelon, durian and coconut among the crops used
pollination. Hence, the objective of this study was to quantify the economic value of pollination
services by wild pollinators of Gunung Tebu Forest Reserves (FR), Besut, Terengganu. The economic
value estimates addressed the contribution of pollination services on the production of crops, thus
securing some of the food supply in the region.
2. Materials and Methods
2.1. Study area
The selection of study area is a rich forest reserves of Gunung Tebu, Besut, Terengganu. The reverse is
located at the eastern of Malaysia covered with a total of 25,316 ha, about 24km from Jertih town or
118km from the capital city Kuala Terengganu. The reserves also have several recreational attractions
such as Lata Belantan Eco-Park and Gunung Tebu peak of 1,039 metres height. Gunung Tebu FR is
rich with flora and fauna.
2.2. Data
Data requirement in this study involved the agricultural monthly production reports garthered from the
Besut and Setiu District Agricultural Department. The agricultural information for the year of
November 2019 to October 2020 collected includes details of;
i) Crops area (ha)
ii) Types of crops planted
iii) Total monthy production (kg)
iv) Production value (RM)
2ARCoFS 2021 IOP Publishing
IOP Conf. Series: Earth and Environmental Science 756 (2021) 012089 doi:10.1088/1755-1315/756/1/012089
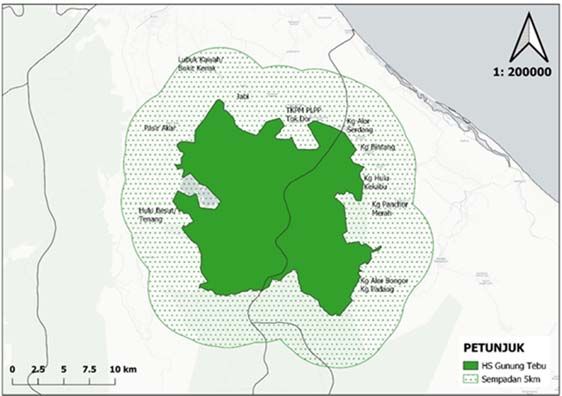
As reference of Rickett et al. (2007), the information collected were directly limited to 5km radius
of Gunung Tebu FR. The map shows the area that are within 5km radius from the boundary of Gunung
Tebu FR and was used to inform the Field Officer (Figure 1). Data gathered from Besut and Setiu
District Agricultural Department as in Table 1.
Figure 1. The map of 5km radius of Gunung Tebu FR.
Table 1. Fruits/crops production data of Besut and Setiu (Source: District Agricultural Department,
2020).
Crops Production (kg) Production value (RM)
Jackfruit 17,300.00 17,300.00
Dokong 42,577.00 43,848.40
Duku 90,080.00 120,864.00
Durian 1,947,873.00 9,492,017.90
Mangosteen 49,400.00 49,400.00
Banana 838,187.00 1,394,728.00
Rambutan 54,527.00 83,827.00
Snakefruit 22,320.00 49,104.00
Watermelon 398,590.00 360,610.45
Melon 72,700.00 75,840.00
Total 3,533,554.00 11,687,539.75
2.3. Methodology approach
The analysis of the study uses second approach to calculate the economic value of the pollination
services. The total economic value is calculated using Gallei et al. [7];
Where, Qix is the production quantity, (Di) is the ratio of crop i dependence to pollinator and (Pix)
is the crop price i per production unit in area x. The values of some tropical crops dependency ratio
listed by [3] and also shown by [13] as in Table 2. Table 3 show the calculation of economic value of
selected fruits with the dependency ratio.
3ARCoFS 2021 IOP Publishing
IOP Conf. Series: Earth and Environmental Science 756 (2021) 012089 doi:10.1088/1755-1315/756/1/012089
Table 2. Dependence ratio for local crops.
Crops Pollinator Dependence Ratio
Starfruits 0.65
Guava 0.65
Lime 0.05
Mango 0.65
Watermelon 0.95
Melon 0.95
Rambutan 0.05
Durian 0.65
Banana parthenocarpic
Mangosteen parthenocarpic
Duku Unknown
Table 3. The economic value of pollination services by selected crops (calculation using
Gallei et. al, 2009).
Crops Production Production Dependency Economic
(kg) value (RM) Ratio Value
Jackfruit 17,300.00 17,300.00 -
Dokong 42,577.00 43,848.40 -
Duku 90,080.00 120,864.00 -
Durian 1,947,873.00 9,492,017.90 0.65 6,169,811.64
Mangosteen 49,400.00 49,400.00 -
Banana 838,187.00 1,394,728.00 -
Rambutan 54,527.00 83,827.00 0.05 4,191.35
Snakefruit 22,320.00 49,104.00 -
Watermelon 398,590.00 360,610.45 0.95 342,579.93
Melon 72,700.00 75,840.00 0.95 72,048.00
Total 3,533,554.00 11,687,539.75 6,588,630.91
3. Results and Discussion
There were ten types of crops grown around the Gunung Tebu FR, namely durian, banana, rambutan,
watermelon, melon, duku, dokong, snakefruit, mangosteen and jackfruits. Durian is the largest
producer of crops, followed by bananas and watermelon. The total yield production of crops is
estimated to be 3,533,554 kg with production value of RM 11,687,539.80.
The estimation for economic value of pollination services take into account only durian,
watermelon, melon and rambutan, since their type of crops required pollination. Most of the
pollinators are from natural habitat or wild pollinator. Other crops such as bananas and mangosteen
have no dependency towards pollinators (parthenocarpic). Meanwhile duku, dokong, jackfruits and
snakfruit are said to have dependence on pollinators but the extent of the impacts is not known. Lack
of studies have been done for these type of crops towards pollination.
The analyses of four crops with their dependence ratios such as durian (0.65 dependence ratio),
watermelon (0.95 dependence ratio), melon (0.95 dependence ratio) and rambutan (0.05 dependence
ratio). Based on calculation using Gallei et al. (2009), the economic value of pollination for Gunung
Tebu FR and Besut is RM 6,588,630.91. The estimate is equal to 56% of total production value (RM
11,687,539.80) of the area. Hence, the support of pollination services towards the production crops are
significant and valuable. It is not only for food resources of the community in the region but also
contributed to other area since the production crops were exported.
4ARCoFS 2021 IOP Publishing
IOP Conf. Series: Earth and Environmental Science 756 (2021) 012089 doi:10.1088/1755-1315/756/1/012089
The actual value of this service will probably be higher than that obtained if taking into account
other types of crops. In addition, this value is only the result of HS Gunung Tebu only. Previously
published pollination economic pollination studies take into account landscapes compared to
individual / specific areas. With improved pollination services, crop yields could be further increased
successful agricultural production, pollination would contribute significantly to world food security.
4. Conclusion
The economic value of pollination services from wild pollinators in natural habitat of Gunung Tebu
FR in particular and Besut in general is about RM 6,588,630.91. It is equal to 56% of total production
value of the area. Hence, the support of pollination services towards the production crops are
significant and valuable. It is not only for food resources of the community in the region but also
contributed to other area since the production crops were exported.
However, the actual value of pollination services will be higher if pollination services for other
agricultural crops are considered in the study. Natural habitats such as forests for pollinators need to be
protected to ensure the ecological sustainability of the service as well as to ensure the safety of food
resources.
Acknowledgments
We would like to acknowledge both Forest Research Institute Malaysia and Forestry Department of
Peninsular Malaysia for the opportunity engaged in this collaboration project. Special thank for
Department of Agriculture, Terengganu for providing sufficient data and cooperation during the study.
References
[1] Millenium Ecosystem Assessment 2005
[2] The Economic of Ecosystem services and Biodiversity 2010
[3] Klein A M, Vaissière, B E, Cane J H, Steffan-Dewenter I, Cunningham S A, Kremen C and
Tscharntke T 2007 Importance of pollinators in changing landscapes for world crops Proc.
Royal Soc. B: Biol. Sci. 274 303–13
[4] Food and Agricultural Organization (FAO) of United State 2018 Bee-ing grateful to our
pollinators http://www.fao.org/fao-stories/article/en/c/1127922
[5] Roubik D W 1995 Pollination of cultivated plants in the tropics Bulletin 118 Food and
Agriculture Organization of the United Nations, Rome, Italy
[6] Ricketts T H 2008 Landscape effects on crop pollination services: are there general patterns?
Ecol. Lett. 11 499–515
[7] Gallei, N M, Salles J, Settele and Vaissière B E 2009 Economic valuation of the vulnerability
of world agriculture confronted with pollinator decline Ecol. Econ. 68 810–21
[8] Costanza R, d’Arge R S, de Groot S, Farber M, Grasso B, Hannon K, Limburg S, Naeem R V,
O’Neill J, Paruelo R G, Raskin P, Sutton and van den Belt M 1997 The value of the
world’s ecosystem services and natural capital Nature 387 253–60
[9] Pimentel D, Wilson C, McCullum C, Huang R, Dwen P, Flack J, Tran Q, Saltman T and Cliff
B 1997 Economic and environmental benefits of biodiversity BioScience 47 747–57
[10] Martin E C 1975 The use of bees for crop pollination In: Dadant & Sons (Ed.), the hive and
the honey bee, Hamilton Illinois 579–614
[11] Paull R E and Duarte O 2011 Tropical Fruits (2nd ed.) 1 and 2 CAB International,
Wallingford, England
[12] Earl of Cranbrook 1988 Key Environments: Malaysia Pergamon Press, Oxford, England
[13] Norowi H, Sajap A S, Rosliza J, Fahimie J and Suri R 2011 Conservation and sustainable
utilization of stingless bees for pollination services in agricultural ecosystems in Malaysia.
Universiti Putra Malaysia
5You can also read