POWER AFRICA TRANSMISSION ROADMAP TO 2030 - A PRACTICAL APPROACH TO UNLOCKING ELECTRICITY TRADE - USAID
←
→
Page content transcription
If your browser does not render page correctly, please read the page content below
POWER AFRICA
TRANSMISSION ROADMAP TO 2030
A PRACTICAL APPROACH
TO UNLOCKING ELECTRICITY TRADE
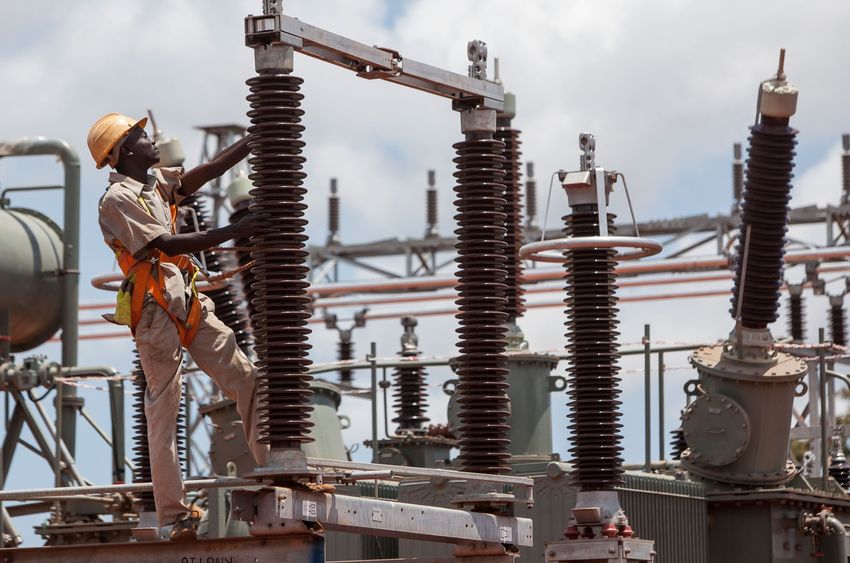
ACKNOWLEDGEMENT
Many individuals and organizations contributed to the development of this Power Africa
Transmission Roadmap. This strategy blends ideas, input, and vision from a wide range of
Power Africa’s many partners, including those serving in the U.S. Government agencies
and posts across sub-Saharan Africa, the private sector, international finance institutions,
and African institutions.

In particular, we would like to extend a special thank you to the following people
outside of the U.S. Government, who provided detailed input and insight: Actis, Lisa
Pinsley; African Development Bank, Angela Nalikka, Ifeyinwa Miriam Emelife, Jacques
Moulot and Omar Vajeth; Agence Française de Développement, Cyril Renault and
Florent Germain; Commonwealth Development Corporation, Hanaan Marwah;
Deloitte, Tunde Gbajumo; East Africa Power Pool; European Union, Georgios Grapsas;
Export-Import Bank of the United States, Rick Angiuoni; Globeleq, Jonathan Hoffman,
Christian Wright, Fiona Gonyea; International Renewable Energy Agency, Asami Miketa
and Daniel Russo; Japan International Cooperation Agency, Kamiishi Hiroto and
Wakamatsu Eiji; Korea Eximbank, Jae-Jeong Moon and Seonae Choi; Kreditanstalt für
Wiederaufbau, Kevin Leask; Millennium Challenge Corporation, Robert Anderson and
Thomas Haslett; New Partnership for Africa’s Development, Mosad Elmissiry; Nile
Equatorial Lakes Subsidiary Action Program, Grania Rosette Rubomboras; Norwegian
Agency for Development Cooperation, Geir Yngve Hermansen and Ørnulf Strøm;
West Africa Power Pool; Southern African Power Pool, Stephen Dihwa; Swedish
International Development Cooperation Agency, Anders Arvidson, Elisabeth Ilskog,
Monica Gullberg, Jörgen Eriksson and Stephen Mwakifwamba; Tetra Tech, Sarah
Thessing, David Mwangi, Wangeci Wanyahoro, Jaap du Preez, Barney Speckman, Ajit
Kulkarni, and Ryan Kilpatrick; The Energy Practice of the Tony Blair Institute, Gareth
Walsh and Sergio Portatadino; and World Bank, Rahul Kitchlu and Sudeshna Banerjee.

Finally, a special acknowledgement to all of the staff across U.S. Government agencies
and departments involved in developing this Power Africa Transmission Roadmap.

Cover: Substation in Tanzania. Photo: Jake Lyell for MCC
TABLE OF CONTENTS

        FOREWORD
        TARGETS FOR 2030
        EXECUTIVE SUMMARY

                                       7		 Introduction to Power Africa
                                       7 		 Rationale for developing a Transmission Roadmap
        7 CONTEXT OF THIS WORK         		 for sub-Saharan Africa
                                       8		 Objectives and scope of the Transmission Roadmap
                                       8		 How this Roadmap builds on and differs from previous work

                                       9		 2025 Supply/demand forecasts

        9 SUPPLY / DEMAND              12 2030 Supply/demand forecasts
         FORECASTS AND                 13		 Cost differentials
         OPPORTUNITIES FOR TRADE       14		 Opportunities for trade
                                       16		 Main challenges to unlocking regional power trade

                                       18		 Initial list of projects
       18 TRANSMISSION PROJECTS        19 Prioritization methodology
          THAT COULD HELP UNLOCK
                                       20		 List of priority projects
          TRADE POTENTIAL
                                       23		 Estimated benefits for connected countries

2030
       25 ROADMAP TO ACHIEVE           25		 Development partner engagement and main activities
         2030 OBJECTIVES               27 Action plan to achieve objectives

       32 CONCLSION

                                       33		 Appendix A: Full project list
       33 APPENDICES                   36 Appendix B: Acronyms
                                       38		 Appendix C: Supply and demand assumptions

                                  POWER AFRICA I TRANSMISSION ROADMAP TO 2030                          i
FOREWORD BY POWER AFRICA
      COORDINATOR ANDREW HERSCOWITZ,
      AND AFRICAN DEVELOPMENT BANK GROUP
      VICE PRESIDENT, POWER, ENERGY, CLIMATE
      AND GREEN GROWTH, AMADOU HOTT
                                                           The United States Government’s Power Africa
                                                           and the African Development Bank’s “Light Up
                                                           and Power Africa” and “Integrate Africa” initiatives
                                                           share the goal of bringing a massive amount of new
                                                           power generation online in Africa in the next few
                                                           years. We are currently tracking more than 800
                                                           power generation projects that have the potential
                                                           of being built by 2030. However, these potential
                                                           new megawatts will never come online if there is
      Andrew Herscowitz         Amadou Hott
                                                           no demand for that power, and if the transmission
      and distribution lines are not built to ensure efficient evacuation.

      With 600 million people in Africa lacking access to power, how can we say that there is no demand
      for more power? We need to tap into that latent demand and unleash unprecedented economic
      growth on the African continent.

      Development banks and agencies, the private sector, and governments have invested heavily in
      power generation. Some countries now have surplus supply. Others, however, still have critical power
      shortages. Over 40 percent of businesses cite the lack of a reliable power supply as the biggest
      constraint to their operations; and some have indeed closed or relocated.

      To increase universal access to energy and ensure a cost-efficient, reliable power supply, we are
      working together to move power to where it is needed, especially by focusing on transmission.
      Strong, effective and efficient regional power pools are critical to promoting universal access, and
      ensuring that countries, people and industry are not spending more money on power than they need
      to spend. Does it make sense for one country to spend $0.35/kilowatt hour (kWh) on a potential
      geothermal project when it could potentially import power from a neighboring country for $.07/
      kWh, or less? Power Africa and the African Development Bank (which has been mandated by the
      African Union Commission and the New Partnership for Africa’s Development to implement the
      Programme for Infrastructure Development in Africa, PIDA), are seizing the opportunity to improve
      coordination of all power pools and related parties and initiatives to support projects that enhance
      regional interconnections and encourage power trade.

      We will continue to work hand-in-hand, with our partners, to create enabling environments that will
      accelerate deals, build institutional capacity, ensure the effective execution of projects, and create the
      conditions to make these projects operational and sustainable.

ii   POWER AFRICA I TRANSMISSION ROADMAP TO 2030
The Power Africa Transmission Roadmap promotes the Regional Transmission Agenda, which is part of the
AfDB’s Sustainable Utility Transformation Agenda, and outlines a proposed action plan to move projects
in this Agenda forward. By 2030, we aspire to mobilize at least $3 billion to install 7,500+
MW of transmission capacity, and bring at least 10 priority projects to financial close.

The proposed Transmission Roadmap reaffirms our commitment to universal access in Africa through
cost-efficient project preparation and investment approaches, anchored on the right national and regional
energy mix. Recognizing that Power Africa and the AfDB cannot do it alone, we have set the ball rolling,
and we look forward to working with interested public and private stakeholders to contribute to, and
support the implementation of this agenda.

ANDREW HERSCOWITZ		                 AMADOU HOTT
Power Africa			                     African Development Bank Group

                                                POWER AFRICA I TRANSMISSION ROADMAP TO 2030                 1
POWER AFRICA
       TRANSMISSION TARGETS FOR 2030

                                                            PARTNERSHIPS
       Build upon the significant transmission work already underway by Power Africa partners
                     to accelerate efficient power markets in sub-Saharan Africa

                             7,500 MW
                      transmission capacity installed                           5,000 km
                                                                        of transmission lines installed

                        $3 BILLION
                        in transmission-related
                         investment mobilized                                                       10
                                                           10                         transmission projects
                                                                                    brought to financial close
                                                   cross-border
                                              transactions facilitated

     INCREASE GENERATION                                                          CREATE 60 MILLION
    CAPACITY BY 30,000 MW                                                         NEW CONNECTIONS

    These targets are ambitious yet realistic; they are based on the priority projects defined in Section 4 of this Roadmap, which have a high
    potential to unlock regional trade. These targets assume completion rates ranging between 70% and 100% depending on the projects’
    level of prioritization (high intervention, light support, or watchlist, as outlined in Section 4 – with a higher probability of completion for
    projects requiring light support). These numbers do not account for generation or transmission projects that will be commissioned after
    2025, due to the lack of reliable information on generation projects to be commissioned over this period.

2      POWER AFRICA I TRANSMISSION ROADMAP TO 2030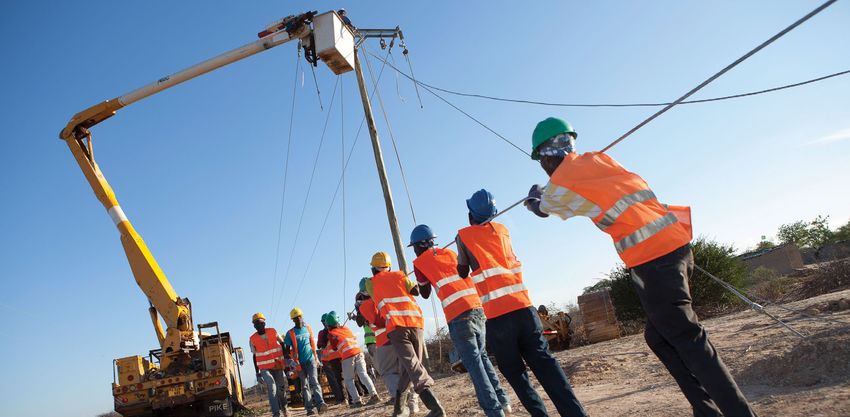
1 EXECUTIVE SUMMARY
RATIONALE FOR AND OBJECTIVES OF THE TRANSMISSION ROADMAP
Over the last decade, many governments and major bilateral donors have
focused their support of sub-Saharan Africa’s energy sector on advancing
country-based approaches to power generation and transmission. As a result,
some countries now have national supply surpluses and stranded power assets,
while others face critical supply shortages. However, the ability for electricity
trade to flow from areas of surplus to areas of demand is severely constrained,
within and across borders. This trend highlights the urgent imperative to move
power from its generation sources to where it is needed, thus providing cost-
efficient supply and enhancing energy security. In line with this imperative, Power
Africa’s 2.0 Strategy commits to increase access to electricity in sub-Saharan
Africa by increasing focus on transmission.
As an important step toward addressing this imbalance,           This Transmission Roadmap proposes an action plan to
the Power Africa Transmission Roadmap was developed              facilitate ongoing dialogue and action in the development
to help unlock electricity trade in the region. While            partner community focused on the priority projects. This
Power Africa’s efforts are focused on both national              dialogue will build on existing efforts at the sub-region level
and regional transmission, the primary purpose of this           (e.g., East, West, and Southern Africa) and help provide an
Transmission Roadmap is to highlight cross-boundary trade        integrated perspective on the cross-border transmission
opportunities that can be exploited for broader regional         agenda across sub-Saharan Africa. This integrated
electricity access and economic benefit. The Transmission        perspective will enable public and private stakeholders to
Roadmap therefore has two main objectives. First, it aims        identify potential gaps in the support provided to priority
to enhance cooperation between major stakeholders by             projects and facilitate cross-regional dialogue to address
identifying transmission projects that are critical to cross-    these gaps.
border electricity trade and highlighting bottlenecks/risks of
delay (this focus would also include domestic projects with      OPPORTUNITIES FOR TRADE AND
the potential to support regional trade, e.g., by connecting
                                                                 PRIORITY PROJECTS
new generation capacity to cross-border lines). Second,
it aims to support priority projects by highlighting the         The Power Africa Transmission Roadmap identifies 10 major
contributions development partners can make to their             immediate opportunities for regional power trade in East,
completion, to complement government-led initiatives.            West, and Southern Africa. These opportunities reflect

                                                            POWER AFRICA I TRANSMISSION ROADMAP TO 2030                            3
current or projected imbalances in power supply/demand,      To realize these opportunities, we identified 18 priority
    and have an economic rationale, i.e., importing power        transmission projects (Exhibit 2). We prioritized these
    would be cheaper for a given country than generating it      projects based on their potential to unlock regional trade,
    domestically or resorting to emergency power generation.     their scheduled completion time, and the feasibility of
    Specifically:                                                resolving the bottlenecks they face. Four of these priority
                                                                 projects are in East Africa, nine are in Southern Africa,
    • TWO OPPORTUNITIES IN EAST AFRICA: Exports
                                                                 and five are in West Africa. Together, these projects
      to Tanzania (EKTZ line) and Southern Africa, and
                                                                 represent the potential for a combined installed
      sub-regional trade in the Nile Basin (NELSAP power
                                                                 capacity of 11,000+ MW and 7,200+ km of lines.
      interconnections).
    • FOUR OPPORTUNITIES IN SOUTHERN AFRICA:
      Central corridor from South Africa to the Democratic
                                                                 ACTION PLAN AND COORDINATION
      Republic of Congo; integrating Malawi into the power       Many of the priority projects face bottlenecks/risks
      pool; western corridor delivering power to Namibia;        of delay. We identified three types of bottlenecks and
      and bringing new power capacity to the region (e.g.,       recommended actions for each:
      Mozambique).
                                                                 • Enabling environment, including permits and political
    • FOUR OPPORTUNITIES IN WEST AFRICA:                           involvement at the national or regional level that can
      Interconnection of the Senegal-Guinea axis (OMVG             facilitate project coordination and help negotiations;
      line); addressing power deficits in landlocked countries
                                                                 • Funding, or the ability to secure concessionary
      (e.g., Burkina Faso); enabling Côte d’Ivoire to export
                                                                   financing sources for early stage development, feasibility
      to the West (CLSG line); and addressing regional
                                                                   studies and/or financial close; and
      imbalances in the eastern Gulf of Guinea.
                                                                 • Project implementation issues that can jeopardize
                                                                   project timelines, construction quality and/or budgets.

    EXHIBIT 2
    COUNTRIES IN SCOPE AND PRIORITY TRANSMISSION PROJECTS IDENTIFIED

4           POWER AFRICA I TRANSMISSION ROADMAP TO 2030
Stakeholder coordination is critical to the success of these
projects. Given the number of stakeholders active in
transmission in sub-Saharan Africa – governments, regional
power pools and bilateral and multilateral organizations –
the coordination around the action plan must leverage the
existing mechanisms in each power pool, the support of
development partners, and ongoing Africa-wide initiatives
(e.g., Program Infrastructure Development for Africa
(PIDA) under the African Union). More focused effort
around specific project gaps could accelerate execution
and mobilize investment.

Attracting more private investment into these regional
transmission projects that are typically financed by the
public sector is also important. Power Africa and our
partners have the opportunity to bring the private sector
to the discussion by developing alternate financing models
to advance this approach and working hand-in-hand with
governments to increase the visibility on prerequisites
to implementation (e.g., permits and land access).

    Working together on the priorities
    identified in this Transmission
    Roadmap, Power Africa and our
    partners can help move power
    to where it is needed to provide
    a more cost-efficient supply and
    enhance energy security across
    the continent.

                                                           POWER AFRICA I TRANSMISSION ROADMAP TO 2030   5
Mtoni Service Station Zanzibar. Photo: Jake Lyell for MCC

6             POWER AFRICA I TRANSMISSION ROADMAP TO 2030
2 CONTEXT OF THIS WORK
INTRODUCTION TO POWER AFRICA
In June 2013, the United States (U.S.) Government launched Power Africa in
partnership with African governments, bilateral and multilateral development
partners, and the private sector to double access to electricity in sub-Saharan
Africa and accelerate power transactions. The partnership comprises more than
160 public and private sector entities. Now in our fifth year, Power Africa has
built the financial and human resources, recruited the partners, and identified
the specific deal flow to create a clear path to success.
Power Africa aims to increase installed generation capacity       RATIONALE FOR DEVELOPING A
by 30,000 megawatts (MW), while adding 60 million new             TRANSMISSION ROADMAP FOR SUB-
household and business connections by 2030. In February
                                                                  SAHARAN AFRICA
2016, the U.S. Congress passed the Electrify Africa Act of
2015, which charges Power Africa with increasing installed        Over the last five to ten years, assistance
generation capacity by 20,000 MW and providing first-time         from many major bilateral and multilateral
energy access for 50 million beneficiaries by 2020 — an           development partners in the energy sector in sub-
effort that directly supports Power Africa’s original goal.       Saharan Africa has focused on advancing country-
                                                                  based approaches to generation and transmission.
In March 2018, Power Africa released the Power Africa             Some countries now have national supply surpluses and
2.0 Strategy, which builds on the original generation             stranded power assets, while their neighbors face critical
and access objectives to increase focus on improving              supply shortages. However, the ability for electricity to
distribution and transmission. Strategic Pillar I supports        flow from areas of surplus to areas of demand is severely
generation projects to reach the 30,000 MW target by              constrained, within and across borders. This trend highlights
2030. Strategic Pillar II focuses on achieving 60 million         the urgent need to move power from its sources of
connections, and includes support for transmission and            generation to where it is needed – including across
distribution lines, regional integration and trading. Strategic   borders – to provide cost-efficient supply and enhance
Pillar III aims to unlock the potential of the energy sector      energy security.
through the enabling environment.
                                                                  The imperative to shift power across borders is in line
As of October 2018, Power Africa had helped bring 9,635           with Power Africa’s commitment to increasing access to
MW of generation projects to financial close and helped           electricity in the region, and with the focus on transmission
12.5 million new households obtain access to electricity.         under the Power Africa 2.0 Strategy. This Transmission
Our partners have invested over $18 billion in 119                Roadmap also aligns with key U.S. policy goals outlined in
electrification projects to date. These achievements put          the Department of State and USAID Joint Strategic Plan
Power Africa on track to attain our 2020 and 2030 goals.          (JSP) and the United States National Security Strategy.

                                                              POWER AFRICA I TRANSMISSION ROADMAP TO 2030                         7
These goals include, among others, removing barriers to Niger, Nigeria, Rwanda, Senegal, Sierra Leone, South Africa,
energy trade and promoting U.S. exports, working to attain eSwatini, Tanzania, Togo, Uganda, Zambia, and Zimbabwe.
universal energy access, and ensuring energy security for In terms of transmission, the Roadmap focuses on inter-
U.S. allies and partners. country lines but also includes certain domestic lines that
are critical to enabling cross-border trade by evacuating
OBJECTIVES AND SCOPE OF THE power from stranded assets (these domestic lines can also
address local deficits domestically during peak periods).
TRANSMISSION ROADMAP
The Transmission Roadmap has two main HOW THIS ROADMAP BUILDS ON AND
objectives. First, to enhance cooperation between
DIFFERS FROM PREVIOUS WORK
major stakeholders by identifying transmission projects
critical to cross-border electricity trade and highlighting This Transmission Roadmap builds on previous
bottlenecks/risk of delay. Second, to motivate action to work conducted by Power Africa, our partners,
address the bottlenecks these projects face by highlighting and the regional power pools to prioritize and
potential contributions from development partners and analyze transmission and coordinate local development
contributing to facilitate existing coordination mechanisms. partner efforts. Most of these previous transmission
This Transmission Roadmap thus builds on existing efforts analyses were done at the level of the regional power
at the sub-region level (e.g., East, West and Southern pools. We leveraged three major sources of insight in the
Africa) while providing an integrated perspective on the development of this Roadmap:
cross-border transmission agenda for sub-Saharan Africa.
• Africa-wide and sub-region initiatives developed by
bilateral or multilateral institutions, e.g., Africa Power
This Transmission Roadmap highlights the transmission
Vision by the New Partnership for Africa’s Development
and distribution work that Power Africa’s partners are
(NEPAD)1;
engaged in across the region to illustrate the collective
effort required to implement and sustain our goals. The • Power Africa work conducted in 2017 and 2018 at
Transmission Roadmap does not attempt to provide a the sub-region level in West Africa, East Africa, and
comprehensive breakdown of all Power Africa activities in Southern Africa;
every country, nor a view of every partner’s activities. • Where relevant, interviews with additional experts
to understand major updates to the project portfolio/
This Transmission Roadmap offers a tangible plan to context since the publication of the aforementioned
realize a common vision of an economically vibrant reports.
sub-Saharan Africa by developing its transmission
network to unlock regional power trade in a rapid and This Transmission Roadmap therefore offers a consolidated
transparent manner. It evaluates the roles currently played and updated perspective on work done previously while
by different development partners and identifies gaps seeking to define priorities and the most critical bottlenecks
where intervention may be required. It also prioritizes the across the sub-regional power pools. It does not intend to
specific interventions on which Power Africa could focus, go to the same level of detail as other reports, but rather
complementing the work of other development partners. to provide actionable insights on transmission projects that
could unlock trade in sub-Saharan Africa. The list of projects
The geographic scope of the Transmission Roadmap and priorities is based on the latest information available
covers 32 countries that were included in the work to date and should therefore be updated once more
previously done for Power Africa at the sub-region level: visibility is provided on long term transmission projects (or
Angola, Benin, Botswana, Burkina Faso, Cameroon, Côte generation projects that could unlock regional trade).
d’Ivoire, Democratic Republic of Congo (DRC), Ethiopia,
Gambia, Ghana, Guinea, Guinea-Bissau, Kenya, Lesotho,
Liberia, Malawi, Mali, Mauritania, Mozambique, Namibia,
1 Africa Power Vision Concept Note and Implementation Plan (January 2015), NEPAD
8 POWER AFRICA I TRANSMISSION ROADMAP TO 20303 SUPPLY/DEMAND FORECASTS AND
OPPORTUNITIES FOR TRADE
The following supply/demand forecasts are split into two timeframes:
2018-2025 and 2025-2030.
2025 SUPPLY/DEMAND The main sources to estimate peak demand and supply
FORECASTS include country-specific integrated resource plans, prior
regional studies conducted by and for Power Africa, the
Analyzing demand and supply dynamics is critical latest updates from expert interviews, as well as publicly
to understanding the volumes available for trade available sources such as Enerdata and UDI World Electric
and to identifying priority interconnector lines that Power Plants Database.
need to be built to move surplus power to countries with a
power deficit. Based on anticipated domestic consumption
and expected timelines for commissioning of generation
plants, the 32 countries examined have varying levels of EAST AFRICA
excess power supply or deficit. East Africa’s peak supply of around 7,800 MW (2018)
is expected to grow to ~17,800 MW by 2025, with
To determine the regional anticipated peak demand and peak demand of ~7,000 MW growing to ~14,400 MW.
supply up to 2025, we: Ethiopia, Kenya, and Uganda will have power surpluses,
• Estimated peak annual demand in MW for each country while Tanzania and Rwanda will have deficits through 2022
and scaled it up by 15 percent to account for reserve and 2020, respectively. Opportunities therefore exist for
margins and system losses. cross-border trade (Exhibit 3).
• Derived peak available capacity from installed capacity • Ethiopia, Uganda and Kenya exhibit surpluses of power
adjusted by peak capacity factors, estimated from prior − Ethiopia’s large surplus of ~1,200 MW is expected
work; when capacity factors were unavailable, we used to grow to ~1,900 MW by 2025 as new generation
assumptions depending on the source of energy.2 capacity comes online (e.g., Baro, GibeIV, Karadobi,
• Used planned commissioning of generation plants and Renaissance hydroplants). These assumptions
to track generation projects expected to come on supply will need to be revised once more visibility
online between 2018 and 2025 (as well as planned is provided on these generation plans. The
decommissioning). These new generation projects predominance of low-cost hydropower – which
contribute to the estimated peak surplus/deficit per will account for 95 percent of available generation
country over the period. capacity by 2025 – gives Ethiopia a strong competitive
advantage in terms of exports (however, seasonal
2 In East and Southern Africa, the peak hour capacity factors used were 0% for solar, 30% fluctuations in hydropower capacity may impact
for wind, 90% for hydropower dams, and 95% for other technologies; in West Africa,
country- and source-specific factors were used the surplus available on a monthly level). Ethiopia
POWER AFRICA I TRANSMISSION ROADMAP TO 2030 9currently exports 200 MW to Djibouti and Yemen, while Kenya’s surplus should grow to nearly 700 MW
and additional exports to Sudan will push this total by then.
to1,200 MW by 2022. Draftagreements with Egypt
• In 2018, Rwanda and Tanzania have deficits (of 13 and
also suggest further export potential to North Africa.
485 MW, respectively) but the commissioning of new
− Uganda and Kenya’s peak surplus is less significant, generation projects will likely create a surpluses in 2020
at 112 and 52 MW in 2018, respectively. Uganda’s (Rwanda) and 2022 (Tanzania). Not all of these projects
generation mix is primarily based on hydropower, are confirmed, so extended domestic deficits may
while Kenya’s is dominated by geothermal. Uganda’s persist in the medium term (excluding imports).
surplus should remain around 100 MW by 2025,
EXHIBIT 3
EAST AFRICA PROJECTED PEAK SURPLUS/DEFICIT
Evolution of peak demand/supply for East Africa, MW Peak surplus/deficit, MW
NOTE: totals may not sum up due to rounded numbers
follow the opposite trajectory. Again, this situation suggests
WEST AFRICA opportunities for inter-country trade (Exhibit 4).
• Ghana is expected to maintain significant surplus over
West Africa’s peak supply of ~13,500 MW in 2018 is
2018-2025 (between ~500 MW and ~1,300 MW).
forecast to grow to ~30,400 MW in 2025, with peak
Historically dominated by hydropower, there is an
demand of ~17,700 MW growing to ~30,600 MW. Ghana,
increase of gas in the generation mix. Similarly, Côte
Côte d’Ivoire, Cameroon, Guinea, Liberia, Senegal and
d’Ivoire is also expected to grow its surplus from around
Togo should maintain energy surpluses between 2018 and
300 MW to over 1,500 MW over 2018-2025 through
2025, while Burkina Faso, Gambia, Guinea Bissau, Niger
additional generation from hydropower and gas plants.
and Nigeria should have deficits over the period (with
Niger transitioning to surplus in 2025). Benin, Mauritania • Cameroon, Guinea, Liberia, Senegal and Togo are
and Sierra Leone are expected to transition from light expected to have generation surpluses, but smaller than
deficit to light surplus over the period, while Mali should Ghana and Côte d’Ivoire.
10 POWER AFRICA I TRANSMISSION ROADMAP TO 2030• Burkina Faso, Gambia and Guinea Bissau are expected addressed at the domestic level with the support from
to maintain a generation deficit (-101, -82, -15 MW, development partners present in the country, we do
respectively in 2018, staying at similar levels up to 2025, not expect generation to recover fast enough to allow
except for Burkina Faso where the surplus will grow to for peak surpluses by 2025. The electricity sector is
-435 MW); Niger should remain in deficit in the short mainly based on natural gas thermal power plants (~85
to medium term, transitioning to surplus in 2025. percent of the grid-connected power plants are gas,
while the remaining 15 percent are hydropower plants).
• Nigeria highlights the most significant deficit in the
region at ~3,400 MW in 2018. This is the result of • Benin, Mauritania and Sierra Leone are expected to
significant challenges in the power sector, including a transition from moderate/low peak deficit (between
lack of maintenance and repair of existing generation -14 and -126 MW) in 2018 to peak surpluses (~100-
capacity and a critical deficit in domestic transmission 130 MW) by 2025; conversely, Mali should follow the
capacity. While these challenges are currently being opposite trajectory, suggesting future import needs.
EXHIBIT 4
WEST AFRICA PROJECTED PEAK SURPLUS/DEFICIT
Evolution of peak demand/supply
for West Africa, MW Peak surplus/deficit, MW
NOTE: totals may not sum up due to rounded numbers
transition from deficit to surplus over the period. Southern
SOUTHERN AFRICA Africa also offers opportunities to trade power between
countries (Exhibit 5), in some cases facilitated by existing
Southern Africa’s peak supply of ~63,700 MW (2018) infrastructure.
will rise to ~76,800 MW in 2025, with peak demand of
• South Africa and Angola exhibit significant surplus and
~54,300 MW growing to ~66,200 MW. The aggregate
opportunity for exports to neighboring countries:
surplus of ~9,400 MW (2018) is driven by countries
with surpluses (Angola and South Africa), while some − South Africa’s current surplus of ~8,800 MW is
countries (e.g., Malawi, Namibia) will have power deficits. expected to remain by 2025, with a power
Countries like Mozambique and Zambia are expected to generation mix dominated by coal;
POWER AFRICA I TRANSMISSION ROADMAP TO 2030 11− Angola’s surplus of ~2,500 MW should grow to • Botswana is expected to transition from a small surplus
~3,000 MW in 2025, driven by hydropower and oil. (53 MW) in 2018 to a slight deficit by 2025, also
suggesting the need to import power at peak demand.
• DRC (-201 MW in 2018), Lesotho (-102 MW), Malawi
(-75 MW), Namibia (-389 MW), eSwatini (-171 MW), • Mozambique and Zambia should transition from peak
and Zimbabwe3 (-626 MW) should remain in deficit deficit to surplus between 2018-2025. In particular,
over 2018-2025 due to insufficient generation and Zambia is expected to transition to a surplus in 2023
transmission constraints that prevent them from (434 MW) that grows to 925 MW in 2025, mostly
integrating power domestically. These countries are thanks to the commissioning of the Kafue Gorge Lower
expected to import power when they hit peak hydropower project. Strengthening interconnections
demand, requiring the accelerated construction between Zambia and the rest of the region can help
of transmission lines. evacuate this surplus, but also mitigate risks from
drought-related lower hydropower capacity for
countries that are largely dependent on this source
EXHIBIT 5
of energy.
SOUTHERN AFRICA PROJECTED PEAK SURPLUS/DEFICIT
Evolution of peak demand/supply
for Southern Africa, MW Peak surplus/deficit, MW
NOTE: totals may not sum up due to rounded numbers
2030 SUPPLY/DEMAND projections reliable. We therefore expect all of these
FORECASTS generation projects to come online based on their latest
expected commissioning date.
The above supply projections for the three power pools
The 2025-2030 generation pipeline is more difficult to
run until 2025 and are based on analyses of generation
predict because projects are more uncertain for this
projects expected to come online. Many of these projects
timeframe. Consequently, the number of transmission
have gone through the development phase and have
projects required to address both domestic and cross-
reached (or are near) financial close, making these
border needs is also difficult to predict. Our supply
3 All work concerning Zimbabwe is subject to United States Government rules estimates, which are based on expected commissioning
and regulations concerning Zimbabwe.
12 POWER AFRICA I TRANSMISSION ROADMAP TO 2030dates for generation plants, are therefore likely to is typically around 40 to 50 cents per kWh). While this
underestimate the actual supply for 2025-2030, as they analysis does not reflect actual prices charged for power in
would exclude generation plants not yet in the pipeline. peak or off-peak cycles, it clearly suggests the potential for
However, our analyses suggest that countries with a large cross-border trade in sub-Saharan Africa.
power surplus before 2025 (e.g., Côte d’Ivoire, Ethiopia,
EXHIBIT 6
South Africa) will maintain this surplus through the advent
of additional gas, hydropower, geothermal and solar COST-EFFICIENT TRADE OPPORTUNITIES EXIST FOR
DEFICIT COUNTRIES IN EACH POWER POOL
generation capacity. Pre-feasibility and feasibility studies
will be required to understand which generation plants
are likely to be developed in each country and what
new transmission lines will be needed to take power
to countries in deficit. Such an update to the pipeline
of transmission projects could take place in 2020, once
the pipeline of generation projects for 2025-2030 is
more certain.
COST DIFFERENTIALS
Regional power is traded when a country with
a generation surplus becomes connected to a
country with a generation deficit and when an
economic rationale exists for the trade. For a
country in deficit, it makes sense to import power if it
costs less than emergency power capacity or power
from more costly, inefficient domestic sources.
We looked at the generation cost of power across the
32 countries and mapped it to each country’s expected
surplus or deficit over the next five years (Exhibit 6).
Generation cost is the average cost of producing one kWh
of power, i.e., the weighted average cost across the various
sources of energy used by a country (e.g., coal, gas, hydro,
solar). It differs from the cost of power charged to the end-
consumer, which is not analyzed here. While generation
costs do not include transmission costs (both domestic
and cross-border), they can be considered as an indicative
measure of where trade may be more cost efficient (versus
emergency power capacity).
The analysis indicates that in each sub-region, countries
with an energy deficit will be able to find opportunities
to import from countries with an available surplus and
competitive cost (e.g., Tanzania could import from Ethiopia
in East Africa; Sierra Leone could import from Côte
d’Ivoire in West Africa). Moreover, the cost of power from
the countries with major surpluses is significantly lower
1 Energy consumption calculated on the basis of a 2 hours peak demand/supply per day,
than the cost of using an emergency power supply (which 365 days per year
POWER AFRICA I TRANSMISSION ROADMAP TO 2030 13OPPORTUNITIES FOR TRADE
We identified 10 major opportunities for EXHIBIT 7
regional electricity trade in East, West and OVERVIEW OF THE MAIN TRADE OPPORTUNITIES
Southern Africa (Exhibit 7). They reflect current or
projected regional imbalances in power supply/demand,
as well as the economic rationale outlined in the previous
section. These trade opportunities focus on areas
where local surplus of power could be used to address
a country’s deficit. Trade opportunities between two
countries in deficit (e.g., between Niger and Nigeria)
were not included in this approach; we also excluded
trade opportunities between countries in surplus.
Section 4 of this Transmission Roadmap identifies
priority projects that could unlock these opportunities,
and Section 5 outlines the main bottlenecks and action
required to ensure their timely completion.
EAST AFRICA
1. Exports to Tanzania (EKTZ line); Tanzania will
experience a supply deficit in the medium term,
ranging between -500 and -800 MW. Sources of
power could come from Ethiopia (expected to have
generation surpluses of ~1,200-1,900 MW from low
cost hydropower), Uganda given its expected surplus
growth, or Kenya to a lesser extent. SAPP could
also be an alternative, through the interconnection
with Zambia.
2. Nile Basin sub-regional trade (NELSAP power
interconnections) could move power to Rwanda,
which is expected to remain in deficit in the short
term. Power could come from Kenya or Ethiopia,
through a reinforced interconnection around Lake
Victoria (covering Kenya, Uganda, Rwanda, Burundi,
and Tanzania, with connections to DRC, as well).
SOUTHERN AFRICA
3. Central corridor opportunity between South
Africa, Zimbabwe, Zambia, Mozambique and the DRC
to export power to Zambia and industrial offtakers,
such as the Copperbelt in southern DRC and north-
western Zambia (accumulated deficit could reach
14 POWER AFRICA I TRANSMISSION ROADMAP TO 2030~2,000 MW). Power sources would include South future surpluses from Senegal (e.g., the Sambangalou
Africa in the short term and Mozambique in the hydropower project).
medium term.
8. Addressing power deficit in landlocked
4. Connecting Malawi to the power pool countries (e.g., Burkina Faso, Niger) through
(expected deficit of up to -400 MW in 2025) through a northern connection in Ghana, which has
a connection to Mozambique and the rest of the surpluses (over 1,000 MW in the short run and over
Southern Africa Power Pool. 500 MW in 2025).
5. Western Corridor opportunity / delivering 9. Enabling Côte d’Ivoire to export its surplus
power to Namibia (expected deficit of -400 MW to the West, especially to Sierra Leone and Guinea,
before 2025), most likely from neighbors with a surplus which will experience deficits before 2025, via the
supply, e.g., South Africa or Angola. CLSG line.
6. Bringing new power capacity to the regional 10. Addressing regional imbalances in the eastern
market, especially in Mozambique (gas), South Africa Gulf of Guinea, with opportunities including exports
(various sources) and Zambia (mostly hydro, e.g., Kafue from Togo (surplus ranging between 20-50 MW
Gorge Lower), which would allow additional generation between 2018 and 2025) to Benin (deficit between
surpluses to be traded across the region. 50 and 130 MW over the period), and Cameroon to
Nigeria, which should experience significant deficit
through 2025 and beyond.
WEST AFRICA
7. Interconnection of the Senegal-Guinea The above estimates represent a theoretical,
axis, particularly through the Gambia River Basin maximum trade volume, and do not consider
Organization (Organisation pour la Mise en Valeur financing, technical or commercial factors (e.g.,
du fleuve Gambie, or OMVG), which covers Senegal, commissioning of transmission lines, or signature
Guinea, Guinea-Bissau and Gambia, to supply countries of Power Purchase Agreements (PPAs) that would
in deficit (e.g., Guinea-Bissau) and dispatch potential enable this trade).
Power lines in rural Tanzania. Photo: Jake Lyell for MCC
POWER AFRICA I TRANSMISSION ROADMAP TO 2030 15MAIN CHALLENGES TO
UNLOCKING REGIONAL POWER Example of the importance of securing
TRADE rights of way: the Mombasa – Nairobi
transmission line
Three main challenges impede the development
of transmission lines that could unlock regional The transmission line from Mombasa to Nairobi
power trade: enabling environment, funding, and (481 km, 220/400kV) was commissioned in August
project implementation. 2017, to connect the capital of Kenya to coastal
generation capacity. The project experienced
• Enabling environment includes, for instance,
delays of more than three years, partly due to
required permits (e.g., rights of way) and political
right of way issues.
traction, which can facilitate project coordination
as well as inter-country negotiations. This line faced multiple disputes related to land
access along its route, including compensation
− Failure to plan or foresee risks in securing rights
levels, affected acreage, identifying the rightful
of way to build transmission infrastructure can
landowner, and damage due to construction
cause significant delays, create additional funding
works. These issues required KETRACO, the
needs, and potentially require political or third-
local transmission company, to undertake
party intervention to facilitate dialogue.
various mitigation actions such as re-evaluating
Environmental concerns can also inhibit
compensation packages, engaging with local
transmission development.
authorities, and re-routing sections of the line.
− Political traction is essential to facilitate inter- This project highlights the importance of securing
country negotiations, for instance complex rights of way early on in the project lifecycle, as
bilateral negotiations on power purchase it can cause significant delays and cost overruns
agreements orwheeling charges. Political from compensation and running expenses. Rights
drive is also critical when prioritizing regional of way can thus impact a project’s financial stability
projects and must be taken into account at and deter investors. Community engagement4
both the regional and national level. Finally, it at the early stages of project development is
can facilitate project coordination, for example, critical to ensure accuracy and transparency in
by pulling in the right stakeholders (e.g., regulators, the land acquisition component of a project, to
utilities) at national or regional meetings. In the ensure fairness in compensation and/or other
case of regional transmission projects, a key benefits shared with affected communities, and to
challenge is to align the political will of different understand and manage community grievances.
jurisdictions.
− Also included in the enabling environment is
logistics, which can cause delays in imports of
equipment if import procedures or infrastructure
are not adequate.
4 Power Africa’s Guide to Community Engagement for Power Projects in Kenya, (January
2018), is designed to help power generation and transmission project developers
plan and implement more effective, comprehensive, and transparent community
engagement strategies, with an emphasis on creating positive outcomes
for companies and communities alike.
16 POWER AFRICA I TRANSMISSION ROADMAP TO 2030• Funding refers to the ability to secure financing • Project implementation can threaten adherence
sources for various stages of the project, such as to project schedules, quality, and cost expectations.
early-stage development, feasibility studies, and project An example of an obstacle related to project
construction. Securing funding is a critical enabler, and implementation is the failure of a contractor to meet
a recurring challenge for regional transmission projects. its contractual obligations, which can cause significant
Several reasons can explain funding difficulties, including: delays. For instance, some Northern Corridor projects
in the Nile basin sub-region are being stalled by poor
− Challenges in proving bankability: As with
performance and/or bankruptcy of contractors. If
any infrastructure project, the bankability of
the initial contract does not fully account for these
transmission projects partly relies on the reliability
situations, terminating it can cause additional delays and
of future revenue streams, in this case traditionally
costs. Even after construction, issues may arise in terms
demonstrated through long term contracts with
of operationalization and O&M. Some of these issues
creditworthy offtakers. In the transmission space,
can also be related to the limited availability of skilled
the offtakers are typically utilities with often low
workers.
levels of creditworthiness. Before investment
decisions can be made, there needs to be a critical
feasibility assessment of probable trading volumes,
as well as of offtake prices (which are not always Why choosing the right contractor matters:
cost-reflective, based on the regulations in place). Lake Turkana transmission project
For regional transmission projects, revenues would
The Lake Turkana transmission project connects
come from the utility in a different country, which
the 310 MW Lake Turkana wind farm in northern
can increase the difficulty of recovering arrears.
Kenya to the country’s main interchange in Narok,
− Limited private investments: Historically, 428 km to the south.
private investments in energy in Africa have
The initial contractor hired for this project faced
focused on generation, rather than transmission
bankruptcy after completing ~70% of the work.
projects. World Bank analyses of private participation
Despite early warning signs related to its financial
in this space identify only a limited number of
situation, the contractor remained in place even
examples. Three whole-of-grid concessions were
after construction was put on hold for more than
analyzed as a part of this study (Cameroon, Mali,
a year. Faced with growing pressure from the
Senegal), and it was found that very little investment
country’s utility company and investors in the idle
had been made to expand the transmission network.5
wind farm, the government signed a performance-
based contract with a new consortium. In early
2018, construction resumed and was completed
six months later.
5 Linking Up: Public-Private Partnerships in Power Transmission in Africa (2017),
World Bank Group
POWER AFRICA I TRANSMISSION ROADMAP TO 2030 174 TRANSMISSION PROJECTS THAT COULD
HELP UNLOCK TRADE POTENTIAL
INITIAL LIST OF PROJECTS
We selected the initial list of projects based on two types of transmission lines
that can enable power trade in sub-Saharan African countries:
• Cross-border transmission lines (e.g., Kenya to These projects are key to capturing the trade opportunities
Tanzania line from Isinya to Singida); identified in Section 3. We identified nine projects in East
Africa, 19 in Southern Africa, and 19 in West Africa.
• Domestic lines that bring in new generation capacity
or connect different parts of national grids to ensure
We developed an understanding of these projects on
the power supply reaches interconnected substations,
four dimensions to form a comprehensive and up-to-date
which can address local domestic deficits and enable
picture of each situation:
cross-border trade in off-peak period (e.g., Mozambique
domestic line from Vilanculos to Maputo, which brings • KEY PROJECT DETAILS: Description of the
400 MW from the Temane gas plant to the grid). For transmission line, its route and technical specifications
purposes of this analysis, we did not include transmission (Expected COD6, capacity (MW), voltage (kV), length
lines needed strictly for domestic use. Such analysis at a (km) and total CAPEX)
more granular country level will be done as a next step.
• STATUS: latest stage achieved by the project in its life-
cycle (development, feasibility, wayleaves, construction
We also excluded interconnections to countries not in
or operation)
scope (e.g., South Sudan, Somalia).
• CURRENT OBSTACLES: main bottlenecks hindering
We used three major sources of information to develop the project’s implementation across three dimensions
the initial list of projects: (enabling environment, funding, project implementation)
• Previous Power Africa work at the sub-region level • DEVELOPMENT PARTNER CONTRIBUTION:
(East, West, and Southern Africa); Identification of development partners involved
in each project and the nature of their support
• The latest available preparatory work for the regional
(funding, technical assistance)
masterplans;
• Development partner and Africa transmission expert The projects have then been mapped against the
interviews and materials. countries’ current power surpluses and deficits to identify
and prioritize the ones that would help capture trade
We selected 47 transmission projects: 40 inter-country opportunities.
and seven domestic lines (see full list in the Appendix). 6 Our best understanding of the latest expected Commercial Operation Date of the
project, identified through official sources, expert interviews and/or press research
18 POWER AFRICA I TRANSMISSION ROADMAP TO 2030PRIORITIZATION even if they happen further into the future. Projects
METHODOLOGY addressing a total deficit equivalent to 100 MW or more
are deemed to have large potential to unlock trade;
Our prioritization of transmission projects identifies those projects addressing a lower number of MW are not
that will unlock large trade potential and where Power considered to be a priority.
Africa and our partners can address bottlenecks or
potential risks to ensure that they are commissioned on
schedule (Exhibit 8).
STEP 2 - TIMING: DOES THE
SCHEDULED COMMISSIONING DATE
We used three main criteria to prioritize the ALIGN WITH THE TRADE NEEDS OF THE
projects: impact, timing and feasibility. CONNECTED COUNTRIES?
The timing of a project refers to the difference in years
STEP 1 - IMPACT: DOES THE PROJECT between the expected date of commissioning and the
HAVE REAL POTENTIAL TO UNLOCK earliest occurrence of a deficit/surplus in the countries
TRADE? that the project connects. If the difference is less than one
year, the project is deemed to align with trade needs; if the
The impact of a project is estimated in terms of the supply difference is more than one year, the project needs to be
deficit it can address. For each project, we measured the accelerated. For projects that need to be accelerated, the
supply deficit of the connected country/countries by potential for acceleration is theoretical, and provided on
multiplying the average annual size of the deficit by its a best practice basis. Actual feasibility for acceleration will
duration in years. Deficits were not time discounted to need to be determined on a project-by-project basis.
reflect the importance of deficits spanning several years,
EXHIBIT 8
PROPOSED PRIORITIZATION METHODOLOGY FOR TRANSMISSION PROJECTS
POWER AFRICA I TRANSMISSION ROADMAP TO 2030 19STEP 3 - FEASIBILITY: HOW CAN • PRIORITY PROJECTS ON THE WATCHLIST:
POWER AFRICA AND OUR PARTNERS projects in this category are considered to deliver
sufficient impact, and (1) enjoy the right timing vs. trade
ENSURE THAT THE PROJECT IS
needs but face significant obstacles/risk of delay that
COMMISSIONED WHEN NEEDED? cannot be addressed under current conditions or
We categorized bottlenecks/potential risks to completion (2) need to be accelerated but cannot be under
into the three categories described in the section on current conditions.
challenges: enabling environment, funding, and project
implementation.
LIST OF PRIORITY PROJECTS
For each project, we then provided a qualitative assessment Based on the prioritization methodology
of the magnitude of the bottleneck(s) or risk(s) based on described above, we identified 18 projects that
expert interviews and the latest data available. Projects could unlock power trade in sub-Saharan Africa:
with redundancies were not kept as priorities. four in East Africa, five in West Africa, and nine in Southern
Africa (Exhibits 9-11). Together, these projects represent a
The three steps described above are analyzed sequentially combined installed capacity of 11,000+ MW and 7,200+
to determine the prioritization of each project. We defined km of lines. These projects can be mapped to eight of
three levels: the 10 trade opportunities identified in Section 3. Some
• PRIORITY PROJECTS REQUIRING ACTIVE projects linked to two of the trade opportunities (enabling
INTERVENTION: projects in this category are Côte d’Ivoire exports to the West and addressing regional
considered to deliver sufficient impact, enjoy the right imbalances in the eastern Gulf of Guinea) have not been
timing vs. trade needs, but face significant obstacles/ prioritized because their potential impact on regional trade
risk of delay to completion, and/or have a need to be in the medium term was below the threshold of 100 MW.
accelerated through concrete, identifiable actions. Of the 18 projects prioritized, nine require active
intervention, eight require light support and one is on
• PRIORITY PROJECTS REQUIRING LIGHT SUPPORT: the watchlist. Details on obstacles and recommended
projects in this category are considered to deliver actions for each project are provided in Section 5.
sufficient impact, enjoy the right timing vs. trade
needs, and face only minor obstacles/risk of delay to
completion.
Transmission substation at the 450 MW Azura-Edo power station in Nigeria. Photo: Harith General Partners
20 POWER AFRICA I TRANSMISSION ROADMAP TO 2030To prioritize transmission projects in this Transmission Roadmap, countries with a consistent surplus of
100MW+ (to allow for trade opportunities) in the period within scope were prioritized. We recognize,
however, that there will be opportunities to support other cross-border projects that are important to
countries’ economies, development and energy sector sustainability. For example, the Mbarara-Shango line
(Uganda to Rwanda), is a key project that could save Rwanda $1.3 million to $2 million per month in diesel in
2019-2020. This savings represents roughly 15% of the Rwandan utility’s monthly spend on energy – a huge
amount considering the utility is heavily subsidized by the state (roughly 1.4% of GDP). The infrastructure
is nearing full completion and Uganda and Rwanda are prioritizing the project. The framework and the
agreements, structures and technical preparations needed for the project will also be instrumental for future
cross-border lines for Rwanda and in the region, so its importance goes beyond the 40 MW or so that
Rwanda would use it to import in the short term.
EXHIBIT 9
EAST AFRICA PRIORITY TRANSMISSION PROJECTS
NOTE: the lines represented are
illustrative and do not reflect the
actual delineations
POWER AFRICA I TRANSMISSION ROADMAP TO 2030 21EXHIBIT 11
SOUTHERN AFRICA PRIORITY TRANSMISSION PROJECTS
NOTE: the lines represented are
illustrative and do not reflect the
actual delineations
22 POWER AFRICA I TRANSMISSION ROADMAP TO 2030EXHIBIT 10
WEST AFRICA PRIORITY TRANSMISSION PROJECTS
NOTE: the lines represented are
illustrative and do not reflect the
actual delineations
ESTIMATED BENEFITS FOR imported power for its own expensive emergency power.
CONNECTED COUNTRIES And if Kenya wheels power through its network and does
not export its surplus, it could earn over $15 million. By
Cross-border connections offer significant the same token, West Africa stands to reap annual benefits
financial and non-financial benefits. Financial benefits from regional trade of up to $1.2 billion by 2025.
include power trade revenues for the exporters, savings Non-financial benefits derive from converting the amount
for the importers, and wheeling revenues for countries of power traded into residential connections. The power
that provide their transmission networks as conduits. For traded across the Ethiopia-Kenya-Tanzania transmission
example, the Ethiopia-Kenya-Tanzania transmission lines lines translates into several million connections, with
give Ethiopia the potential to earn over $200 million in a significant potential to improve livelihoods, and help
exports to Tanzania over the next four years. Tanzania businesses grow in a sustainable way.
would save up to $500 million by substituting cheap
POWER AFRICA I TRANSMISSION ROADMAP TO 2030 23Olkaria Geothermal Transmission Lines, Kenya. Photo: Carole Douglis, USAID 24 POWER AFRICA I TRANSMISSION ROADMAP TO 2030
2030

5 ROADMAP TO ACHIEVE 2030 OBJECTIVES
DEVELOPMENT PARTNER ENGAGEMENT AND MAIN ACTIVITIES
To ensure completion of the priority projects, Power Africa and our partners
need to address the bottlenecks through actions specific to each project.
Stakeholder coordination is a prerequisite to the execution of this Transmission
Roadmap. While development partners have made continuous efforts to
coordinate their support, better alignment around specific priority project
gaps could help accelerate execution and mobilize investment.
Various stakeholders are active in the transmission space                                    representative of the most significant financing and capacity
in sub-Saharan Africa, including national governments,                                       building activities in this space.
regional power pools (SAPP, WAPP, EAPP) and bilateral
and multilateral development partners (e.g., AFD, AfDB, AU,                                  The key areas of support (through technical assistance
European Investment Bank, KFW, the World Bank, and the                                       and financing) are covered; there is also strong interest
Governments of Norway and Sweden). This Transmission                                         from some development partners to enter or scale up
Roadmap aims to build off existing mechanisms in each                                        their support to regional transmission projects (e.g.,
power pool, the support of development partners, and                                         Commonwealth Development Corporation). On the
ongoing Africa-wide initiatives such as NEPAD’s continental                                  other hand, our analysis of obstacles for priority projects
transmission masterplan (currently under development).                                       points to potential gaps in the areas or the nature of the
Private sector support in cross-border transmission is still                                 support provided. These gaps include, for instance, technical
nascent and is therefore not covered in this section.7                                       assistance to ensure project commercial viability (e.g.,
                                                                                             capability building in negotiations or review of the technical
We mapped the major development partners involved                                            agreements), and institutional strengthening to help
in transmission (Table 1), breaking down the nature of                                       governments acknowledge the benefits of cross-border
their support into financial and technical assistance/                                       trade, when relevant.
capability building, and examining the project lifecycle
areas they support. This mapping is based on nearly 20
interviews conducted with development partners, and is
not exhaustive by any means. It can rather be considered as

7 PPPs in transmission are gaining traction, especially in blended finance, and could be
  considered to attract private investment, especially in cases where commercial viability
  is guaranteed

                                                                                      POWER AFRICA I TRANSMISSION ROADMAP TO 2030                             25
You can also read