Prey and habitat distribution are not enough to explain predator habitat selection: addressing intraspecific interactions, behavioural state and ...
←
→
Page content transcription
If your browser does not render page correctly, please read the page content below
Grenier-Potvin et al. Movement Ecology     (2021) 9:12
https://doi.org/10.1186/s40462-021-00250-0

 RESEARCH                                                                                                                                            Open Access

Prey and habitat distribution are not
enough to explain predator habitat
selection: addressing intraspecific
interactions, behavioural state and time
Alexis Grenier-Potvin1* , Jeanne Clermont1, Gilles Gauthier2 and Dominique Berteaux1*

  Abstract
  Background: Movements and habitat selection of predators shape ecological communities by determining the
  spatiotemporal distribution of predation risk. Although intraspecific interactions associated to territoriality and
  parental care are involved in predator habitat selection, few studies have addressed their effects simultaneously
  with those of prey and habitat distribution. Moreover, individuals require behavioural and temporal flexibility in
  their movement decisions to meet various motivations in a heterogeneous environment. To untangle the relative
  importance of ecological determinants of predator fine-scale habitat selection, we studied simultaneously several
  spatial, temporal, and behavioural predictors of habitat selection in territorial arctic foxes (Vulpes lagopus) living
  within a Greater snow goose (Anser caerulescens atlantica) colony during the reproductive season.
  Methods: Using GPS locations collected at 4-min intervals and behavioural state classification (active and resting),
  we quantified how foxes modulate state-specific habitat selection in response to territory edges, den proximity,
  prey distribution, and habitats. We also assessed whether foxes varied their habitat selection in response to an
  important phenological transition marked by decreasing prey availability (goose egg hatching) and decreasing den
  dependency (emancipation of cubs).
  Results: Multiple factors simultaneously played a key role in driving habitat selection, and their relative strength
  differed with respect to the behavioural state and study period. Foxes avoided territory edges, and reproductive
  individuals selected den proximity before the phenological transition. Higher goose nest density was selected when
  foxes were active but avoided when resting, and was less selected after egg hatching. Selection for tundra habitats
  also varied through the summer, but effects were not consistent.
  (Continued on next page)

* Correspondence: alexis.grenier-potvin@uqar.ca;
dominique_berteaux@uqar.ca
1
 Chaire de recherche du Canada en biodiversité nordique and Centre
d’Études Nordiques, Université du Québec à Rimouski, 300 Allée des
Ursulines, Rimouski, Québec G5L 3A1, Canada
Full list of author information is available at the end of the article

                                         © The Author(s). 2021 Open Access This article is licensed under a Creative Commons Attribution 4.0 International License,
                                         which permits use, sharing, adaptation, distribution and reproduction in any medium or format, as long as you give
                                         appropriate credit to the original author(s) and the source, provide a link to the Creative Commons licence, and indicate if
                                         changes were made. The images or other third party material in this article are included in the article's Creative Commons
                                         licence, unless indicated otherwise in a credit line to the material. If material is not included in the article's Creative Commons
                                         licence and your intended use is not permitted by statutory regulation or exceeds the permitted use, you will need to obtain
                                         permission directly from the copyright holder. To view a copy of this licence, visit http://creativecommons.org/licenses/by/4.0/.
                                         The Creative Commons Public Domain Dedication waiver (http://creativecommons.org/publicdomain/zero/1.0/) applies to the
                                         data made available in this article, unless otherwise stated in a credit line to the data.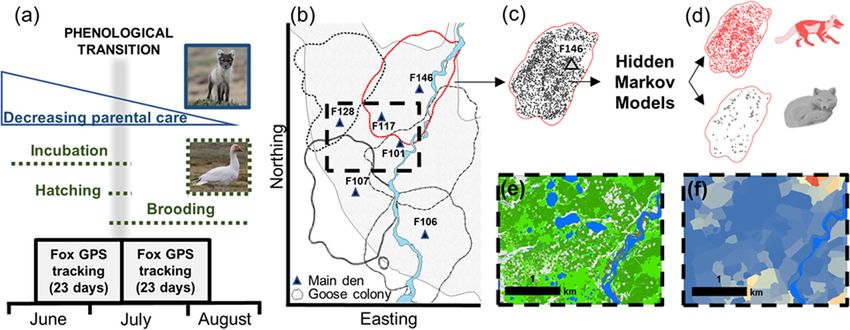
Grenier-Potvin et al. Movement Ecology   (2021) 9:12                                                              Page 2 of 13

 (Continued from previous page)
 Conclusions: We conclude that constraints imposed by intraspecific interactions can play, relative to prey
 distribution and habitat characteristics, an important role in the habitat selection of a keystone predator. Our results
 highlight the benefits of considering behavioural state and seasonal phenology when assessing the flexibility of
 predator habitat selection. Our findings indicate that considering intraspecific interactions is essential to understand
 predator space use, and suggest that using predator habitat selection to advance community ecology requires an
 explicit assessment of the social context in which movements occur.
 Keywords: Arctic tundra, Behavioural state, Movement, Predation risk, Resource selection, Predator-prey interactions,
 Spatial anchor, Territoriality, Vulpes lagopus

Background                                                       At a fine temporal scale, habitat selection varies with
Habitat selection by predators is a key process shaping        behavioural motivation [15]. For example, Suraci, Frank
ecological communities through predator-prey interac-          [16] showed that lions (Panthera leo) avoided risky habi-
tions. How predators use space generates predation risk        tats when resting, but selected them when feeding. Since
landscapes which impose costs to prey [1, 2]. At the in-       the behavioural state of the predator has a tremendous
dividual scale, movements are driven by the interactions       impact on the outcome of a predator-prey interaction
between intrinsic requirements and landscape hetero-           [17], state-specific habitat selection is required to gener-
geneity, which both fluctuate at various time scales [3].      ate relevant predation risk landscapes. For example, the
Individuals may adjust their behavioural decisions (e.g.,      distributions of predators when they are active and rest-
foraging vs. other activities) to satisfy immediate needs,     ing likely contribute differently to the distributions of
while they can modulate space use to adjust to environ-        consumptive and non-consumptive interactions. At
mental [4] and internal constraints [5]. Consequently,         coarser temporal scales, temporal variation in extrinsic
multiple spatial and temporal factors are involved in the      (e.g., resource availability) and intrinsic (e.g., life history
decisions made by predators to select habitat, and thus        stage) drivers can also modify space use. For example,
also in the impacts of predators on prey.                      the constraints generated by a spatial anchor associated
  The distribution of resources, land cover types, and         to reproduction can be relaxed as young gain autonomy
landscape features have traditionally been used to pre-        and the presence of parents at the den or nest becomes
dict predator habitat selection and to assess predation        less critical [18]. Considering how habitat selection shifts
risk [6, 7]. This body of work is deeply nested in the         across time scales is an important dimension of habitat
optimal foraging [8] and ideal-free distribution theories      selection research [19].
[9], where a predator should maximize energy intake by           The arctic fox (Vulpes lagopus) is the main terrestrial
foraging where resources are most abundant, while              predator in the arctic tundra. It feeds on many prey spe-
minimizing foraging costs. However, constraints associ-        cies, with strong top-down effect in ecosystems [20].
ated to predator biology may violate a main assumption         Habitat use of foxes is driven by factors such as prey dis-
of those theories, stating that all habitat patches are        tribution (e.g., lemmings, goose eggs [20, 21];), foraging
equally available. For example, many predators defend a        efficiency [22], quality of denning habitats [23, 24], and
territory from conspecific intrusion, which can shape          territory location [25]. Habitat use and foraging strat-
their habitat use by causing differential use of territory     egies also vary seasonally according to fluctuating re-
edges and centre [10]. Many predators are also bound           sources and cub growth [21, 26]. Fox pairs attend a den
to a fixed location, such as a den or nest, associated to      and maintain a territory throughout the year, even when
reproduction or shelter [11]. Such spatial anchors gen-        reproduction fails [27]. While the biological importance
erate space-use patterns where a declining probability         of the den and territory to arctic fox is widely recog-
of using areas farther from the focal point is expected        nized, the influence of den and territory boundary loca-
[12]. The constraints imposed by intraspecific interac-        tions on habitat selection and the associated predation
tions such as territoriality and parental care likely gen-     risk landscape is poorly understood.
erate conflicts with the need to maximize resource               This study has two main objectives. First, we assessed
acquisition [13, 14]. Yet, surprisingly few predator habi-     the relative importance of territoriality and presence of a
tat selection studies, at least in territorial mammals,        spatial anchor in one hand, and prey and habitat distri-
have considered territorial competition and parental           bution in the other hand, to explain arctic fox habitat se-
care (hereafter grouped under “intraspecific interaction       lection. Specifically, we investigated selection within
constraints”) simultaneously with prey and habitat             summer territories in response to conspecific territory
distribution.                                                  proximity, den location, goose nest density, and tundra
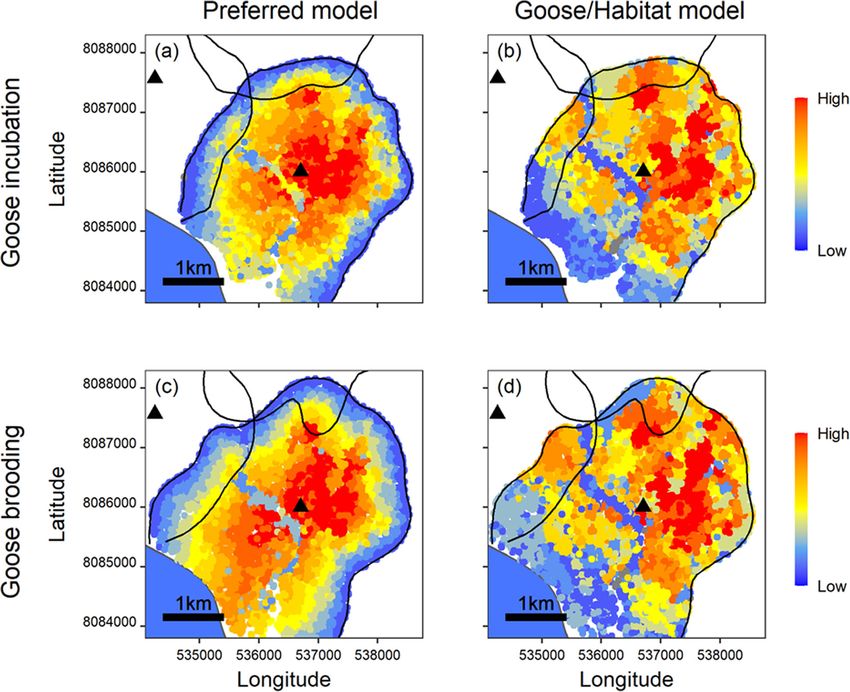
Grenier-Potvin et al. Movement Ecology        (2021) 9:12                                                                              Page 3 of 13

habitats. Second, we assessed the effects of behavioural                    in reproductive foxes as the summer unfolds (P4b). Fi-
state and temporal changes in prey availability and par-                    nally, we predicted that selection for high goose nest
ental investment on habitat selection. Specifically, we ex-                 density would decrease after the phenological transition
amined whether arctic fox habitat selection depends on                      (P5a), while avoidance of low-quality lemming habitats
whether they are active or resting, and the degree to                       and complex habitats would remain unchanged (P5b).
which habitat selection varies across two phenological
periods contrasted by prey availability (before and after                   Materials and methods
hatching of goose eggs) and dependence on a spatial an-                     Study design
chor (start versus end of parental care period at den).                     We followed five steps to investigate fox habitat selec-
  We generated multiple predictions, as detailed in Sup-                    tion (Fig. 1). First, we took advantage of natural tem-
porting Information S1, Tables S1.1 and S1.2. In sum-                       poral variations to identify an important phenological
mary, for our first objective, we predicted that distance                   transition (Fig. 1a). Specifically, we contrasted the goose
to territory edges (edges avoided by all foxes; P1a) and                    incubation period when goose eggs are highly accessible
distance to the den (den proximity selected by repro-                       to foxes, and when cubs mainly restrict their activity to
ductive foxes; P1b) explained arctic fox habitat selection,                 the immediate den area where they are milked, to the
for both behavioural states and study periods. Given that                   goose brooding period when goslings disperse and are
active foxes likely maximize prey intake, we further pre-                   less accessible, and when cubs are gradually weaned and
dicted that prey distribution and tundra habitats also ex-                  explore areas away from the den (Fig. 1a). The time
plained fox habitat selection (specifically, active foxes                   period in which goose egg density decreases thus aligns
should select high goose nest density (P2a), avoid low                      approximately with the time period in which parental
quality lemming habitats (P2b), and avoid complex habi-                     care to fox cubs strongly decreases. Second, we used
tats crisscrossed by water channels impeding hunting                        solar-powered GPS collars to track foxes living in adja-
(P2c)). For our second objective, given that the resting                    cent territories (Fig. 1b and c). Third, we identified with
state is associated to energy saving or parental care, we                   hidden Markov models the behavioural state (i.e., active
predicted that avoidance of territory edges (all foxes) as                  or resting) associated with each GPS location (Fig. 1d).
well as selection for den proximity (reproductive foxes)                    Fourth, we used high-resolution satellite data, detailed
would be stronger in resting than active foxes (P3a), and                   field surveys and fox GPS tracking to create a 0.5-m
that high goose nest density would be avoided by resting                    resolution geospatial platform which mapped tundra
foxes to decrease harassment (P3b). We also predicted                       habitat categories (Fig. 1e), goose nest density (Fig. 1f),
that territory edges should remain avoided through time                     territory edges and main den locations. Fifth, we quanti-
(P4a) but selection of den proximity should be relaxed                      fied with a resource selection function (RSF) framework

 Fig. 1 Study design used to assess arctic fox habitat selection drivers within the goose colony of Bylot Island. We used goose egg hatching and
 gradual emancipation of fox cubs as a phenological transition to assess temporal variations in fox habitat selection (a). We collected movement
 data during two periods from territorial foxes by tracking them with GPS collars. Territory edges were mapped by calculating a kernel utilization
 density for each individual while reproductive status and location of dens were assessed in the field (b five individual territories shown during
 goose incubation in 2019). We classified individual location data into active and resting behavioural states using hidden Markov models (c and d).
 Five habitat categories were identified in the study area from a satellite image (e) while goose nest density was mapped from field surveys (f)
Grenier-Potvin et al. Movement Ecology   (2021) 9:12                                                              Page 4 of 13

[28] the relative importance of predictors of fox habitat        allowed us to verify that individuals were territorial (e.g.,
selection for each behavioural state and period.                 Fig. 1b). All fox territories overlapped the goose colony.

                                                                 Arctic fox behavioural classification (step 3)
Study area and ecosystem (step 1)
                                                                 We used hidden Markov models (HMM) to classify fox
We worked on the southwest plain of Bylot Island (72°
                                                                 movements in two broad behavioural states [38] (Sup-
53′ N, 79° 54′ W), Sirmilik National Park, Nunavut,
                                                                 porting Information S3). We expected movement pat-
Canada. Vegetation is characterized primarily by mesic
                                                                 terns to include an active state (long step lengths and
tundra and high-center polygonal wetlands and second-
                                                                 directed travel) and a resting state (short step lengths
arily by xeric tundra, wet meadows, gravel beds, lakes
                                                                 and lots of turning), and set the model accordingly. The
and rivers [29]. Our 52 km2 study area overlaps a large
                                                                 variable “time of the day” was included as a covariate.
Greater snow goose colony and all fox locations were
                                                                 Separate models were built for goose incubation and
within 2 km of the colony boundaries (Supporting Infor-
                                                                 goose brooding periods. The HMMs confirmed our two
mation S2, Fig. S2.1). The colony aggregates > 20,000
                                                                 hypothetical behavioural states, namely active and rest-
goose nesting pairs [30] but goose nest density is hetero-
                                                                 ing, as detailed in Appendix S3, Tables S3.1 and S3.2.
geneous due to the patchy distributions of preferred wet-
                                                                 Although most resting steps likely represented resting
land habitats and snow-free patches when geese
                                                                 behaviours, they also probably included instances where
establish nesting sites in June [22]. After hatching, goose
                                                                 foxes were stationary but not resting.
families spatially disperse up to 30 km from the colony
so that goose density declines drastically in the study
                                                                 Georeferenced predictors (step 4)
area [31].
                                                                 Territory edges
  Goose eggs and goslings represent a major food source
                                                                 We used the Euclidian distance to the closest territory
for arctic foxes [23], which can consume them immedi-
                                                                 edges (determined in step 2) as a proxy of conspecific
ately or cache them in large quantities for later use [26].
                                                                 territory proximity. Territory edges formed by the sea
Geese incubate for 23 days [32] and 95% of nests hatch
                                                                 coast were excluded when extracting the closest territory
within ±5 days of the mean hatching date [33]. Goslings
                                                                 edges since they did not relate to intraspecific
are an easy prey for foxes but their vulnerability de-
                                                                 competition.
creases as they grow up. Collared lemmings (Dicrostonyx
groenlandicus) and especially brown lemmings (Lemmus
                                                                 Den locations
sibiricus) are major prey of arctic foxes [34]. Collared
                                                                 Fox dens were monitored yearly with camera traps,
lemmings occur mostly in mesic and xeric tundra and
                                                                 allowing identification of reproductive and non-
their density is relatively stable at low levels across years,
                                                                 reproductive individuals. For reproductive foxes, we con-
whereas brown lemmings occur mostly in heterogeneous
                                                                 sidered the natal den to be the main den. For non-
wetlands and mesic tundra and their population density
                                                                 reproductive foxes, we used monitoring data from 2003
peaks every 3–4 years [35]. In our study area, density of
                                                                 to 2019 to identify which den was historically most oc-
both species is low in wet meadows and gravel beds
                                                                 cupied by a reproductive pair, and identified this den as
[24]. Many species of waterfowl, shorebirds, and passer-
                                                                 the main territory den. The variable “den” was measured
ines nest at low density in the study area, where they
                                                                 as the Euclidian distance to the main den.
constitute incidental prey for foxes.
                                                                 Habitat categories
Arctic fox movements (step 2)                                    We used a 0.5-m resolution WorldView-2 satellite image
We captured adult foxes in May–July of 2018 and 2019,            dated July 2, 2018, to generate a habitat map of the study
following Tarroux, Berteaux [36], and equipped them              area following the hybrid object-based approach of
with solar-powered GPS collars (RadioTag-14, Milsar,             Chen, Pasher [39]. This supervised approach was ad-
Poland). The 24-h daylight of the summer Arctic                  equate given landscape heterogeneity at different spatial
allowed us to acquire high frequency (4-min intervals)           scales. Following validation and ground-truthing, we ob-
location data from May to late August.                           tained an overall accuracy of 98.6% for classifying water/
  To identify the home range of each fox during both             ice/snow from land (ntraining = 769; nvalidation = 369),
the goose incubation and the goose brooding periods              89.4% for classifying land cover classes (ntraining = 313;
(23-day period after hatching), we assessed the 95%              nvalidation = 134), and 93.3% for classifying polygonal wet-
utilization distribution with a kernel density estimator         lands from other landscape features (ntraining = 569; nvali-
using a subsample of 1-h interval data to minimize auto-         dation = 256). We merged these three classifications and
correlation [37]. Each fox home range was bordered by            used five habitat categories relevant to arctic foxes and
the home range of at least one tracked neighbour, which          their prey, namely mesic, wet meadows, complex
Grenier-Potvin et al. Movement Ecology (2021) 9:12 Page 5 of 13
wetlands, xeric, and gravel beds (Supporting Information are the associated regression coefficients. To satisfy the
S4, Table S4.1). RSF assumption that the whole territory was available at
every time interval [44], we retained only one GPS loca-
Goose survey tion every 20 min, as justified in Supporting Information
As a proxy of goose nest density, we mapped nesting S6. An interaction term between distance to the main
goose density in each fox territory through field surveys den and reproductive status was always included as we
conducted on foot during the goose incubation period expected the latter variable to affect den use. For all dis-
(Supporting Information S5, Table S5.1). The field sur- tance covariates, we considered a possible dampening ef-
vey involved walking the study area with the printed sat- fect by testing the fit of log-transformed distance relative
ellite colour image and mapping the contours of to the fit of raw distance values, and we retained the ap-
relatively homogeneous nesting goose patches, as propriate transformation for other analyses (Supporting
assessed by direct goose counts. Most geese that did not Information S7, Table S7.1). For each behavioural state
nest or failed gathered in dense groups that were not and study period, we built a list of candidate models
counted. Field mapping was facilitated by the abundance from the above predictors, ranging from the simplest
of landmarks (e.g., water bodies and rocks). The nesting models including only one predictor to complex models
goose count map was georeferenced in ArcGIS version including all predictors (10, 8, 8 and 6 models were
10.7 [40] to estimate patch area and to calculate nesting tested respectively for the fox active state during goose
goose density (geese/ha). To assess the accuracy of our incubation, the resting state during incubation, the active
map, we validated it with a field survey of random plots state during brooding, and the resting state during
where goose nests were systematically counted. We ob- brooding). For the active state during goose incubation,
tained a good correlation between nesting goose density we further assessed for an interaction between the com-
and nest density, and thus further refer to goose nest plex wetlands habitat and goose nest density, because
density (Supporting Information S5). Proportions of the Lecomte, Careau [22] showed that the structural com-
study area covered by goose density classes appear in plexity of wetlands decreases predation risk from foxes.
Supporting Information S5, Figures S5.1 (2018) and S5.2 We used AICc to select the most parsimonious model
(2019). [45] and results from models with ΔAICc < 4 were aver-
aged. Continuous variables were centred and standard-
Lemming distribution ized (mean = 0, SD = 1) to allow direct comparison
Surveying lemmings to map their distribution across our among parameter estimates [46]. We tested for multicol-
study area was not logistically possible. Our predictions linearity among covariates but retained all variables as r
related to lemmings therefore refer to the distribution of was always < 0.65 and the variance inflation factor < 10
their preferred habitats (lemming habitat preferences are [47]. We evaluated the fit of the most parsimonious
summarized in step 1) rather than to their density. models using a k-fold cross-validation with 75% of loca-
tions used as the training set and 25% as the testing set
Behaviour- and period-specific habitat selection (step 5) (n fold = 10) [48]. We report the averaged Spearman
We quantified arctic fox habitat selection for each behav- rank correlation ( r s ) resulting from 10 iterations. We
ioural state (active and resting) and study period (goose conducted all analyses in program R version 3.6.0 [49],
incubation and brooding) using four RSF based on a use- using lme4 to fit GLMMs [50].
available design at the scale of territories (third-order se-
lection sensu Johnson [41]). We evaluated the response to Results
distance to territory edges (meters), distance to the main Habitat selection was estimated for 8 arctic foxes (4
den (meters), goose nest density during incubation (geese/ males, 4 females) in 2018 and 13 arctic foxes (7 males, 6
ha), and tundra habitats (4-level categorical variable; mesic females) in 2019, which represented 14 different individ-
was the reference category), with individual as random uals. There were three non-reproductive foxes in both
factor (random intercept; Gillies, Hebblewhite [42]). GPS 2018 and 2019, while five foxes reproduced in 2018 and
locations were considered as used locations (coded as 1) 10 in 2019. Mean (± SD) territory size was 911 (± 167)
and five random locations were generated in the same ter- ha and 1030 (± 272) ha for the goose incubation and
ritory for each used location to characterize availability for brooding periods, respectively. More locations were clas-
each individual-year [43]. RSFs were estimated from sified as active than resting during both the goose incu-
mixed logistic regression using an exponential link: bation (49.1 ± 9.7% vs. 40.9 ± 9.1%) and brooding (51.8 ±
9.5% vs. 40.2 ± 9.8%) periods. Only a minority of loca-
ωðxÞ ¼ expðβ1x1 þ β2x2 þ … þ βxz Þ tions could not be assigned a behavioural state (Support-
ing Information S3, Table S3.2). After subsampling one
where x is a vector of z covariate values, and β1, β2, ..., βz location every 20 min, 21,619 and 15,619 classified GPSGrenier-Potvin et al. Movement Ecology (2021) 9:12 Page 6 of 13
locations were available for the RSF analyses for the S8, Table S8.1). Territory edges (avoided by all foxes; P1a
goose incubation and brooding periods, respectively. supported) and den proximity (selected by reproductive
foxes; P1b supported) affected habitat selection of both ac-
Relative importance of habitat selection predictors tive and resting foxes, but were less influential when foxes
We averaged two competitive models for the RSF of active were active (P3a supported) (Figs. 2 and 3, and S8.1). Terri-
foxes during goose incubation, whereas in all other analyses a tory edges were similarly avoided across study periods (P4a
single model was preferred (Table 1). Overall, all preferred supported; Fig. 3c and d). In reproductive foxes, selection
models had robust predictive power according to the k-fold for den proximity generally decreased as cubs gained in au-
cross validation (see r s values in Table 1). Models including var- tonomy (i.e., during the goose brooding period), and even
iables reflecting intraspecific interaction constraints (i.e., distance became negative when foxes were resting (P4b supported;
to territory edges and distance to the main den) always outper- Fig. 3e-h).
formed simpler models (Table 1). Still, models including only During the goose incubation period, foxes selected
goose nest density and habitat yielded moderate to good pre- high goose nest density when active (P2a supported), but
dictive power (Table 1). Contrasting visually spatial predictions avoided it when resting (P3b supported; Fig. 3a and b).
from the preferred model with those from the model including When active, the strength of selection for high goose
only prey and habitat revealed that omitting intraspecific inter- nest density decreased from the incubation to the brood-
action constraints had strong impacts on predicted predator ing period (P5a supported; Fig. 3a and b). Selection of
distribution (Fig. 2 and S8.1). Among all predictors considered, various tundra habitats by foxes was more complex than
territory edges had the strongest and most constant (i.e., param- predicted (Fig. 4). When active during the incubation
eter estimates similar across behavioural states and study pe- period, foxes avoided gravel beds and wet meadows
riods) effect on habitat selection of arctic foxes (Supporting (both low-quality lemming habitats), showed no re-
Information S8, Table S8.1). Tables S8.2, S8.3 and S8.4 show sponse to xeric habitats (another low-quality lemming
mean values of used and available locations for distance to edge, habitat; P2b partially supported) and avoided complex
distance to den and goose nest density. wetlands (P2c supported). Across study periods, active
foxes maintained a constant relation with xeric habitats
Habitat selection across behavioural states and summer (neutral selection) and gravel beds (avoidance), but
phenology shifted from avoidance to neutral selection regarding
Habitat selection of arctic foxes clearly shifted among be- wet meadows and complex wetlands (P5b partially sup-
havioural states and study periods (Supporting Information ported) (Fig. 4).
Table 1 Comparison between preferred models (ΔAICc < 4) and simpler models including only habitats and goose nest density, for
arctic fox resource selection functions (RSF). Models are presented for two fox behavioural states and two study periods. Note that
no prediction was made regarding goose nest density for foxes resting during goose brooding (Table S1.2). Habitat selection
predictors are as follows: distance to territory edges (Edge), distance to the main den (Den), goose nest density (Geese), tundra
habitats (Habitat), and reproductive status (Repro)
Model k -LL ΔAICc wi rs
(a) Fox active / Goose incubation
Edge + Den X Repro + Habitat + Geese X Habitat (Complex wetlands) 12 28,529.79 0.00 0.54 0.93 ± 0.02
Edge + Den X Repro + Habitat + Geese 11 28,530.95 0.32 0.46 0.93 ± 0.03
Habitat + Geese 7 29,131.90 1194.22 < 0.001 0.73 ± 0.08
(b) Fox resting / Goose incubation
Edge + Den X Repro + Habitat + Geese 11 22,638.61 0.00 > 0.99 0.86 ± 0.04
Habitat + Geese 7 25,248.15 5211.07 < 0.001 0.76 ± 0.07
(c) Fox active / Goose brooding
Edge + Den X Repro + Habitat + Geese 11 22,476.11 0.00 > 0.99 0.80 ± 0.07
Habitat + Geese 7 22,986.99 1013.75 < 0.001 0.57 ± 0.18
(d) Fox resting / Goose brooding
Edge + Den X Repro + Habitat 10 16,630.88 0.00 > 0.99 0.97 ± 0.02
Habitat 6 18,139.79 3009.82 < 0.001 0.76 ± 0.08
k Number of parameters, −LL Negative log-likelihood, ΔAICc Difference in AICc compared to the most parsimonious model, wi AICc Weight of evidence, r s Mean k-
fold cross validation correlation coefficient ± SDGrenier-Potvin et al. Movement Ecology (2021) 9:12 Page 7 of 13 Fig. 2 Maps showing the relative probability of selection based on third-order resource selection function (RSF), for one reproductive male arctic fox during its active state in 2019, in the snow goose colony of Bylot Island. Relative probabilities of selection are estimated with the preferred model (left column), which always includes distance to territory edges and distance to the main den, and with the model including only goose and habitat variables (right column). Territory edges of two neighbouring males are shown. The top row shows predicted relative probabilities for the goose incubation period, while the bottom row concerns the goose brooding period. Maps generated for the same fox during its resting behavioural state are presented in Supporting Information S8, Figure S8.1. Relative probabilities of selection from low to high are specific to each map, so colours should not be compared among maps. Black triangles represent main den locations Discussion with models that incorporate them, as illustrated by a Unfolding fine-scale habitat selection is critical to reveal close examination of the left and right panels in Fig. 2 the complexity of predator behaviours, and ultimately and Fig. S8.1, and as supported in Table 1 by the always how they impact their prey. Habitat selection requires higher r s values of models including intraspecific inter- individuals to make numerous decisions to cope effect- actions. Specifically, distance to territory edges, reflecting ively with a wide variety of internal and external factors, territorial interactions with competitors, and distance to often involving trade-offs between individual needs and the den, reflecting a spatial anchor caused by parental environmental heterogeneity. Our results emphasize the care, were key factors influencing fox habitat selection. importance of explicitly considering intraspecific interac- However, prey and habitat distribution also partly ex- tions, behavioural state and temporal variation in envir- plained the fine-scale distribution of arctic foxes. In onmental features encountered by a predator. More addition, habitat selection differed according to whether importantly, we show that omitting constraints imposed foxes were active or resting, likely reflecting tactics to by intraspecific interactions yields notably different and maximize energy intake or minimize energy expendi- potentially misleading predator distribution compared tures. We also found that decreasing goose egg
Grenier-Potvin et al. Movement Ecology (2021) 9:12 Page 8 of 13
Fig. 3 Predicted relative probability of selection (±95% CI) of arctic foxes as a function of nesting goose density (a proxy of nest density (a and
b)), distance to territory edges (c and d), and distance to the main den (e-h), for two periods and two behavioural states identified by animal
silhouettes. Predictions are derived from the parameter estimates of the preferred models in Table 1. The y and x axes differ between plots. No
prediction was made regarding goose nest density for foxes resting during goose brooding (Table S1.2)
availability and cub dependence resulted in temporal the similar importance of parental care and prey avail-
shifts in habitat selection. ability, potentially because ensuring pup survival is crit-
ical for a relatively short lived species not reproducing
The hierarchy of predator habitat selection within the every year. However, because the most limiting factors
territory should affect habitat selection at large spatiotemporal
Since animals should prioritise decisions affecting fitness scales rather than at fine scales [19], care is needed when
[51], untangling the various predictors of habitat selec- inferring the potential fitness consequences of predictors
tion should inform about their hierarchy within habitat of habitat selection from a hierarchy determined at a sin-
selection decision rules, and thus ultimately about the gle spatiotemporal scale.
factors most important to individual fitness [8]. For in-
stance, during the goose incubation period, avoidance of The role of intraspecific interactions
territory edges had the strongest effect on habitat selec- It may seem counterintuitive that a territorial animal
tion in active reproductive foxes, while proximity to den would avoid its territory borders, since the territory must
and prey availability played similar, secondary roles. This be defended against conspecific intrusion. After consid-
leads to the hypothesis that negative conspecific encoun- ering potential confounding effects of prey distribution,
ters could more strongly impact survival or reproductive den proximity, and territory edge proximity, we showed
success than suboptimal choice of prey patches or sub- that avoidance of territory borders was a major deter-
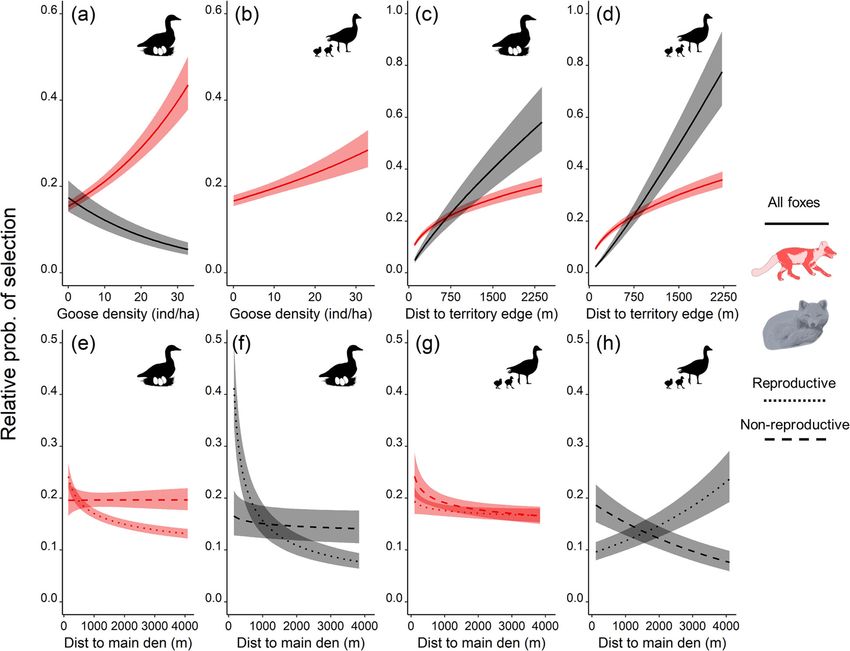
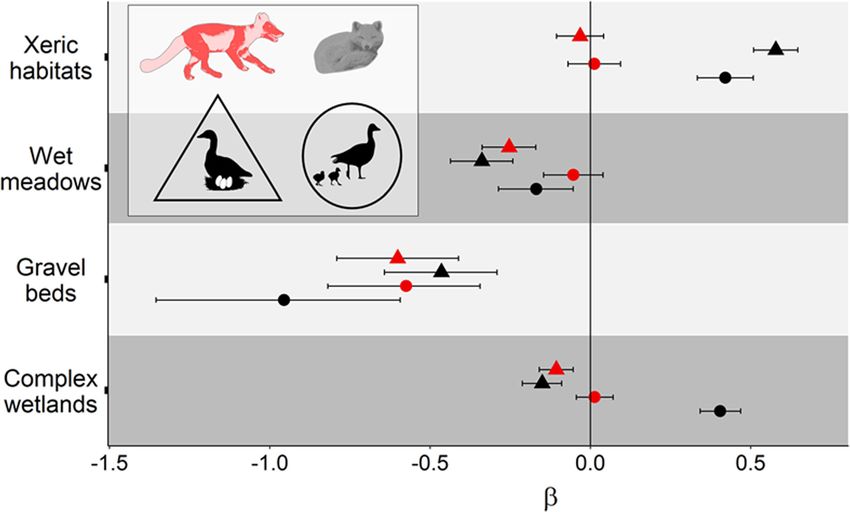
optimal parental care. Interestingly, this also highlights minant of habitat selection. To explain that someGrenier-Potvin et al. Movement Ecology (2021) 9:12 Page 9 of 13 Fig. 4 Standardized parameter estimates of tundra habitats (β ± 95% CI) from resource selection function analyses conducted on arctic foxes. Parameter estimates from the preferred models in Table 1 are presented for two periods identified by symbol shapes and two behavioural states identified by symbol colors (see animal silhouettes). Selection and avoidance are represented by positive and negative values along the x-axis, respectively. For clarity, parameter estimates and CI are shown on the logit scale (as estimated by logistic regression) territorial primates avoid home range periphery, Wrang- also be related to its foraging strategy. Indeed, arctic ham, Crofoot [52] proposed the “Risk hypothesis” where foxes cache large quantities of goose eggs [26], and ac- the higher perceived risk of lethal encounters with quiring and storing them far from territory edges could neighbouring groups at edges should alone generate decrease pilfering by neighbours [56]. This mechanism spatial avoidance. Such risk of physical aggression during might reinforce edges avoidance by active foxes. a neighbour encounter also applies to canids [53, 54]. The selection of den proximity by reproductive foxes For example, Schlägel, Merrill [13] reported an avoid- confirms that parental care generates a spatial anchor ance of territory edges in the gray wolf (Canis lupus) during the cub raising season, when young depend on and suggested this behaviour was associated with the in- their parents for food and thermal protection. This is creasing intraspecific mortality associated to proximity also supported by the fact that non-reproductive foxes of neighbouring pack territories [53]. respond neutrally to den location. When cubs gained en- In arctic foxes, defending one’s territory while minim- ergetic independence, reproductive foxes stopped select- izing the costs of conspecific interactions at edges may ing den proximity when active and even avoided it when be done in two ways, one involving olfaction and the resting, indicating a gradual fading of the spatial anchor other audition. First, scent marking at territory edges at that time. provides neighbours with long-lasting cues of territory ownership, without requiring frequent visits to edges. The role of prey and habitat Second, arctic foxes of both sexes frequently bark and The selection by active foxes of high goose nest density, this can be heard over large distances, providing long- and the avoidance of most low-quality lemming habitats distance cues of territory ownership [55]. Also, resting fit the optimal foraging theory since such habitat selec- foxes avoided territory edges more than did active foxes, tion likely increased prey encounters, and thus energy suggesting that resting foxes minimized the potential gained per unit of effort. Interestingly, selection of high costs of surprise encounters with neighbours. The avoid- goose nest density decreased but was still maintained ance of territory edges by a territorial predator could after goose egg hatching. This could be explained by a
Grenier-Potvin et al. Movement Ecology   (2021) 9:12                                                            Page 10 of 13

habitat selection delay associated to hoarding behaviour         of predator habitat selection. Technological progress
and the recovery of unhatched eggs [21], and highlights          now allows intensification of tracking schedules, opening
a spatial ghost effect of the pulsed resource [57]. Given        the door to increasing consideration of the many pheno-
that the distribution of active goose nests affects the dis-     logical transitions characterizing habitats, resources, and
tribution of predation risk on other prey species [20],          individual states [63].
this ghost effect might include biased predation risk well
after the goose nesting period. Such indirect and delayed
community interactions between prey sharing a com-               From habitat selection to community ecology
mon predator warrant further investigations.                     The existence of predator-mediated interactions between
   While the overall response to tundra habitats of active       main and incidental prey is a central hypothesis explain-
foxes likely reflected their need to collect food efficiently,   ing community structure in the arctic tundra [34]. This
temporal variations in habitat selection suggest complex         hypothesis involves both apparent competition, whereby
relationships between predator movements and habitats.           one prey negatively impacts another prey through its in-
Although some poor lemming habitats (gravel beds)                fluence on a shared predator [64], and apparent mutual-
were always strongly avoided, other poor lemming habi-           ism, whereby a focal prey reduces predation rate on an
tats (wet meadows) or habitats where movements are               alternative prey because of predator saturation or select-
difficult (complex wetlands; Lecomte, Careau [22]) were          ivity [65]. Arctic foxes are often hypothesized to be the
only avoided before goose egg hatching. These temporal           shared enemy linking the demography and spatial distri-
switches suggest that decisions regarding tundra habitats        bution of small tundra vertebrates [66], but mechanisms
were mediated by goose egg availability and (or) den de-         at play remain obscure or untested. Here we resolve
pendency, although mechanisms at play are unclear.               some of these missing mechanisms.
One hypothesis is that broadening their selection of hab-           Our demonstration that active arctic foxes select high
itats allowed foxes to increase the probability of encoun-       goose nest density can explain the observations of
tering prey once the pulse of goose eggs had vanished            McKinnon, Berteaux [20], who showed that predation
and the dependence to a central place was relaxed. The-          rate of artificial bird nests increased with goose density.
ory predicts that generalist predators should use flexible       Avoidance of gravel beds and wet meadows by arctic
strategies when facing decreasing availability of the most       foxes shows that these low-quality lemming habitats
profitable prey [58]. This could be done by using less           may provide refuges against fox predation for other spe-
profitable prey [59] or by switching from a maximization         cies, which can explain why Léandri-Breton and Bêty
of success rate tactic to a maximization of encounter            [67] and Smith, Gilchrist [68] found that survival prob-
rate tactic [60]. Stickney [56] demonstrated the foraging        ability of shorebird nests was higher in those habitats.
benefits of habitat selection switching when arctic foxes        Similarly, the avoidance of complex wetlands by arctic
in Alaska faced a changing availability of prey.                 foxes supports the suggestion of Lecomte, Careau [22]
                                                                 that presence of numerous water channels in this habitat
The role of behavioural state and time                           hampers fox movement and accounts for the higher sur-
The switch from avoidance of high goose nest density             vival of goose nests in complex wetlands than in mesic
when resting (likely to minimize harassment risk from a          habitats.
large prey) to positive selection when active (likely to            Constraints imposed by intraspecific interactions can
maximize prey intake) supports the idea that animals re-         also generate spatial variation in predation risk. For ex-
quire different habitats in response to varying needs and        ample, central-place foraging in African crowned eagle
motivations [44]. As reported for other predators [15,           (Stepahnoaetus coronatus; Shultz and Noë [69]) and ter-
61], considering behavioural state thus greatly helped to        ritoriality in grey wolf (Lewis and Murray [70]) affected
understand behavioural mechanisms generating fox                 the distribution of predation risk. Therefore, we expect
habitat selection, and in turn also helped to gain insight       the social system of arctic foxes to also generate spatial
on “why” animals use particular habitats [62].                   biases in predation risk in the tundra. This hypothesis
   Partitioning habitat selection among time periods re-         could be tested experimentally in our study system by
vealed the temporal flexibility in space use and foraging        monitoring the fate of baits distributed in various parts
strategies by an active hunting predator, likely a result of     of fox territories. As predator biology interacts with the
the quickly changing benefits and costs of selecting par-        landscape to generate patterns of predation risk [71],
ticular habitat features. Our study highlights that using        our understanding of top-down trophic interactions will
temporal environmental variations (sudden changes in             greatly benefit from increased knowledge of the interac-
prey availability) or temporal within-individual variations      tions between territoriality, spatial anchors, habitat and
(change in parental investment) to explain space use             prey distribution, and behavioural state in generating
helps progressing towards a mechanistic understanding            spatial patterns of predation risk.
Grenier-Potvin et al. Movement Ecology (2021) 9:12 Page 11 of 13
Conclusions Funding
This study contributes to better understanding the eco- This study was supported by (alphabetical order) Canada Foundation for
Innovation, Canada Research Chairs Program, Fonds de recherche du
logical determinants of fine-scale habitat selection and Québec - Nature et technologies, Natural Sciences and Engineering Research
its spatial and temporal dynamics. Our results suggest Council of Canada (NSERC), Network of Centers of Excellence of Canada
that only an integrative assessment of both intraspecific ArcticNet, Northern Scientific Training Program (Polar Knowledge Canada)
and Polar Continental Shelf Program (Natural Resources Canada).
interactions and prey-related predictors allows to under-
stand why territorial predators select or avoid particular Availability of data and materials
locations. We therefore recommend that further studies GPS data are available in MoveBank study1241071371. (https://www.
movebank.org/cms/webapp?gwt_fragment=page=studies,path=study1241
on habitat selection of predators, particularly those with 071371).
elaborate social relations, should consider explicitly in-
traspecific interactions. Declarations
Our results further suggest that fox motivations re-
Ethics approval
garding habitat selection strongly depend on both behav- Capture techniques and immobilization procedures were approved by the
ioural state and important temporal changes occurring UQAR Animal Care Committee (CPA-64-16-169 R2) and field research by the
in the ecosystem. Even though the dynamic nature of Joint Park Management Committee of Sirmilik National Park of Canada (SIR-
2018-8021).
habitat selection is well recognized, it is still too rarely
integrated in movement ecology studies, leading to po- Consent for publication
tential noise, or even bias, when predicting animal distri- Not applicable.
bution. Robust predictions of predator distribution are Competing interests
important when evaluating predation risk distribution or The authors declare that they have no competing interests.
managing predators.
Author details
An integrative approach and a dynamic assessment of 1
Chaire de recherche du Canada en biodiversité nordique and Centre
predator habitat selection are critical to advance our d’Études Nordiques, Université du Québec à Rimouski, 300 Allée des
comprehension of predator-mediated processes shaping Ursulines, Rimouski, Québec G5L 3A1, Canada. 2Département de biologie
and Centre d’études nordiques, Université Laval, 2325 Rue de l’Université,
the structure and functioning of communities. For ex- Québec, Québec G1V 0A6, Canada.
ample, our results provide new insights into habitat se-
lection by arctic foxes, a key tundra predator all over its Received: 24 November 2020 Accepted: 1 March 2021
circumpolar distribution. They provide a strong founda-
tion to assess the effects of fox habitat selection on nest- References
ing bird distribution. More generally, our approach 1. Fortin D, Beyer HL, Boyce MS, Smith DW, Duchesne T, Mao JS. Wolves
should provide new insights into how predator move- influence elk movements: behavior shapes a trophic cascade in Yellowstone
National Park. Ecology. 2005;86(5):1320–30.
ment ecology drives spatiotemporal patterns in prey 2. Rizzari JR, Frisch AJ, Hoey AS, McCormick MI. Not worth the risk: Apex
distribution. predators suppress herbivory on coral reefs. Oikos. 2014;123(7):829–36.
3. Nathan R, Getz WM, Revilla E, Holyoak M, Kadmon R, Saltz D, et al. A
movement ecology paradigm for unifying organismal movement research.
Abbreviations
Proc Natl Acad Sci. 2008;105(49):19052–9.
AICc: Akaike information criterion corrected for small sample sizes;
4. Squires JR, Decesare NJ, Kolbe JA, Ruggiero LF. Seasonal resource selection
GPS: Global Positioning System; HMM: Hidden Markov Model; RSF: Resource
of Canada lynx in managed forests of the northern Rocky Mountains. J Wildl
Selection Function
Manag. 2010;74(8):1648–60.
5. Martin J, van Moorter B, Revilla E, Blanchard P, Dray S, Quenette PY, et al.
Reciprocal modulation of internal and external factors determines individual
Supplementary Information movements. J Anim Ecol. 2013;82(2):290–300.
The online version contains supplementary material available at https://doi. 6. Hebblewhite M, Merrill EH, McDonald TL. Spatial decomposition of
org/10.1186/s40462-021-00250-0. predation risk using resource selection functions: an example in a wolf-elk
predator-prey system. Oikos. 2005;111(1):101–11.
Additional file 1. 7. Courbin N, Fortin D, Dussault C, Fargeot V, Courtois R. Multi-trophic
resource selection function enlightens the behavioural game between
wolves and their prey. J Anim Ecol. 2013;82(5):1062–71.
8. Stephens DW, Krebs JR. Foraging theory. Princeton: Princeton University
Acknowledgements
Press; 1986. p. 247.
We thank M.-P. Poulin, R. Gravel, C. Chevallier, and G. Roy for their field work
9. Fretwell S, Lucas H. On territorial behavior and other factors influencing
and Parks Canada and the community of Mittimatalik for their support. We
habitat distribution in birds. Acta Biotheor. 1969;19(1):16–36.
thank N. Courbin and two anonymous reviewers for valuable comments on
10. Brown JL, Orians GH. Spacing patterns in mobile animals. Annu Rev Ecol
earlier versions of this manuscript.
Syst. 1970;1:239–62.
11. Orians GH, Pearson NE. On the theory of central place foraging. In: Horn DJ,
Authors’ contributions Staris GR, Mitchell RD, editors. Analysis of ecological systems. Columbus:
A.G-P. and D.B. conceived the ideas and designed the methodology, with Ohio State University Press; 1979. p. 155–77.
significant contributions from J.C. and G.G.; A.G-P., D.B. and J.C. organized 12. Schoener TW. Generality of the size-distance relation in models of optimal
data collection; A.G-P. conducted the statistical analyses; A.G-P. and D. B feeding. Am Nat. 1979;114(6):902–14.
wrote the manuscript; All authors contributed to and approved the 13. Schlägel UE, Merrill EH, Lewis MA. Territory surveillance and prey management:
publication. wolves keep track of space and time. Ecol Evol. 2017;7(20):8388–405.Grenier-Potvin et al. Movement Ecology (2021) 9:12 Page 12 of 13
14. Bakker ES, Reiffers RC, Olff H, Gleichman JM. Experimental manipulation of 40. ESRI. Arcgis desktop 10.7. Version 10.7 ed. Redlands: Environmental Systems
predation risk and food quality: effect on grazing behaviour in a central- Research Institute; 2019.
place foraging herbivore. Oecologia. 2005;146(1):157–67. 41. Johnson DH. The comparison of usage and availability measurements for
15. Abrahms B, Jordan NR, Golabek KA, McNutt JW, Wilson AM, Brashares JS. evaluating resource preference. Ecology. 1980;61(1):65–71.
Lessons from integrating behaviour and resource selection: activity-specific 42. Gillies CS, Hebblewhite M, Nielsen SE, Krawchuk MA, Aldridge CL, Frair JL,
responses of African wild dogs to roads. Anim Conserv. 2016;19(3):247–55. et al. Application of random effects to the study of resource selection by
16. Suraci JP, Frank LG, Oriol-Cotterill A, Ekwanga S, Williams TM, Wilmers CC. animals. J Anim Ecol. 2006;75(4):887–98.
Behavior-specific habitat selection by African lions may promote their 43. Northrup JM, Hooten MB, Anderson CR, Wittemyer G. Practical guidance on
persistence in a human-dominated landscape. Ecology. 2019;100(4):11. characterizing availability in resource selection functions under a use–
17. Courbin N, Loveridge AJ, Fritz H, Macdonald DW, Patin R, Valeix M, et al. availability design. Ecology. 2013;94(7):1456–63.
Zebra diel migrations reduce encounter risk with lions at night. J Anim Ecol. 44. Beyer HL, Haydon DT, Morales JM, Frair JL, Hebblewhite M, Mitchell M, et al.
2019;88(1):92–101. The interpretation of habitat preference metrics under use-availability
18. Studd EK, Boutin S, McAdam AG, Humphries MM. Nest attendance of designs. Philos Trans Biol Sci. 2010;365(1550):2245–54.
lactating red squirrels (tamiasciurus hudsonicus): influences of biological and 45. Burnham KP, Anderson DR. Model selection and multi-model inference: a
environmental correlates. J Mammal. 2016;97(3):806–14. practical information-theoretic approach, vol. xxvi. 2nd ed. New York:
19. Rettie WJ, Messier F. Hierarchical habitat selection by woodland caribou: its Springer; 2002. p. 488.
relationship to limiting factors. Ecography. 2000;23(4):466–78. 46. Schielzeth H. Simple means to improve the interpretability of regression
20. McKinnon L, Berteaux D, Gauthier G, Bêty J. Predator-mediated interactions coefficients. Methods Ecol Evol. 2010;1(2):103–13.
between preferred, alternative and incidental prey in the arctic tundra. 47. Dormann CF, Elith J, Bacher S, Buchmann C, Carl G, Carré G, et al.
Oikos. 2013;122(7):1042–8. Collinearity: a review of methods to deal with it and a simulation study
21. Jepsen JU, Eide NE, Prestrud P, Jacobsen LB. The importance of prey evaluating their performance. Ecography. 2013;36(1):27–46.
distribution in habitat use by arctic foxes (Alopex lagopus). Can J Zool. 2002; 48. Boyce MS, Vernier PR, Nielsen SE, Schmiegelow FKA. Evaluating resource
80(3):418–29. selection functions. Ecol Model. 2002;157(2–3):281–300.
22. Lecomte N, Careau V, Gauthier G, Giroux J-F. Predator behaviour and predation 49. R Development Core Team. R, a language and environment for statistical
risk in the heterogeneous Arctic environment. J Anim Ecol. 2008;77(3):439–47. computing. Vienna: R Foundation for Statistical; 2019.
23. Giroux M-A, Berteaux D, Lecomte N, Gauthier G, Szor G, Bêty J. Benefiting 50. Bates D, Mächler M, Bolker B, Walker S. Fitting linear mixed-effects models
froma migratory prey: Spatio-temporal patterns in allochthonous using “lme4”. J Stat Softw. 2015;67(1):1–48.
subsidization ofan arctic predator. J Anim Ecol. 2012;81(3):533–42. 51. Southwood TRE. Habitat, the templet for ecological strategies? J Anim Ecol.
24. Szor G, Berteaux D, Gauthier G. Finding the right home: distribution of food 1977;46(2):337–65.
resources and terrain characteristics influence selection of denning sites and 52. Wrangham R, Crofoot M, Lundy R, Gilby I. Use of overlap zones among group-
reproductive dens in arctic foxes. Polar Biol. 2007;31(3):351–62. living primates: a test of the risk hypothesis. Behaviour. 2007;144:1599–619.
25. Angerbjörn A, Hersteinsson P, Tannerfeldt M. Consequences of resource 53. Mech LD. Buffer zones of territories of gray wolves as regions of
predictability in the arctic fox: two life history strategies. In: MacDonald DW, intraspecific strife. J Mammal. 1994;75(1):199–202.
Silliero-Zubiri C, editors. The biology and conservation of wild canids. 54. White PCL, Harris S. Encounters between red foxes (Vulpes vulpes):
Oxford: Oxford University Press; 2004. p. 163–72. implications for territory maintenance, social cohesion and dispersal. J Anim
26. Careau V, Lecomte N, Bêty J, Giroux J-F, Gauthier G, Berteaux D. Hoarding of Ecol. 1994;63(2):315–27.
pulsed resources: temporal variations in egg-caching by arctic fox. 55. Frommolt K-H, Goltsman ME, Macdonald DW. Barking foxes, Alopex lagopus:
Écoscience. 2008;15(2):268–76. field experiments in individual recognition in a territorial mammal. Anim
27. Prestrud P. Denning and home-range characteristics of breeding arctic Behav. 2003;65(3):509–18.
foxes in Svalbard. Can J Zool. 1992;70(7):1276–83. 56. Stickney A. Seasonal patterns of prey availability and the foraging behavior
28. Manly BFJ, McDonald LL, Thomas DL, McDonald TL, Erickson WP. Resource of arctic foxes (Alopex lagopus) in a waterfowl nesting area. Can J Zool.
selection by animals: statistical design and analysis for field studies. 2nd ed. 1991;69(11):2853–9.
Dordrecht: Kluwer Academic Publishers; 2002. p. 221. 57. Yang LH, Bastow JL, Spence KO, Wright AN. What can we learn from
29. Duclos I, Lévesque E, Gratton D, Bordelau PA. Vegetation mapping of Bylot resource pulses? Ecology. 2008;89(3):621–34.
island and Sirmilik National Park: final report. Iqaluit. Unpublished report: 58. Charnov EL. Optimal foraging, the marginal value theorem. Theor Popul
Parks Canada; 2006. p. 101. Biol. 1976;9(2):129–36.
30. Reed A, Hughes RJ, Boyd H. Patterns of distribution and abundance of 59. MacArthur RH, Pianka ER. On optimal use of a patchy environment. Am Nat.
greater snow geese on Bylot island, Nunavut, Canada 1983–1998. Wildfowl. 1966;100(916):603–9.
2002;53:53–65. 60. Rayl ND, Bastille-Rousseau G, Organ JF, Mumma MA, Mahoney SP, Soulliere
31. Mainguy J, Gauthier G, Giroux JF, Duclos I. Habitat use and behaviour of CE, et al. Spatiotemporal heterogeneity in prey abundance and vulnerability
greater snow geese during movements from nesting to brood-rearing shapes the foraging tactics of an omnivore. J Anim Ecol. 2018;87(3):874–87.
areas. Can J Zool. 2006;84(8):1096–103. 61. Wilson RR, Gilbert-Norton L, Gese EM. Beyond use versus availability:
32. Poussart C, Larochelle J, Gauthier G. The thermal regime of eggs during behaviour-explicit resource selection. Wildl Biol. 2012;18(4):424–30.
laying and incubation in greater snow geese. Condor. 2000;102(2):292–300. 62. Gavin TA. Why ask “why”: the importance of evolutionary biology in wildlife
33. Lepage D, Gauthier G, Menu S. Reproductive consequences of egg-laying science. J Wildl Manag. 1991;55(4):760.
decisions in snow geese. J Anim Ecol. 2000;69(3):414–27. 63. Hefty KL, Stewart KM. Flexible resource use strategies of a central-place forager
34. Bety J, Gauthier G, Giroux J-F, Korpimaki E. Are goose nesting success and experiencing dynamic risk and opportunity. Mov Ecol. 2019;7(1):1–10.
lemming cycles linked? Interplay between nest density and predators. 64. Holt RD. Predation, apparent competition, and the structure of prey
Oikos. 2001;93(3):388–400. communities. Theor Popul Biol. 1977;12(2):197–229.
35. Fauteux D, Gauthier G, Berteaux D. Seasonal demography of a cyclic lemming 65. Abrams P, Matsuda H. Effects of adaptive predatory and anti-predator
population in the Canadian arctic. J Anim Ecol. 2015;84(5):1412–22. behaviour in a two-prey one-predator system. Evol Ecol. 2005;7:312–26.
36. Tarroux A, Berteaux D, Bêty J. Northern nomads: ability for extensive 66. Lamarre JF, Legagneux P, Gauthier G, Reed ET, Bety J. Predator-mediated
movements in adult arctic foxes. Polar Biol. 2010;33(8):1021–6. negative effects of overabundant snow geese on arctic-nesting shorebirds.
37. Fieberg J. Kernel density estimators of home range: smoothing and the Ecosphere. 2017;8(5):13.
autocorrelation red herring. Ecology. 2007;88(4):1059–66. 67. Léandri-Breton D-J, Bêty J. Vulnerability to predation may affect species
38. Michelot T, Langrock R, Patterson TA. Movehmm: an R package for the distribution: plovers with broader arctic breeding range nest in safer habitat.
statistical modelling of animal movement data using hidden Markov Sci Rep. 2020;10(1):1–8.
models. Methods Ecol Evol. 2016;7(11):1308–15. 68. Smith PA, Gilchrist HG, Smith JNM. Effects of nest habitat, food, and
39. Chen Z, Pasher J, Duffe J, Behnamian A. Mapping arctic coastal ecosystems parental behavior on shorebird nest success. Condor. 2007;109(1):15–31.
with high resolution optical satellite imagery using a hybrid classification 69. Shultz S, Noë R. The consequences of crowned eagle central-place foraging
approach. Can J Remote Sens. 2017;43(6):513–27. on predation risk in monkeys. Proc Biol Sci. 2002;269(1502):1797–802.You can also read