Product differentiation in video games: A closer look at Fortnite's success - Opus4
←
→
Page content transcription
If your browser does not render page correctly, please read the page content below

Product differentiation in video games:
             A closer look at Fortnite's success

                              Karl-Heinz Moritz
                               Timo Schöber
                             Georg Stadtmann

___________________________________________________________________

                European University Viadrina Frankfurt (Oder)
            Department of Business Administration and Economics
                         Discussion Paper No. 419
                                 June 2020

                              ISSN 1860 0921
___________________________________________________________________
Product differentiation in video games:
               A closer look at Fortnite’s success

        Karl-Heinz Moritz,a Timo Schöber,b Georg STADTMANNc∗

                                    June 1st , 2020

                                       Abstract
            Fortnite is the most successful video game in terms of revenues
        generated. Since it belongs to the ’free-to-play games’, the company
        has to optimize the in-game-shop to generate revenues. Product dif-
        ferentiation is one possibility to optimize the profitability of the game.
        In this paper, we use a microeconomic approach in order to highlight
        the implications of product differentiation for the profit maximization
        problem.

  Keywords: Fortnite, gaming, Freemium, product differentiation,
market segmentation

   a
        Karl-Heinz Moritz, Erfurt University.

   b
        Timo Schöber, European University Viadrina.

   c∗
      GEORG STADTMANN, European University Viadrina, Economics
and Economic Theory, Post Box 1786, 15207 Frankfurt (Oder), Germany,
Tel.: +49 0335 5534 2700, E-Mail: stadtmann@europa-uni.de and University
of Southern Denmark, Odense.

                                            I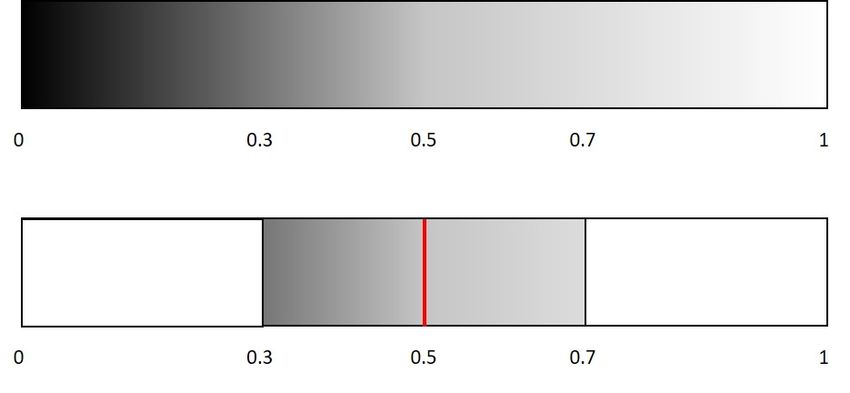
Contents
1 Introduction                                                                                  1

2 The role of skins in the virtual world                                                        3

3 Differentiation of products                                                                   6
  3.1 Assumptions . . . . . . . . . . . . . . . . . . . .      .   .   .   .   .   .   .   .    7
  3.2 The profit function . . . . . . . . . . . . . . . .      .   .   .   .   .   .   .   .    8
  3.3 Scenario analysis . . . . . . . . . . . . . . . . .      .   .   .   .   .   .   .   .    9
  3.4 Some further explorations and refinements . . .          .   .   .   .   .   .   .   .   13
       3.4.1 Variations in the cost of differentiation .       .   .   .   .   .   .   .   .   13
       3.4.2 Implications for the utility of households        .   .   .   .   .   .   .   .   16
       3.4.3 Further ideas . . . . . . . . . . . . . . .       .   .   .   .   .   .   .   .   16

4 Summary and conclusion                                                                       17

References                                                                                     19

Appendix                                                                                       21

List of Figures
   1    Different degrees of product differentiation . . .     . . . . . . . . 2
   2    Distribution of preferences . . . . . . . . . . . .    . . . . . . . . 7
   3    Relationship between profit (Π) and the number         of varities (n) 11
   4    Sensitivity analysis . . . . . . . . . . . . . . . .   . . . . . . . . 14

List of Tables
   1    Top earnings 2019: Free-to-play versus premium games . . . .                            4
   2    Scenario analysis . . . . . . . . . . . . . . . . . . . . . . . . .                     9

                                      II
1 Introduction
In the field of business & economics, frequently, the assumption of a
representative agent is used to model economic activity. However, people
are different. People are different due to differences in age, gender, or their
social status. Furthermore, people are heterogeneous because of the color of
their skin, their language, or cultural background (Hofstede 1984). Due to
these differences, companies also differentiate their products and offer goods
in several varieties.
In this paper, we examine the product differentiation within the in-game-
shop of a well known and very successful computer game – Fortnite. In this
game, 100 players board a flying bus, jump out of the bus like a skydiver
and use a glider to reach an island. Afterwards, the players collect weapons
in order to eliminate each other.1 The last man – or woman – standing wins
an ’Epic Victory’ (see Anderson 2019 for an introduction to the game). Not
only the victory is epic, but it is also an homage to Fortnite’s developer, the
company ’Epic Games Inc.’.
While the game can be downloaded and played free of charge, an
in-game-shop offers a variety of uniforms (’skins’), parachutes (’gliders’), or
dance moves (’emotes’). An examination of the shop indicates that skins
are sold within four different price categories.2 Furthermore, within one
price category, different varieties of skins are offered. One possibility of
differentiation is, for example, the color of the skin (see Figure 1).
1
Elimination – of course – could be interpreted as killing the opponent. However, in
Fortnite, a player is ’beamed away’ when an avatar receives too many hits. This beaming
process is called ’despawn’. Hence, it becomes clear that Fortnite is not a typical killer
game but also addresses a younger generation of players.
2
Skins are sold at 2,000 V-Bucks, 1,500 V-Bucks, 1,200 V-Bucks, or 800 V-Bucks.
Hence, uniforms are sold at different prices. V-Buck is the virtual currency used in the
in-game-shop. 1,000 V-Bucks are sold at the price of 9.99 USD in the American shop or
9.99 EUR in a shop belonging to the Euro area.
1Figure 1: Different degrees of product differentiation
Note: Skins in the upper row are differentiated to a larger extent than the
ones in the lower row.
Source: https://skin-tracker.com/
In this paper, we examine why it makes sense for a company to differ-
entiate products and offer them as different varieties. The remainder of the
paper is structured as follows: Section 2 examines the role of skins in the
virtual world. Section 3 solves the profit maximization problem, in case that
a company differentiates the good and introduces several varieties. The last
section concludes.
22 The role of skins in the virtual world
The success of video games can be measured in several dimensions: One
measure could be the overall number of players or the overall number of
downloads. Another measure is the number of active players within one
month. In light of this paper, a very important dimension is the economic
success. In this respect, Fortnite is outstanding (Goldman Sachs 2018).
This might be to some extend surprising, because the basic game can
be downloaded and played free of charge. The game belongs to the so
called ’free-to-play’ genre of video games. The top ’free-to-play’ games are
economically more successful than the most successful ’premium games’. In
2019, the average revenues generated by the top 10 free-to-play games were
equal to 1,430 million US-Dollar (see Table 1). The average revenue of the
’top 10 premium games’ was only 475.5 million. Hence, the average revenue
of free-to-play games was about 300 % larger than the average revenue of
the premium games.
– Insert Table 1 about here –
For Fortnite – or to be more precise – for the developer Epic Games
the ’Freemium’ business model pattern is very important (Anderson 2008,
Osterwalder/Pigneur 2010). This is the case because the basic product is
given away for free in order to attract a large market share. Revenue is
generated via the in-game-shops by selling the Battle Pass, skins, and other
virtual equipments. Skins can be regarded as a kind of uniform worn by the
virtual player.
3Table 1: Top earnings 2019: Free-to-play versus premium games
Top earning free-to-play games 2019
Rank Game Developer Revenue
1 Fortnite Epic Games 1800
2 Dungeon Fighter Online Nexon 1600
3 Honour of Kings Tencent 1600
4 League of Legends Riot Games, Tencent 1500
5 Candy Crush Saga KING Digital Entertainment 1500
6 Pokemon GO Niantic 1400
7 Crossfire SmileGate 1400
8 Fate/Grand Order Aniplex 1200
9 Game for Peace Tencent 1200
10 Last Shelter: Survival Long Tech/im30.net 1100
Average 1430
Top earning premium games 2019
Rank Game Developer Revenue
1 FIFA 19 Electronic Arts 786
2 Call of Duty: Modern Warfare Activision Blizzard 645
3 Grand Theft Auto V Take-Two Interactive 595
4 FIFA 20 Electronic Arts 504
5 Call of Duty: Black Ops IIII Activision Blizzard 487
6 NBA 2K19 Take-Two Interactive 370
7 Tom Clancy’s The Division 2 Ubisoft 370
8 Tom Clancy’s Rainbow Six: Siege Ubisoft 358
9 Borderlands 3 Take-Two Interactive 329
10 Sims 4 Electronic Arts 311
Average 475.5
Source: SuperData (2020, p. 11 and 13). *Revenue in USD million.
It becomes clear that Fortnite is a good example for the ’Free’ as business
model pattern – outlined by Anderson (2008) as well as Osterwalder/Pigneur
(2010). In this business model pattern, revenue might be generated via three
different channels:
1. Two-sided-markets: One side of the market subsidizes the other side
of the market: A good example is ’Facebook’, which is available for
private users free of charge. This market side of the private households
is subsidized by companies, which pay for advertisements.
2. Bait-and-Hook: The razor is given away for free, but profits are gener-
ated via the blades. Another frequently used example is the combina-
tion of a printer and the ink cartridges. The printer is sold at a very
low price, while the profits are generated via the ink.
43. Freemium: Many users use the basic version of the product for free, but
the profit is generated via premium add-ons. A good example is ’Skype’,
where the basic product can be used free-of charge, but subscriptions
for flat-rates are sold to also call landlines.
When it comes to free-to-play video games, some games use the Bait-
and-Hook approach: One example is the game ’Candy Crush’ which is
predominantly played on mobile phones. While the first levels are easy to
master, some levels can hardly be solved without relying on ’boosters’. Of
course, boosters can be earned with some effort within the game, but it is
much more convenient to spend some money and buy the boosters. This is
one element of the huge financial success of Candy Crush (Gaille 2015).
Fortnite, however, uses the Freemium approach: The game can be
played – without any restrictions and limitations – free of charge. The
revenues are generated via the in-game-shops where several add-on items
are offered: Especially, virtual uniforms or avatars called ’skins’ are very
popular products. Other virtual items are parachutes (gliders) and dance
moves (emotes). In the Fortnite game, all add-ons are just cosmetic items
and do not influence players’ strength and the gaming success. Hence, they
are just decorative items.
Successful video games are developed in a way to maximize gamer’s flow
and loyalty. One component in this system is the attractiveness of the avatar.
Liao et al. (2019) perform a questionnaire survey among online gamers.
They use a structural equation model to examine how the avatar influences
gamer’s mood. They find that avatar attractiveness and customization are
positively related to avatar identification. Avatar identification implies how
the gamer identifies him- or herself with the virtual player. One result
is that avatar identification influences flow and loyalty in a positive way.
Therefore, this study highlights the importance of the virtual add-in items
like skins in a video game.
5Bae et al. (2019) examine the relationship between game items and
mood management. They also perform an empirical study among gamers.
They find that stressed users are more likely to purchase decorative items
while bored users purchase functional items to manage their mood. Several
managerial implications are derived how game developers should deal with
the heterogeneity of gamers and what kind of items should be designed for
the different groups of gamers (Bae et al. 2019, p. 324-325).
Skins also serve as a status symbol among the young generation (Linken
2019, Schoeber/Stadtmann 2020). The British ’Children’s Commissioner’
examined the online gaming behavior of children. One focus is on the role
of in-game items for the social status. They conclude that: ”Children are
scorned in games such as Fortnite if they are seen to wear the ’default skin’
(the free avatar they receive at the start of the game). Children say they feel
embarrassed if they cannot afford new ’skins’, because then their friends see
them as poor.” One quote of a ten year old girl (Fortnite player) brings it to
the point: ”If you’re a default skin, people think you’re trash.” (Childrens
Commissioner 2019, p. 2).
3 Differentiation of products
In this section, we examine the phenomenon of product differentiation in a
theoretical model. We measure the success of the company, which developed
the video game, in the dimension of profits generated. The approach is in-
spired by Hotelling’s (1929, p. 45) ’Main Street’ model, where consumer
preferences are different from each other, due to geographical preferences.
Customers have preferences for a shop close to their homes due to trans-
portation cost.
63.1 Assumptions
As can be seen in the upper part of Figure 2, preferences are distributed as a
continuum of colors. Some households prefer a dark color (black) and some
households have strong preferences for a light color (white). Others prefer a
grey version of the good. The continuum runs from zero to one. Hence, the
market size is restricted to one.
Figure 2: Distribution of preferences
Each household might buy only one good or no good at all. Whether
a household buys or not depends on his preferences in relation to the char-
acteristics of the good offered. We assume that a household buys, in case
that the difference between the variety offered by the company (vi ) and the
preferences of the individual (pj ) is smaller than or equal to t:
|vi − pj | ≤ t (1)
The variable t can be interpreted as the ’most tolerable deviation’, so that
the household still buys the good. It is restricted to the range 0.5 ≥ t ≥ 0.
If t = 0, a household buys the good only, in case that the company exactly
provides the preferred color (vi = pj ). In case that t = 0.5, one variety –
placed in the middle of the continuum – is sufficient to cover the whole
7market. Furthermore, we assume that t is the same for all households.
In the lower part of Figure 2, a numerical example illustrates the
assumptions: The company produces only one variety of the good. We
assume that good number i = 1 was placed exactly in the middle (v1 = 0.5).
Furthermore, we assume that the most tolerable deviation is equal to
t = 0.2. This is an arbitrary assumption and will be modified in several
sensitivity analyses. As a consequence, all households – who are at most
t = 0.2 units away from v1 = 0.5 – buy the good. Therefore, all households
with preferences between pj = 0.3 and pj = 0.7 buy. Households who have
preferences in the range 0 – 0.3 or 0.7 – 1.0 do not buy, because the version
offered is too far away from their preferences.
In the next section, we formalize the profit maximization problem.
3.2 The profit function
The profit function is given by revenues minus cost:
Π = R(n) − n · c (2)
Revenues (R) depend on the number of varieties offered (n). Further-
more, we assume that the introduction of a new variety costs c currency
units. This cost originates from designing one variety of the good. After a
good is designed, it can be sold to households without any further cost.
In case that only one good is created (n = 1), the profit is equal to
Π = p1 · q1 − c. With two versions of the good (n = 2), the profit is equal
to Π = p1 · q1 + p2 · q2 − 2c. Let’s assume that the prices for the goods are
the same (p1 = p2 = p). With respect to the Fortnite game, we analyse the
8behaviour within one price group. Therefore, the profit function is given by:
Π = p · (q1 + q2 ) − 2c (3)
When the price is normalized to one (p = 1), we get:
Π = q1 + q2 − 2c (4)
3.3 Scenario analysis
We perform a scenario analysis: In Table 2, one dimension represents the
cost for differentiation on the side of the company. The other dimension
is the parameter t which represents households’ most tolerable deviation.
With respect to t, we differentiate the cases t = 0.5 and t < 0.5. In case
that t = 0.5, one variety – placed in the middle – is sufficient to cover the
whole market.
Table 2: Scenario analysis
t = 0.5 t < 0.5
c=0 Scenario 1 Scenario 2
c>0 Scenario 3 Scenario 4
• Scenario 1: In case that the monopolist introduces one version of the
good (n = 1), all households buy. Nevertheless, since also the cost for
product differentiation is zero, the number of varieties could also be
equal to infinity without hurting the company’s profit.
• Scenario 2: The number of differentiated products will definitely be
larger than one (n > 1), so that every household buys. However, since
cost of product differentiation is zero, the number of varieties is also
ambiguous. The best way to explain this finding is by contradiction:
9In case that number of versions would be equal to n = 1, the company
would only serve the market space of 2 · t. Since we are in Scenario
2 where t < 0.5 it is obvious that 2 · t < 1 so that the company does
not serve the whole market. Some parts of the spectrum – the corners
– would not be served. Due to the fact that in Scenario 2 the cost of
differentiation is zero (c = 0), the company can increase the variety
so that the complete market is covered. The increase in the number
of varieties does not influence cost and, hence, has no impact on the
profitability. Therefore, the number of varieties will be larger than one
(n > 1). However, the exact number of varieties is not determined.
• Scenario 3: When the company introduces one version of the good
(n = 1), profits are equal to:
Π = p1 ·q1 −n·c ⇒ since p = 1 & n = 1 ⇒ Π = q1 −c. (5)
The company will only produce if profits are positive. This is the
case, if the revenue is larger than the cost of introducing one product
category (q1 > c). The number of varieties will be either n = 0 or
n = 1. We won’t see two or more varieties of the good, because product
differentiation comes with a cost, but households would always buy.
• Scenario 4: This is the most interesting3 scenario and is now examined
in detail!
Each variety vi can cover the distance of t to the left and to the right.
Hence, the distance vi − t to vi + t can be covered by one variety, which is
given by 2 · t. With n-varieties, the space of n · 2 · t can be covered. Therefore,
the quantity sold is equal to q = n · 2 · t. Since prices are normalized to p = 1,
revenue is given by n · 2 · t.
3
We think that this is the most interesting scenario, because the solutions in Scenario 1,
2, and 3 are easier to derive and easier to understand – compared to Scenario 4. Further-
more, the exact number of varieties (n) can be determined by the different components
of the theoretical model. This was not the case in Scenario 1 and 2, where the number of
varieties is ambiguous.
10As a consequence, the profit function is
Π = n · 2 · t − n · c. (6)
Of course, some restrictions exist, because the space is defined between
zero and one, so that the market size is limited to one. Taking n out of
brackets yields:
Π = n · (2 · t − c) (7)
Hence, it becomes clear that the profit is positive only if 2 · t > c. In
case that this condition is fulfilled, the optimal solution is to increase n – as
much as necessary – to cover the whole continuum.
Figure 3: Relationship between profit (Π) and the number of varities (n)
Π6
Π∗ s
#c +1
# c
#
# c −c
# c
# c
#
# (2 · t − c)
#
#+1
#
# -n
n∗
We created Figure 3 to highlight the relationship between profit and
the number of varieties. In this graph it is assumed that n is a continuous
variable. In the left part of the diagram, profit function increases with the
slope of (2 · t − c). After the market is fully covered at n∗ , one additional
11variety would not generate additional revenues, but would only increase
cost. Therefore, after point n∗ is reached, profit function decreases by −c
with each additional variety of the good. Profits decrease after n∗ is reached.
The overall market size is limited to one. Therefore, the number of vari-
eties which maximizes profits is given by:
market size 1
n∗ = = (8)
2·t 2·t
In case that the most tolerable deviation is equal to t = 0.2, the optimal
number of varieties is equal to n∗ = 2.5. If, however, the number of varieties
should be an integer, either n∗ = 2 or n∗ = 3 is optimal. The marginal
revenue of a third variety is given by the ’decimal place’ (here: 0.5) times
2 · t. The marginal revenue has to be compared with the marginal cost of
introducing the third variety (c). In case that marginal revenue is larger
than marginal cost, the third variety will be introduced.
A detailed numerical example helps to understand the logic:
• For example, if t = 0.2 and c = 0.1: With n = 2 varieties, the first
variety could be placed at v1 = 0.2, which covers the range 0 – 0.4. The
second variety, placed at v2 = 0.6, covers the range 0.4 – 0.8. Hence,
the range 0.8 – 1.0 is not served yet. Therefore, the company covers the
space n · 2 · t = 0.8 of the space. A space of the size 0.2 is not covered!
Since prices are normalized to one, revenue is equal to n · 2 · t · p = 0.8,
cost is equal to n · c = 0.2. Profit is equal to Π = 0.6.
• Does it make sense to add one additional variety so that also the re-
maining part of the space is covered? Yes, of course: By incurring
additional cost of c = 0.1, the company can earn 0.2 in additional rev-
enues. Therefore, the optimal number of varieties is n∗ = 3 and profit
is Π = 1 − 3 · 0.1 = 0.7.
123.4 Some further explorations and refinements
3.4.1 Variations in the cost of differentiation
In this section, we explore the stability of the results and suggest some
refinements. Especially, we examine the role of the cost of differentiation (c).
Until now, we assumed that this variable is exogenously given and constant.
However, we could also argue that the cost of differentiation varies with the
degree of differentiation. The more different two products from each other,
the larger the cost of differentiation. Figure 1 helps to make this argument.
The upper row indicates skins that are differentiated to a larger extent
than the ones in the lower row. Hence, it makes sense to assume that the
cost to design and to program the skins in the upper row will be higher than
the cost to create the skins in the lower row.
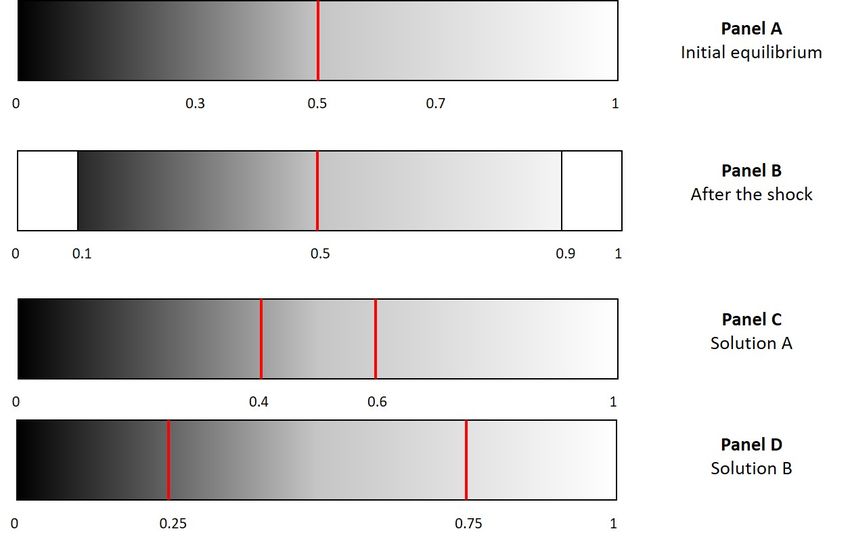
Figure 4 illustrates, why this detail is important for the profit maximiza-
tion problem and the degree of differentiation in the equilibrium.
The initial scenario is characterized as follows: We assume t = 0.5
and the company has introduced one variety in the middle of the space
(v1 = 0.5). Since t = 0.5, all households buy the product (see Panel A of
Figure 4).
Due to an exogenous shock, the most tolerable deviation t decreases
to the level t = 0.4. This implies that customers become less tolerable
with respect to difference of the version offered by the company and the
individual preferences of the consumer. In case that the company would
still produce the same variety, the households in the two corners would not
buy the good anymore. In Panel B of Figure 4, this is represented by the
distance 0 – 0.1 as well as 0.9 – 1.0.
13Figure 4: Sensitivity analysis
14Since one variety does not cover the whole market, the company could
introduce n = 2 varieties. However, it is questionable where the company
places its products (see Panel C and D of Figure 4).
• Solution A could be to place one good at v1 = 0.4 and the other one at
v2 = 0.6. In this solution, the relationship |vi − pj | ≤ t is fulfilled for
all customers.
• Solution B could be to place one good at v1 = 0.25 and the other one
at v2 = 0.75. Also in this solution, the relationship |vi − pj | ≤ t holds.
Solution A implies a relatively low degree of differentiation between
variety 1 and 2 (v2 − v1 = 0.6 − 0.4 = 0.2). In Solution B, the two versions
are differentiated to a larger extend (v2 − v1 = 0.75 − 0.25 = 0.5).
It becomes clear that if the cost of product differentiation does not
vary with the degree of differentiation, good 1 could be placed in the range
[0.1 − 0.4] and good 2 in the range [0.6 − 0.9]. If the two products are placed
in these ranges, the company could serve the whole market.
How does the optimal solution looks like, in case that the cost of dif-
ferentiation increases, the more the products have to be differentiated from
each other? The answer is clear-cut: The company would opt for Solution
A, in order to minimize the cost of differentiation. For example, if the cost
of differentiation are given by
C = c + α · |v2 − v1 |, (9)
the cost of Solution A would be equal to CA = c+α·|0.6−0.4| = c+0.2·α
while the cost of Solution B would be equal to CB = c + α · |0.75 − 0.25| =
c + 0.5 · α. Since the cost of differentiation is lower in Solution A, the
company would opt for a lower degree of differentiation.
15This solution, however, is not optimal for the consumers. The optimal
scenario for households would be Solution B. This will be elaborated in the
next subsection.
3.4.2 Implications for the utility of households
Until now, we assumed that the company is just using the profitability as
its decision criterion. In order to examine the effects for the consumers, one
has to specify the utility function. Let’s assume that the utility function of
a household j is given by:
Uj = t − |vi − pj | (10)
In case that the company offers exactly the skin preferred by household j
the term vi = pj is zero, so that the utility is equal to t. The utility decreases
with the absolute difference between vi and pj , which implies that the utility
of one household is the lower, the further away the offered variety from his
preferences is. In the appendix, we show that the Solution B is optimal for
the consumer. This solution generates the highest utility for the average
household.
3.4.3 Further ideas
In this subsection, we briefly discuss how relaxing the one or the other
assumption affects the equilibrium.
Until now, we assumed that the price is exogenously given and normalized
to one. One could also link household’s willingness-to-pay to the difference
between the characteristics of the good offered and household’s individual
preferences: The lower the difference, the higher the willingness-to-pay.
This refinement would lead to a larger degree of product differentiation in
equilibrium.
16Another idea could be to modify equation (9) which symbolizes the cost
of differentiation. In case that this function is convex
C = c + α · (v2 − v1 )2 , (11)
it might be the case that the company does not cover the whole market.
Maybe, some households in the corners of the continuum would not be served.
4 Summary and conclusion
Fortnite is the most successful video game in terms of revenues generated.
Since it belongs to the ’free-to-play games’, the company has to optimize
the in-game-shop to generate revenues. Product differentiation is one
possibility to optimize the profitability of the game. In this paper, we use
a microeconomic approach in order to highlight the implications of product
differentiation for the profit maximization problem.
The insights generated in this subsection can be summarized as follows:
Differentiation has at least two dimensions: The number of different
products offered (n) as well as the degree of differentiation of two varieties
|vi − vi+1 |.
The degree of differentiation will be the larger,
• the lower the cost of differentiation on the side of the company,
• in case that the company also considers the heterogeneity of customers
at least as a subordinated decision criterion.
The theoretical model uses only the color of the skins as the variable of
differentiation. In Fortnite’s in-game-shop, skins are also differentiated with
respect to gender, since male and female characters are sold. Furthermore,
one could distinguish between human and fantasy characters. Hence, it
becomes clear that skins can be differentiated in several dimensions – besides
17color.
Future research could examine the heterogeneity of players and skins in
an empirical analysis. One research question could be whether the gender
of the player has implications for the willingness to buy a male or a female
skin.
18References
Anderson, Katie Elson (2019). Getting acquainted with social networks and
apps: figuring out Fortnite in (hopefully) less than a fortnight. Library
Hi Tech News, 9/2019, 11 – 16.
DOI10.1108/LHTN-09-2019-0064
Anderson, Chris (2008). Free! Why $0.00 is the future of business.
www.wired.com/2008/02/ff-free/
Bae, J., Kim, S., Kim, K. and Koo, D. (2019). Affective value of game
items: a mood management and selective exposure approach, Internet
Research, 29(2), 315 – 328.
.
Childrens Commissioner (2019). Gaming the system. October 2019
https://www.childrenscommissioner.gov.uk/wp-content/upload
s/2019/10/CCO-Gaming-the-System-2019.pdf
Gaille, Brandon (2015). Explanation of the Bait and Hook Business Model.
Feb 25, 2015.
https://brandongaille.com/explanation-of-the-bait-and-ho
ok-business-model
Goldman Sachs (2018). The World of Games Esports From Wild West to
Mainstream. Equity Research.
https://www.goldmansachs.com/insights/pages/infographics/e
-sports/report.pdf
Hofstede, Geert (1984). Culture’s Consequences: International Differences
in Work-Related Values (2nd ed.). Beverly Hills CA: SAGE Publica-
tions.
Hotelling, Harold (1929). Stability in Competition, Economic Journal,
39(153), 41 – 57,
Liao, G., Cheng, T. and Teng, C. (2019). How do avatar attractiveness
and customization impact online gamers’ flow and loyalty?, Internet
Research, 29(2), 349 – 366.
19Linken, André (2019). Fortnite: Kostenpflichtige Skins gelten bei Kindern
als Statussymbol. PC Games, 23 October 2019.
https://www.pcgames.de/Fortnite-Spiel-16272/News/kostenpfl
ichtige-skins-gelten-bei-kindern-als-statussymbole-13353
52/
Osterwalder, Alexander; Pigneur, Yves (2010). Business Model Generation.
Wiley.
Schoeber, Timo; Stadtmann, Georg (2020). Fortnite: The Business Model
Pattern Behind the Scene, Viadrina Discussion Paper Series 415.
www.wiwi.europa-uni.de/de/forschung/publikationen-projekte
/dp/ dokumente/415 Schoeber Stadtmann.pdf
SuperData (2019). 2018 Year in Review–Digital Games and Interactive
Media. SuperData–a Nielsen company.
SuperData (2020). 2019 Year in Review–Digital Games and Interactive
Media. SuperData–a Nielsen company.
20Appendix
In this appendix, we show that the utility for the average household is larger
in Solution B compared to Solution A. This can be proven by calculating the
overall loss in utility of the households:
• Loss in Solution A:
– Good 1 is placed at v1 = 0.4. All households to the left, that
means, in the range 0 − 0.4 buy good 1 and the average loss in
utility for one household is equal to |0.4 − 0.2| = 0.2.
– All households which are in the range 0.4 – 0.5 also opt for good
1. The loss of an average household is equal to |0.4 − 0.45| = 0.05.
– Therefore, the overall loss in utility for all households which buy
good 1 is equal to 0.4 · 0.2 + 0.1 · 0.05 = 0.085. The values 0.4 and
0.1 serve as the weights for the left (0.4) and right (0.1) side of
the market of good 1.
– The same considerations hold for good 2 so that the overall loss
in utility is equal to 2 · 0.085 = 0.17.
• Loss in Solution B:
– Good 1 is placed at v1 = 0.25. All households to the left, that
means, in the range 0 − 0.25 buy good 1 and the average loss in
utility for one household is equal to |0.25 − 0.125| = 0.125.
– All households which are in the range 0.25 – 0.5 also opt for good 1.
The loss of an average household is equal to |0.25−0.375| = 0.125.
– Therefore, the overall loss in utility for all households which buy
good 1 is equal to 0.25 · 0.125 + 0.25 · 0.125 = 0.0625. The two
values of 0.25 serve as the weights for the left and right side of the
market of good 1.
– The same considerations hold for good 2 so that the overall loss
inn utility is equal to 2 · 0.0625 = 0.125.
21You can also read