Projecting COVID-19 epidemic risk in Summer 2021 by French department - EPIcx lab
←
→
Page content transcription
If your browser does not render page correctly, please read the page content below
Projecting COVID-19 epidemic risk in Summer 2021 by
French department
Report #32 [previous reports at: www.epicx-lab.com/covid-19.html]

Mattia Mazzoli, Eugenio Valdano*, Vittoria Colizza+

INSERM, Sorbonne Université, Pierre Louis Institute of Epidemiology and Public Health, Paris, France

*eugenio.valdano@iplesp.upmc.fr
+vittoria.colizza@inserm.fr

10/07/2021

RESUME
Les semaines à venir vont être cruciales pour déterminer les conditions et le calendrier d'une 4e vague de
COVID-19 en France, sous la pression de la propagation rapide du variant Delta et de la diminution du
rythme de vaccination. Les efforts de surveillance et de contrôle devraient anticiper une grande
hétérogénéité géographique, en raison de schémas spatialement hétérogènes d'immunité au niveau de la
population, de mobilité estivale et de surpeuplement, et de la présence du variant Delta. Nous quantifions
ces facteurs en (i) définissant cinq mesures de risque, (ii) les utilisant pour profiler le risque épidémique
dans chaque département de France métropolitaine, et (iii) les combinant en une seule mesure de risque
global par département. Notre analyse montre que les départements du Sud-Ouest sont généralement les
plus à risque. Cela est principalement dû à la combinaison de trois types de risques – le surpeuplement dû
à la saison estivale, une immunité plus faible, et la présence de foyers du variant Delta. Nos mesures de
risque peuvent aider à orienter l'allocation des ressources de surveillance et de contrôle, et à améliorer
les efforts de vaccination.

SUMMARY
The upcoming weeks will be critical in shaping the conditions and timing of a 4th wave of COVID-19 in
France, under the pressure of the rapidly spread of the Delta variant and the decrease in vaccination pace.
Surveillance and control efforts should anticipate a large geographical heterogeneity, due to spatially
heterogeneous patterns of infection-acquired immunity, vaccination, summer mobility, and presence of
the Delta variant. We quantify these factors by (i) defining five risk metrics, (ii) using them to profile
epidemic risk in each department of mainland France, and (iii) combining them into a single metric of
overall risk per department. We find departments in the Southwest to be generally at highest risk. This is
mainly due to the combination of three types of risk, namely crowding due to the summer season, lower

1 epicx-lab.com
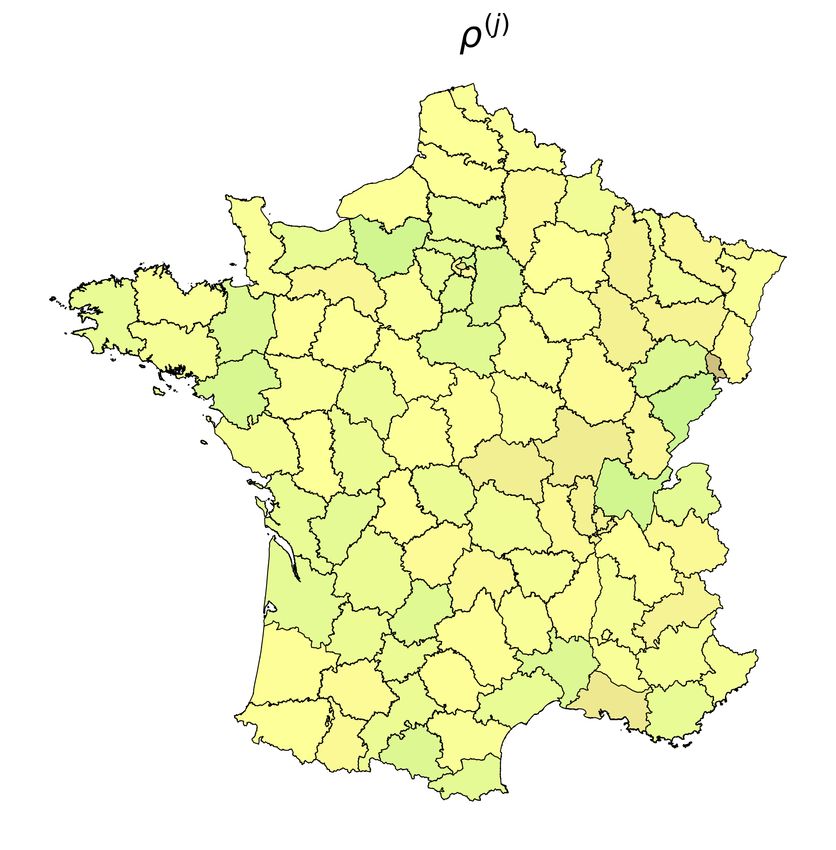
immunity, and presence of Delta variant hotspots. Our risk metrics can help guide the allocation of
surveillance and control resources, and improve vaccination efforts.

INTRODUCTION
The COVID-19 situation in France is likely at a turning point. After several weeks of decrease in viral
circulation, week 26 witnessed a marked increase in the case incidence in the 15-44 years old
population1. Administration of the first doses is receding since several weeks2, while the Delta variant
rapidly progresses, with an estimated 43.2% of detected cases attributed to the L452R mutation in week
263. A large heterogeneity across space is reported that may be further exacerbated by the rise of
summer travels, increasing the mixing between different populations of varying levels of immunity and
from areas characterized by diverse Delta presence.
Using hospitalization, COVID-19 incidence, PCR screening and vaccination data from official sources, and
crowding and contact data from Facebook, we introduce 5 data-driven risk metrics at the departmental
level, each highlighting different aspects contributing to the local epidemic risk:
 1) Low local population-level immunity;
 2) High mixing with residents of other departments with low population-level immunity;
 3) Frequency of Delta variant among screened PCR tests;
 4) High mixing with residents of other departments in which there is high incidence of the Delta
 variant;
 5) Crowding: increased population during the summer season.

(1) identifies departments in which a large number of susceptible individuals may fuel outbreaks. (2)
identifies departments whose residents may be exposed to cases generated in low-immunity
departments. (3) identifies departments where outbreaks may be accelerated due to the Delta variant. (4)
identifies departments whose residents may be exposed to the Delta variant. (5) identifies departments
with an expected higher mixing due to summer travels.
Synthesizing these 5 risk metrics into an overall risk indicator for each department, we identify
departments at higher risk that could help inform prioritization of surveillance and control efforts.

METHODS
Population-level immunity. We inferred cumulative infections in each department using hospitalizations
data and screening data from Santé Publique France (SpF). We assumed a 7-day delay from infection to
hospitalization, and hospitalization rates by variant reported in the literature4-5. We used vaccination data
from the Assurance Maladie6 providing injections history by type of vaccine. We combined immunity after
infection and immunity due to vaccination in a single metric ρ" , for each department i. This results in
 % = 1 − (1 − % )(1 − % )

2 epicx-lab.com
 % = ./ 0,2,% 0,2 + 5,2,% 5,2 6
 2
Where η" is immunity after infection, v0,9 , v5,9 are the proportion of 1st vaccinations and complete
vaccinations for vaccine k, among Pfizer/BioNTech, Moderna, AstraZeneca, Janssen (the latter
contributing only to complete vaccinations). ε0,9 , ε5,9 are the efficacy of 1st and complete vaccination
schemes, as reported in the literature7-9.
To project vaccination coverage in the near future, we designed two scenarios:
 ● S1, projecting future 2nd vaccinations from reported 1st vaccinations to date, and assuming that
 no additional first injections are administered.
 ● S2, projecting future 1st vaccinations assuming that the rates of new vaccinations in each
 department is the same as that observed in June, and projecting future 2nd vaccinations from
 reported and projected 1st vaccinations.
Results shown in the figures are for the vaccination rollout scenario S1. In the Appendix, we show a
comparison between the results obtained in the two scenarios.
Mobility and crowding. We used human mobility and population data provided through a partnership with
Facebook Data For Good10. These data inform on the number of individuals in each department of
mainland France (excluding Corsica), and on the level of mixing (potential contacts) between residents of
any two departments. From mixing data, we build the matrix p"< , which encodes the average number of
contacts that the average resident of department i has with residents of department j, in any given day of
July and August 2021. To infer mobility after the present date, we used data from the same period in
2020, i.e. we assume that mobility and contacts during summer 2021 follows the patterns observed in
summer 2020.
Risk metrics and overall risk.
• Susceptibility in every department is computed from estimated population-level immunity: s" = 1 −
 ρ" .
 (B)
 (
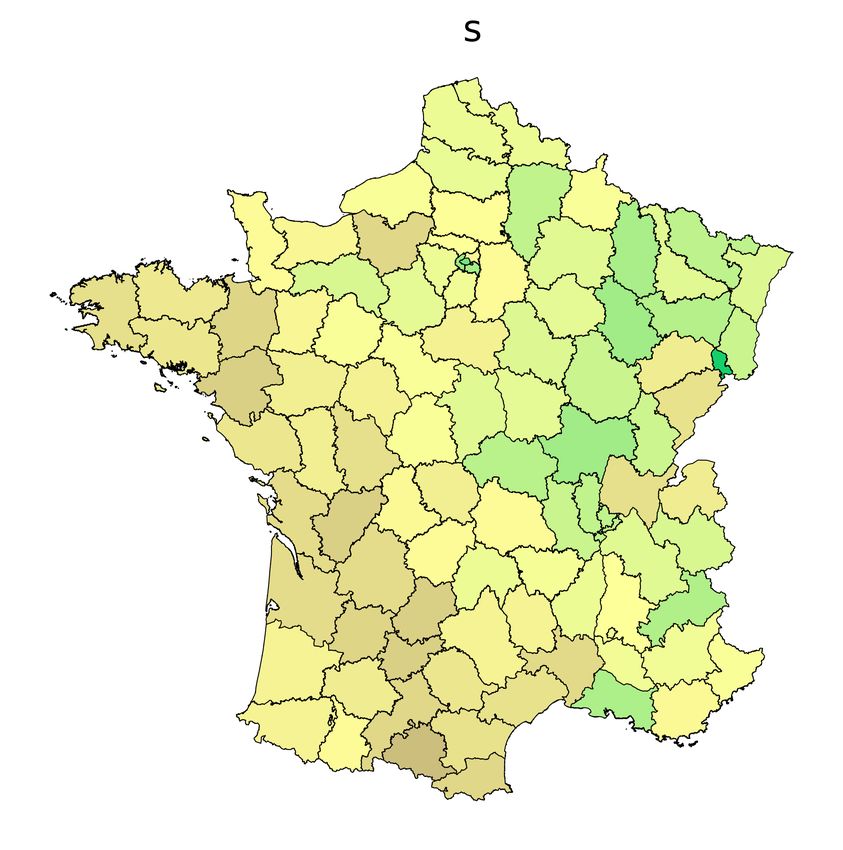
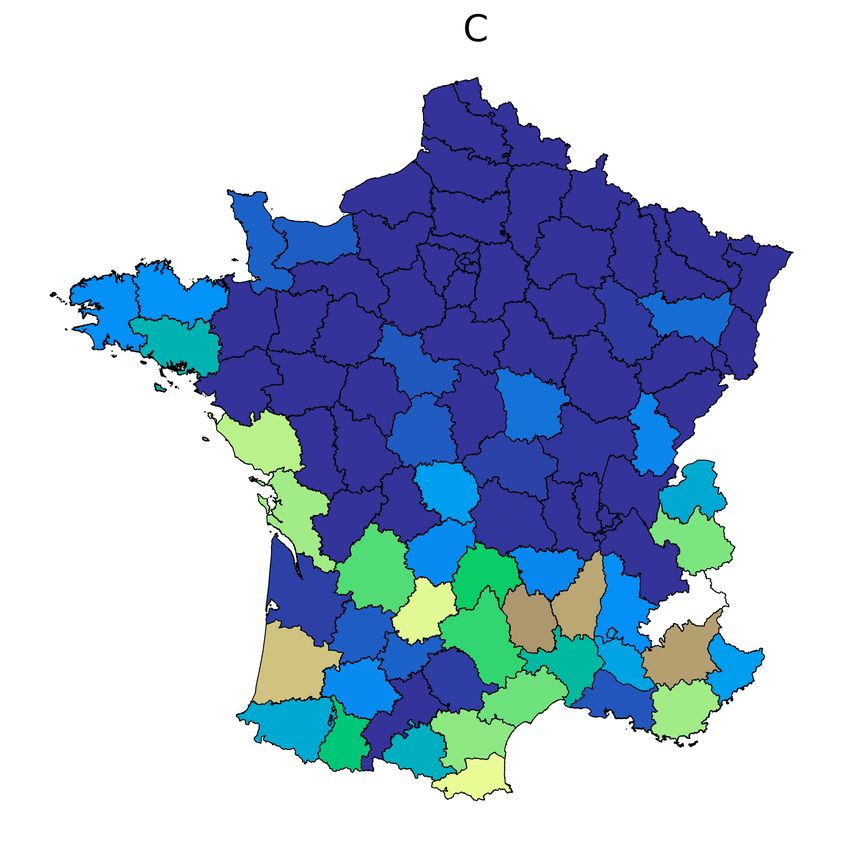
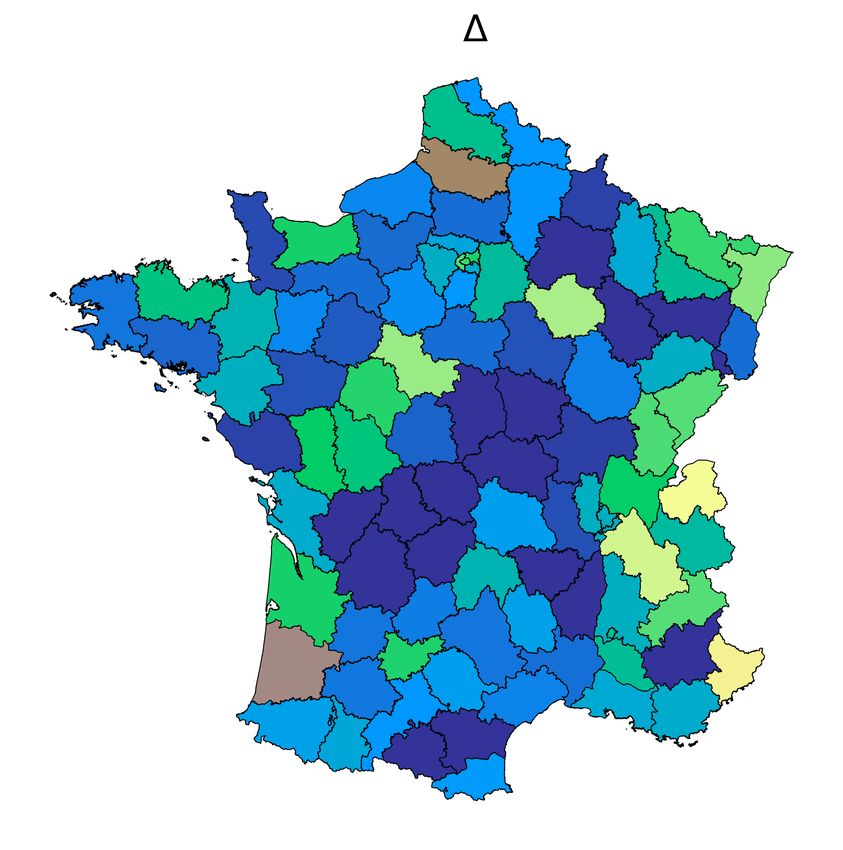
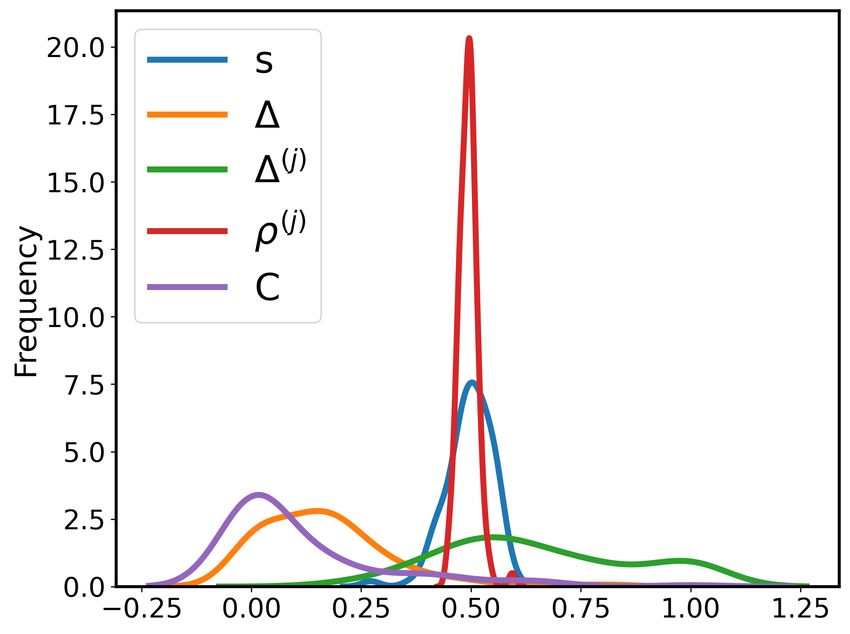
• Crowding C" is computed as the relative difference in population, with respect to a baseline set to
 the 2nd week of May. Negative values (decreased mobility) are clipped to zero.

Overall risk is computed as the sum of the standardized (mean=0, variance=1) values of the five risk
indicators. The result is then mapped between zero and one, with zero corresponding to the lowest risk,
one corresponding to the highest risk.

RESULTS

 A B C

 D E F

Figure 1. Risk metrics. We defined five metrics corresponding to the five types of risk identified (see also Methods). A) susceptibility: shows
the fraction of susceptible individuals in each departments (excluding Corsica); B) relative immunity difference shows the relative difference
in immunity between residents and their contacts from other departments; C) crowding: shows the relative increase in population during
summer; D) proportion of Delta variant: shows the fraction of Delta-variant cases; E) exposure to the Delta variant from other departments:
shows the probability that a case from another department is infected with the Delta variant. For the definition of the risk metrics see
Methods. F) shows the distribution of each metric across departments.

4 epicx-lab.com
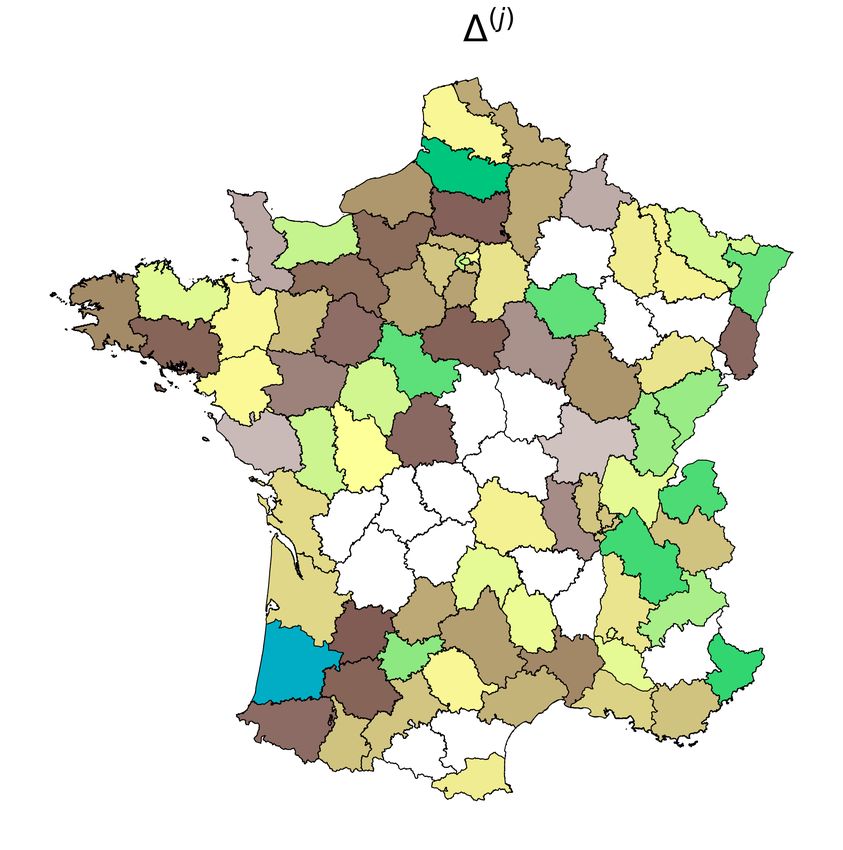
A B

Figure 2. Overall risk. We used our risk metrics to define a synthetic indicator of overall risk (see Methods). A) shows overall risk in each
department, binned in 5 intervals: 0-to-0.2 (dark blue), 0.2-to-0.4 (light blue), 0.4-to-0.6 (gray), 0.6-to-0.8 (orange), 0.8-to-1 (red). B)
shows the composition of risk in the top 20 departments with the highest overall risk. The values of the five risk metrics are shown in the
radar plots. Radar plots are colored according to their overall risk bin.

KEY FINDINGS
 ● We computed 5 risk metrics in each department to measure risk related to population-level
 susceptibility, mobility, crowding, presence of the Delta variant (Figure 1). The following table
 lists the top three department (highest risk) for each risk metric:
 risk metric top three departments
 (susceptibility) 1. ARIEGE
 2. TARN-ET-GARONNE
 3. CHARENTE

 ρ(N) (relative immunity difference) 1. TERRITOIRE DE BELFORT
 2. PARIS
 3. BOUCHES-DU-RHONE

 (crowding) 1. HAUTES-ALPES
 2. LOZERE
 3. ALPES-DE-HAUTE-PROVENCE

 Δ (frequency of the Delta variant) 1. LANDES
 2. SOMME
 3. ALPES-MARITIMES

 Δ(N) (exposure to Delta from other 1. ALLIER
 2. DORDOGNE
 departments) 3. HAUTE-MARNE

5 epicx-lab.com
● Values are very heterogeneous across departments for the risk metrics related to crowding (c),
 and to the Delta variant, including both the local frequency (Δ) and the exposure to the variant
 through mobility (Δ(
LIMITATIONS
 ● Our estimates rely on the assumption that mobility and crowding during late July – August 2021
 are similar to the same period in 2020.
 ● Our immunity projections do not account for infections occurring later than the current date. They
 should, however, have little impact on immunity given the currently low incidence. This is also
 confirmed by the robustness of results across different vaccination rollout scenarios.
 ● We do not consider age structure in this assessment. This may impact our inference of infection-
 acquired immunity per department in presence of substantial heterogeneities of age profiles of
 department populations. Concerning displacements, our previous work showed that mobility
 difference across broad age classes were relatively small during movement restrictions11.
 However, younger population strata may be more mobile and more susceptible (lower vaccination
 coverage) during summer holidays. Finally, this risk assessment does not focus on the healthcare
 impact.
 ● This report provides an assessment of the risk based on the current situation and the evolving
 behavior registered during last summer. Changes in these conditions compared to last summer
 (e.g., due to recommendations, adaptive behaviors, novel policies) will affect these findings.
 ● Our report covers only the departments of mainland France, excluding Corsica.
 ● The choice of the five metrics is arbitrary, and so is their synthesis as overall risk. They
 nonetheless encode the main factors we expect to play a crucial role in this epidemic phase.

ACKNOWLEDGMENTS
This study is partially funded by: ANR projects DATAREDUX (ANR-19-CE46-0008-03), EVALCOVID-19
(ANR-20-COVI-0007); EU H2020 grants MOOD (H2020-874850) and RECOVER (H2020-
101003589).

REFERENCES
1. Santé publique France. COVID-19 : point épidémiologique du 8 juillet 2021.
https://www.santepubliquefrance.fr/maladies-et-traumatismes/maladies-et-infections-
respiratoires/infection-a-coronavirus/documents/bulletin-national/covid-19-point-epidemiologique-du-
8-juillet-2021.
2. Données relatives aux personnes vaccinées contre la Covid-19 (accessed on July 7, 2021).
https://www.data.gouv.fr/fr/datasets/donnees-relatives-aux-personnes-vaccinees-contre-la-covid-19-

7 epicx-lab.com
1/.
3. Géodes - Taux de tests avec présence de la mutation L452R (accessed on July 7, 2021).
https://geodes.santepubliquefrance.fr/#c=indicator&i=sp_mutations_7j.tx_c1&s=2021-06-30-2021-07-
06&t=a01&view=map2.
4. Lapidus, Nathanael, et al. Do not neglect SARS-CoV-2 hospitalization and fatality risks in the
middle-aged adult population. Infectious diseases now 51.4 (2021): 380-382.
5. Funk, T. et al. Characteristics of SARS-CoV-2 variants of concern B.1.1.7, B.1.351 or P.1: data
from seven EU/EEA countries, weeks 38/2020 to 10/2021. Eurosurveillance 26, 2100348 (2021).
6. Assurance Maladie. https://datavaccin-covid.ameli.fr/explore/dataset/donnees-vaccination -par-
tranche-dage-type-de-vaccin-et-departement/information/ (accessed on July 7, 2021)
7. Sheikh, A., McMenamin, J., Taylor, B. & Robertson, C. SARS-CoV-2 Delta VOC in Scotland:
demographics, risk of hospital admission, and vaccine effectiveness. The Lancet S0140673621013581
(2021).
8. Shrotri, Madhumita, et al. Vaccine effectiveness of the first dose of ChAdOx1 nCoV-19 and
BNT162b2 against SARS-CoV-2 infection in residents of long-term care facilities in England (VIVALDI): a
prospective cohort study. The Lancet Infectious Diseases (2021).
9. Amit, Sharon, et al. Early rate reductions of SARS-CoV-2 infection and COVID-19 in BNT162b2
vaccine recipients. The Lancet 397.10277 (2021): 875-877.
10. Facebook Data for Good. https://dataforgood.fb.com/
11. Pullano, Giulia, et al. Evaluating the effect of demographic factors, socioeconomic factors, and
risk aversion on mobility during the COVID-19 epidemic in France under lockdown: a population-based
study. The Lancet Digital Health 2.12 (2020): e638-e649.

8 epicx-lab.com
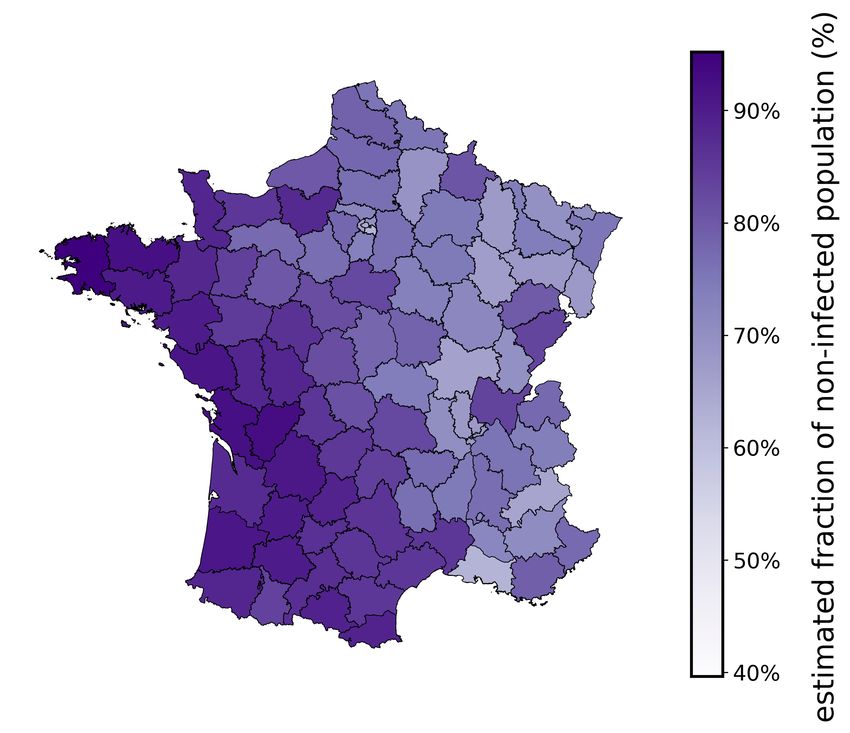
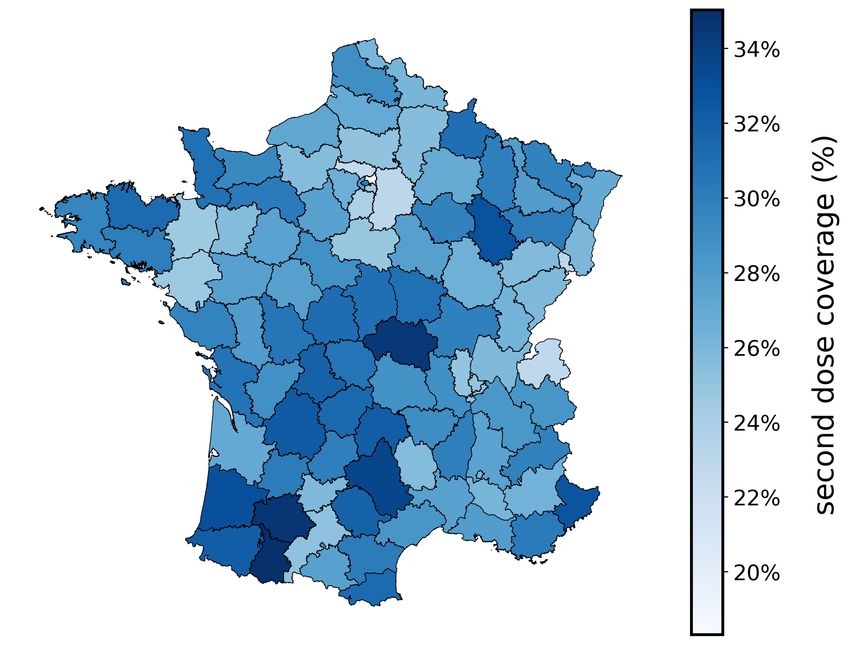
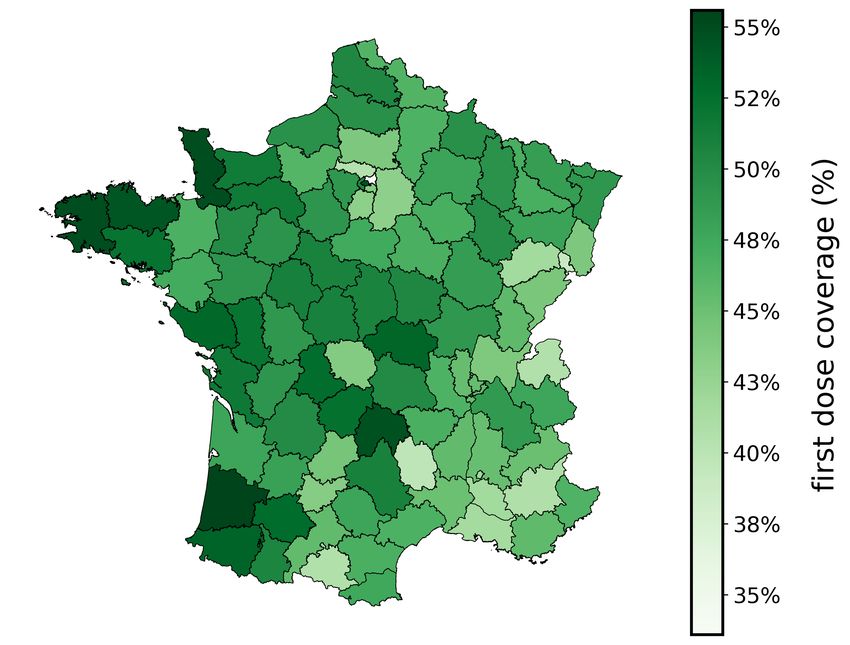
APPENDIX

 A B C

Figure S1. Sources of immunity. A) shows current estimated fraction of non-infected population. B) shows current 1-dose vaccine coverage;
C) shows the fraction of fully vaccinated individuals.

Figure S2. Comparing immunity scenarios. We tested two immunity scenarios. S1 includes infection-acquired immunity, complete
vaccinations to date, 1st-dose vaccinations to date, projected complete vaccinations from recorded 1st doses. S2 includes infection-acquired
immunity, complete vaccinations to date, 1st-dose vaccinations to date, projected 1st doses assuming that vaccination rate in each
department is the same as the one recorded in June, projected complete vaccinations from recorded and projected 1st doses. The figure
compares overall risk in the two immunity scenarios (S1 vs S2). Pearson coefficient is 0.98, Kendall-tau coefficient is 0.87.

9 epicx-lab.com
You can also read