PROPERTY & GREENSPACE - AUSTRALIA APRIL 2021 - CORELOGIC
←
→
Page content transcription
If your browser does not render page correctly, please read the page content below
Property &
Greenspace
Australia

April 2021
About
    CoreLogic

    CoreLogic is a leading property information, analytics and
                                                                                       Contact
    services provider in the United States, Australia and New Zealand. CoreLogic
    helps clients identify and manage growth opportunities, improve                    Call us 1300 734 318

    performance and mitigate risk, by providing clients with innovative,               ask@corelogic.com.au

    technology-based services and access to rich data
    and analytics.

    Whilst all reasonable effort is made to ensure the information in
    this publication is current, CoreLogic does not warrant the accuracy, currency
    or completeness of the data and commentary contained in this publication
    and to the full extent not prohibited by law excludes all loss or damage arising
    in connection with the data and commentary contained in this publication.

    Author: Anna Russell, Senior Professional, Consulting & Risk Management

                                                                                       corelogic.com.au
2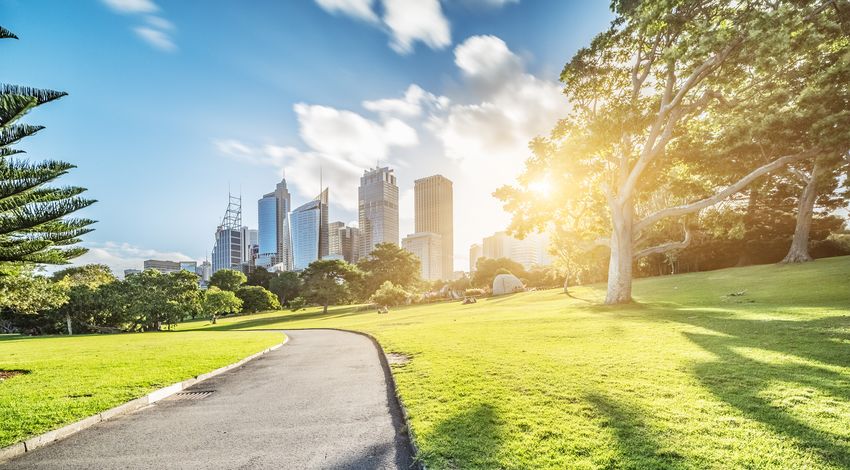
What value does the
    property market put
    on greenspace?
    Greenspace has a known value in improving mental and physical health as well as
    perceived wellbeing.

    Other benefits include increased levels of resident exercise and    A large proportion of the prior studies investigating price
    potential for reduction in crime. International studies have        premiums on greenspace have been conducted in the Northern
    suggested that the positive effects of greenspace may translate     Hemisphere, with only one substantial study (Lockwood &
    to a price premium for residential property, with both proximity    Tracy, 1995) conducted in Australia. The Australian property
    to public greenspace and the presence of private greenspace         market, and the manner in which the Australian public relate to
    having the potential to encourage a price premium in certain        and value property, is distinctly different to other markets; as a
    markets.                                                            result the value ascribed to greenspace may also be different.
                                                                        Whilst property ownership is proportionally low in many
    This paper explores the benefits of greenspace and the              European nations, and multiple property ownership is
    overseas evidence for a price premium in ‘green’ locations, and     uncommon, Australia has a relatively high rate of home
    then utilises a blend of CoreLogic and public data to conduct an    ownership, and property as an asset class for wealth building is
    initial investigation into whether the Australian market also       a popular option amongst investors. Further, the parameters of
    considers greenspace worthy of a price premium.                     the Australian mortgage market do not allow for non-recourse
                                                                        default in the same way as the US. This means Australian
    The term ‘greenspace’ refers to land that is partly or completely
                                                                        homeowners are more likely to ‘stick it out’ when their
    covered with grass, trees, shrubs or other vegetation.1 In the
                                                                        ownership position is not ideal. We see examples of this in how
    context of cities, greenspace includes parks, community
                                                                        Australians responded to the 2020 Black Summer fires and also
    gardens, cemeteries, school yards, playgrounds and vacant lots.
                                                                        tropical cyclones such as Cyclone Debbie in 2017.
    Greenspace may be public and available for all members of the
    community to benefit from, or it may be privately owned such
    as large yards or gardens. In academic studies, greenspace is
    often measured using a measure called “Normalised Difference
    Vegetation Index” which is derived from satellite imagery.

    1
        https://www3.epa.gov/region1/eco/uep/openspace.html

3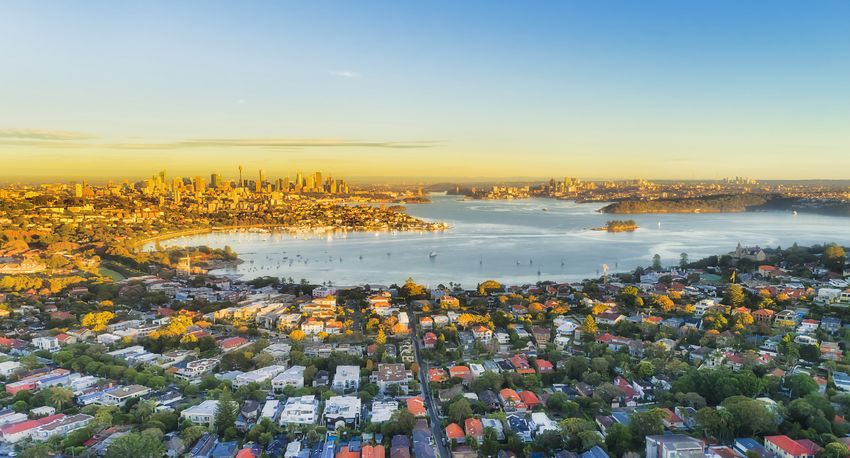
Access to nature makes
    us healthier, happier
    and more resilient
    There is a large body of literature across both health science                               The study found that living within 300m of public green space
    and urban planning disciplines evidencing health and wellbeing                               had a significant effect on perceived wellbeing of residents in a
    benefits from exposure to nature. A particularly significant                                 densely populated urban setting. It also found that perceived
    example is Engemann et al’s report published in 2019 ,                    2
                                                                                                 wellbeing went up significantly as the area of greenspace
    examining the impact of greenspace exposure on mental                                        available increased.3
    health. The study used satellite imagery to determine the
                                                                                                 Greenspace also has the potential to improve a range of
    Normalised Difference Vegetation Index (NDVI) within a 210m x
                                                                                                 physical conditions, most specifically those associated with the
    210m square around the residence of 943,027 Danish children
                                                                                                 western lifestyle – obesity, hypertension and blood sugar
    from birth to the age of 10 years. Across this large cohort the
                                                                                                 disorders, which frequently co-exist as metabolic syndrome. A
    study found that the impact of greenspace on a person’s
                                                                                                 longitudinal study of 6,000 British adults from 1997 to 2013
    likelihood to express a psychiatric disorder was comparable to
                                                                                                 found that long term exposure to greenspace appears to play
    other factors such as family history and parental age, higher
                                                                                                 an important role in preventing metabolic syndrome as well as
    than urbanisation and slightly lower than parents’
                                                                                                 reducing or preventing the individual components of the
    socioeconomic status. Mood disorders, depression, anxiety
                                                                                                 disorder such as high blood lipid concentration or
    and somatic disorders were most closely linked to NDVI levels
                                                                                                 hypertension4. Given the burden these illnesses place on the
    indicating that permeation of high-quality greenspace into
                                                                                                 public health system in western countries, plus the inherent
    urban areas might counter many of the woes thought to be due
                                                                                                 utility of parks for play and socialisation, provision of
    to population density and general features of urban living.
                                                                                                 greenspace seems a particularly low cost and effective way to
    These findings are supported by a UK study conducted by                                      reduce the burden of public health costs and deliver a healthier
    Newcastle University, University of Warwick and University of                                happier urban population.
    Sheffield, and published in Applied Geography Aug. 2019.

    2
        E
         ngemann, E., Pedersen, C., Arge, L., Tsirogiannis, C., Mortensen, P. & Svenning, J., Residential green space in childhood is associated with lower risk of psychiatric disorders
        from adolescence into adulthood, Proceedings of the National Academy of Sciences Mar 2019, 116 (11) 5188-5193; DOI: 10.1073/pnas.1807504116
    3
       Houlden, V., de Albuquerque, J.P., Weich, S. & Jarvis, S. ‘A spatial analysis of proximate greenspace and mental wellbeing in London’, Applied Geography,Volume 109,2019.
       Sourced at https://www.sciencedirect.com/science/article/pii/S0143622818312384
    4
      https://www.salud.carlosslim.org/english2/living-near-green-spaces-is-associated-with-a-lower-risk-of-met abolic-syndrome/#:~:text=NOTICIAS-,Living%20near%20
       green%20spaces%20is%20associated%20with%20a%20lower%20risk,conditions%2C%20including%20obesity%20and%20hypertension.

4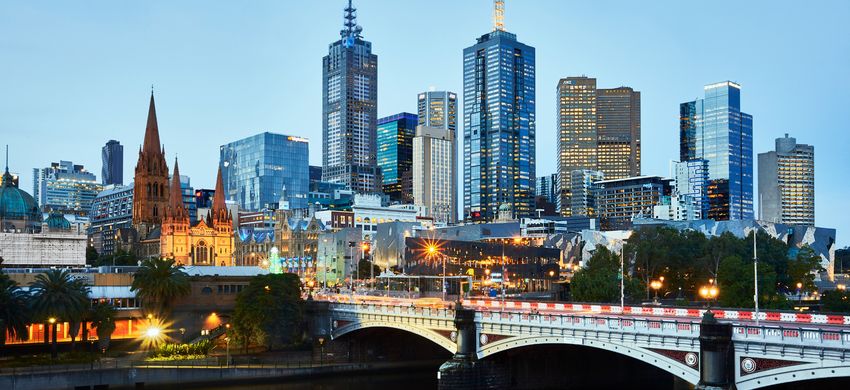
Proximity to nature
    positively impacts
    urban housing
    prices – in some
    settings
    A meta-analysis of 37 hedonic pricing studies across Europe,
    North America and Australasia found that urban nature, such
    as parks and forests, has positive impacts on house value in
    the areas surrounding it.5 The authors then further
    interrogated this relationship through a detailed case study in
    the Dutch city of Utrecht, finding that the presence of urban
    nature such as reserves, green corridors and play-spaces drove
    increases in local property values of up to 20% compared to
    areas in which urban nature was absent. The analysis
    concluded that both organically situated and man-made urban
    nature settings can offer both human and price benefits, and
    that this may apply across a wide range of locations and
    settings.

    Closer to home, the 2013 study ‘Valuing Victoria’s Parks’6
    showed a 5-7% increase in home value for properties
    immediately adjacent to parks in Melbourne, with similar data
    also found for Perth by McIntosh et al. in 2014.7 Lockwood &
    Tracy’s 1995 analysis hints at potential price effects in Sydney,
    although it deals with a very specific scenario of proximity to
    Centennial Park.8

    5
      B rander, L. & Koetse, M., The value of urban open space: Meta-analyses of
      contingent valuation and hedonic pricing results. Journal of Environmental
      Management, 16 July 2011.
    6
       Parks Victoria (2015). Valuing Victoria’s parks, Parks Victoria, Melbourne. Sourced
      at https://soe.environment.gov.au/theme/built-environment/topic/2016/
      livability-urban-amenity.
    7
        McIntosh J, Trubka R & Newman P (2014). Can value capture work in a car-
      dependent city? Willingness to pay for transit access in Perth, Western Australia.
      Transportation Research Part A: Policy and Practice 67:320–339.
    8
         Lockwood & Tracy, 1995. In Brander, L.M. & Koetse, M.J. The value of urban open
      space : Meta-analyses of contingent valuation and hedonic pricing results. Journal
      of Environmental Management, 16 July 2011.

5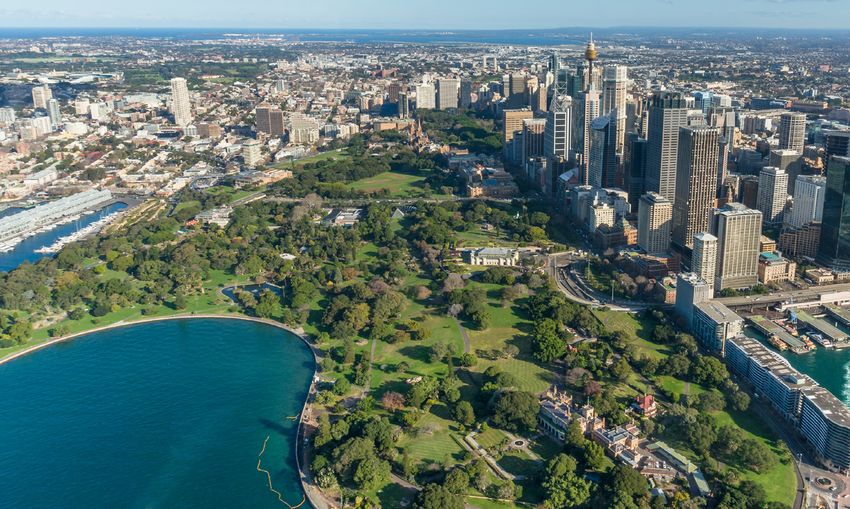
Case Study – Sydney
    and Surrounds:
    Association between proximal greenspace
    and house prices

    Our case study evaluates the extent to which the presence of                         Other property features known to influence price such as land
    greenspace in general and more intensely vegetated                                   size, distance to employment, build quality and number of
    greenspace forested with trees more than 3m in height co-vary                        bedrooms are likely to interact with and mediate the influence
    with residential property prices, based on transactions across                       of greenspace. Our intention here is to determine if there are
    Greater Sydney in 2019. We define these two greenspace types                         indications of a price effect, in order to establish the case for a
    as ‘greenspace’ and ‘tree cover’ for the purpose of this analysis.                   more detailed nationwide study prepared in the coming
                                                                                         months.
    As a representation of these greenspace measures, we
    leveraged a pre-aggregated mesh block level summary of NDVI                          Preliminary analysis of data indicated mesh block pricing data
    data prepared by the NSW Dept. of Planning, Industry &                               was sparse in some locations due to small geographic area and
    Environment 9. The dataset leverages multi-spectral remote                           low housing turnover. This created some noise in the data
    sensing data from satellite imagery, providing coverage in                           making trends harder to extract. A decision was therefore
    square metres of trees > 3m in height, shrubs, open green                            made to utilise SA2, with a mean area of 6km2 instead of the
    space/ grassed area and total ‘greenspace’ as well as mesh                           more granular mesh block with areas as small as 400m2. Whilst
    block area, also in square metres.                                                   this does lose some of the precision in terms of maximum
                                                                                         distance to greenspace, the volume of sales transactions was
    To provide the price inputs, residential property listing and sale                   sufficiently larger to improve stability of results.
    data for the 2019 calendar year was extracted from CoreLogic’s
    proprietary database at a property level. We elected to use the                      We analysed the interactions between price and greenspace
    2019 calendar year as our initial sample as the 2020 property                        for Sydney overall and for the seven planning districts within
    market had highly irregular characteristics due to COVID-19.                         Sydney as defined by the NSW Dept. of Planning, Industry and
    Sales volume, contract price, time on market, price premium                          Environment. Each district of Sydney contains a different mix of
    and price growth metrics were generated at mesh block and                            private greenspace and public greenspace, as shown in the
    Statistical Area 2 (SA2) level for analysis. We defined ‘price                       table below. Public greenspace and public tree cover levels are
    premium’ as a sale price in excess of the property’s listing price.                  exceptionally high across the North. The more intensely
                                                                                         populated Central and Eastern areas of the city have low levels
    This case study is necessarily brief and intentionally does not                      of both private and public greenspace, and we expect that this
    attempt to establish a causal effect of greenspace on price.                         may influence the value placed on greenspace due to scarcity in
                                                                                         these districts.

    % of District area classed in each greenspace category

                                         Western             Eastern          Central                                                            Other
                                                                                                 North           South          Illawarra
                                          City                 City            City                                                              South

        Private Greenspace                 32.8%              21.1%            17.1%             11.6%           10.0%            0.0%            0.0%

        Private Tree Cover                 10.2%               7.2%             6.4%              8.0%            5.3%            0.0%            0.0%

        Public Greenspace                  19.4%              16.0%            14.4%             47.3%           53.1%            0.0%           12.6%

        Public Tree Cover                  11.9%               7.9%             9.1%             36.6%           35.9%            0.0%            7.8%

        SA2s                                 74                 62               60                52              52               1               1

6   9
        https://data.gov.au/dataset/ds-nsw-96d5f9a6-af2c-45f9-8966-3741dfc34f02/details?q=vegetation%20cover
Geographical bounds of ‘Districts’ used by NSW Dept. of Planning, Industry & Environment

                                                                                                                                        District
                                                                                                                                            Central City
                                                                                                                                           Eastern City
                                                                                                                                           Illawarra
                                                                                                                                           North
                                                                                                                                           Other - South
                                                                                                                                           South
                                                                                                                                           Western City

ude (generated). Color shows details about District. Details are shown for Sa2 Name16.

                       Using the SA2 level dataset we computed the strength of association between a subset of greenspace metrics and the selected
                       pricing metrics using Pearson Correlation, with ANOVA F test used to test the significance of each relationship. The variables were
                       then plotted and a linear regression line of best fit calculated against each of the price variables.

                       Correlation matrix for greenspace and price metrics across Sydney Basin sample

             7
Correlation coefficients and indicators of significance for greenspace and price metrics

                                                                            % public                                 % public tree                          % private                                  % private tree
                                                                            greenspace at SA2                        cover at SA2                           greenspace at SA2                          cover at SA2

                          Average unit sale price                           0.150                                    0.193                                  -0.028                                     0.317
                          at SA2                                            p=0.012                                  p=0.001                                p=0.645                                    P< 0.001

                          Average house sale                                0.076                                    0.107                                  -0.013                                     0.326
                          price at SA2                                      p=0.201                                  p=0.069                                p=0.825                                    p
Relationship between SA2 % of private
greenspace and house sale price (2019)
for Sydney Eastern Suburbs
Greenspoace SA2 relationships (2)
Avg. total MB area
467,895
6000K
2,000,000
4,000,000
5500K 6,000,000
8,000,000
5000K 10,000,000
11,877,539
4500K House Sale Vol 2019
1 840
4000K
Avg House Sale Price 2019
3500K
3000K
Greenspoace SA2 relationships (2)
2500K Avg. total MB area
467,895
6000K
2000K 2,000,000
4,000,000
5500K 6,000,000
1500K
8,000,000
5000K 10,000,000
1000K 11,877,539
4500K House Sale Vol 2019
500K 1 840
4000K 0K
Avg House Sale Price 2019
0.00 0.02 0.04 0.06 0.08 0.10 0.12 0.14 0.16 0.18 0.20
3500K
% Private Tree Cover
Sum of % Private Tree Cover vs. sum of Avg House Sale Price 2019. Color shows sum of House Sale Vol 2019. Size shows
3000K
average of total MB area. Details are shown for Sa2 Name16. The data is filtered on District, which keeps Eastern City.
The view is filtered on Sa2 Name16, which excludes Dural - Kenthurst - Wisemans Ferry.
2500K
2000K
1500K
1000K
500K
0K
0.00 0.02 0.04 0.06 0.08 0.10 0.12 0.14 0.16 0.18 0.20
% Private Tree Cover
Sum of % Private Tree Cover vs. sum of Avg House Sale Price 2019. Color shows sum of House Sale Vol 2019. Size shows
Where can I find a
average of total MB area. Details are shown for Sa2 Name16. The data is filtered on District, which keeps Eastern City.
The view is filtered on Sa2 Name16, which excludes Dural - Kenthurst - Wisemans Ferry.
‘green’ place to live?
For property hunters wanting to seek out the benefits of living
alongside greenspace there are many options across Sydney.
The scale and quality of greenspace, both public and private,
differs widely across the metropolitan area. The Northern
Beaches and Sutherland shire and the lower Blue Mountains
offer the largest number of well-greened localities, although
with the exception of lower Blue Mountains, this amenity does
come at a price.
9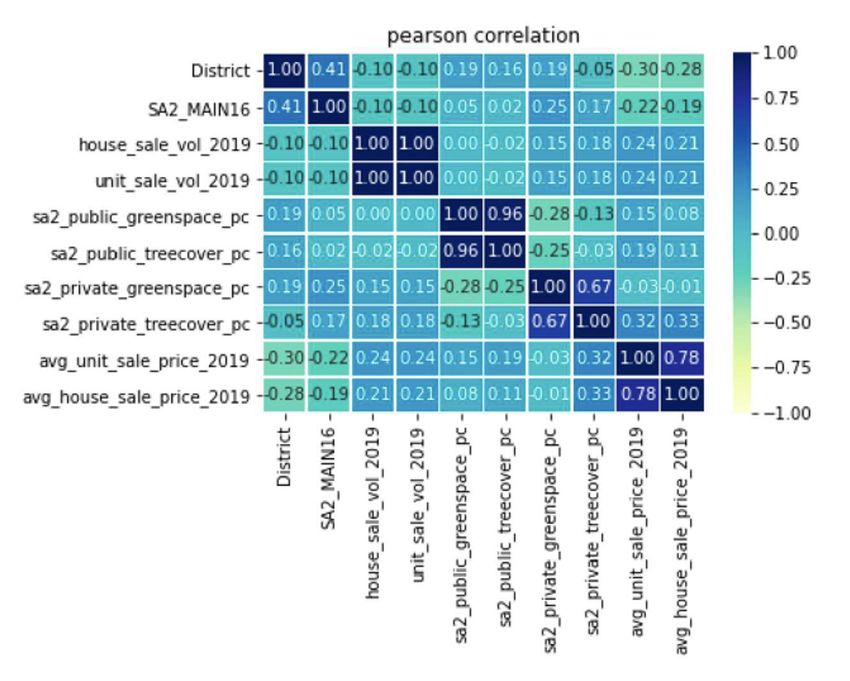
Highest % of private tree cover (top 10)

                                                                                                                                Avg. House Sale                               Avg. Unit Sale               Avg. % Private
       SA2                                         SA4
                                                                                                                                Price 2019                                    Price 2019                   Tree Cover

       Avalon - Palm Beach                         Sydney - Northern Beaches                                                    $2,657,696                                    $744,868                     27.90%

       Newport - Bilgola                           Sydney - Northern Beaches                                                    $1,938,216                                    $946,017                     25.90%

       Holsworthy - Wattle
                                                   Sydney - South West                                                          $815,484                                      $623,262                     25.10%
       Grove

       Lindfield - Roseville                       Sydney - North Sydney and Hornsby                                            $2,612,073                                    $1,073,009                   24.40%

                                                   Sydney - Baulkham Hills and
       Castle Hill - South                                                                                                      $1,463,534                                    $753,136                     24.30%
                                                   Hawkesbury

       Pymble                                      Sydney - North Sydney and Hornsby                                            $2,216,293                                    $1,015,880                   23.70%

       Gymea - Grays Point                         Sydney - Sutherland                                                          $1,184,108                                    $808,798                     23.40%

       Chatswood (West) -
                                                   Sydney - North Sydney and Hornsby                                            $1,961,881                                    $849,677                     23.10%
       Lane Cove North

       Lilli Pilli - Port
                                                   Sydney - Sutherland                                                          $2,159,055                                    $1,365,000                   22.60%
       Hacking - Dolans Bay

       Wahroonga (East) -
                                                   Sydney - North Sydney and Hornsby                                            $2,194,839                                    $1,101,957                   22.10%
       Warrawee

     Top 10 SA2s for % private tree cover
     Top 10 private tree cover

           Avg. % Private Tree Cov..
                                                                                                                                                                                               Avalon - Palm Beach
            0.22104                   0.27909
                                                                                                                                                                                              Newport - Bilgola

                                                                                                                                               Wahroonga (East) - Warrawee

                                                                                                                         Castle Hill - South

                                                                                                                                                              Pymble
                                                                                                                                                                   Lindfield - Roseville

                                                                                                                                                      Chatswood (West) - Lane Cove North

                                                                                                    Holsworthy - Wattle Grove

                                                                                                                                          Gymea - Grays Point
                                                                                                                                           Lilli Pilli - Port Hacking - Dolans Bay

      © 2021 Mapbox © OpenStreetMap

     Map based on Longitude (generated) and Latitude (generated). Color shows average of % Private Tree Cover . The marks are labeled by Sa2 Name16. Details are shown for Sa2 Name16. The data is filtered on Top 10 Private tree cover, which keeps 10 members.

10
Highest % of public tree cover (top 10)
Avg. House Sale Avg. Unit Sale Avg. % Public
SA2 SA4
Price 2019 Price 2019 Tree Cover
Berowra - Brooklyn -
Sydney - North Sydney and Hornsby $1,007,297 $738,500 68.50%
Cowan
Heathcote - Waterfall Sydney - Sutherland $912,937 $662,500 65.10%
Terrey Hills - Duffys
Sydney - Northern Beaches $2,185,206 $585,000 61.30%
Forest
Asquith - Mount Colah Sydney - North Sydney and Hornsby $1,065,767 $660,995 54.30%
Woronora Heights Sydney - Sutherland $1,095,702 $976,250 50.70%
Turramurra Sydney - North Sydney and Hornsby $1,924,818 $993,229 50.30%
Menai - Lucas Heights -
Sydney - Sutherland $998,368 $738,072 46.70%
Woronora
Helensburgh Illawarra $941,500 $726,368 46.20%
Blaxland - Warrimoo - Sydney - Outer West and Blue
$767,564 $524,875 42.80%
Lapstone Mountains
Wahroonga (East) -
Sydney - North Sydney and Hornsby $2,194,839 $1,101,957 22.10%
Warrawee
Top 10 SA2s for % public tree cover
Top 10 public tree cover
Avg. % Public Tree Cover
Berowra - Brooklyn - Cowan
0.4234 0.6845
Asquith - Mount Colah
Bayview - Elanora Heights
Terrey Hills - Duffys Forest
Turramurra
Blaxland - Warrimoo - Lapstone
Menai - Lucas Heights - Woronora
Heathcote - Waterfall
Helensburgh
© 2021 Mapbox © OpenStreetMap
Map based on Longitude (generated) and Latitude (generated). Color shows average of % Public Tree Cover. The marks are labeled by Sa2 Name16. Details are shown for Sa2 Name16. The data is filtered on Top 10 public tree cover, which keeps 10 members.
11Highest % of private greenspace (top 10)
Avg. House Sale Avg. Unit Sale Avg. % Private
SA2 SA4
Price 2019 Price 2019 Greenspace
Cobbitty - Leppington Sydney - South West $762,823 $641,230 68.30%
Austral - Greendale Sydney - South West $1,456,156 60.00%
Horsley Park - Kemps
Sydney - South West $2,820,800 53.10%
Creek
Mulgoa - Luddenham - Sydney - Outer West and Blue
$1,418,762 $435,500 50.10%
Orchard Hills Mountains
Rosemeadow - Glen
Sydney - Outer South West $618,186 $356,760 48.50%
Alpine
Camden - Ellis Lane Sydney - Outer South West $854,407 $365,250 47.00%
The Oaks - Oakdale Sydney - Outer South West $941,984 46.40%
Sydney - Outer West and Blue
Richmond - Clarendon $644,514 $464,102 45.70%
Mountains
Claymore - Eagle Vale -
Sydney - Outer South West $598,922 $455,807 44.10%
Raby
Sydney - Baulkham Hills and
Pitt Town - McGraths Hill $1,047,458 $296,916 42.00%
Hawkesbury
0 private green space
Top 10 SA2s for % private greenspace
Avg. Private green map..
0.4205 0.6825
Pitt Town - McGraths Hill
Richmond - Clarendon
Horsley Park - Kemps Creek
Mulgoa - Luddenham - Orchard Hills
Austral - Greendale
Cobbitty - Leppington
Claymore - Eagle Vale - Raby
The Oaks - Oakdale
Camden - Ellis Lane
Rosemeadow - Glen Alpine
apbox © OpenStreetMap
d on Longitude (generated) and Latitude (generated). Color shows average of Private green map top 10. The marks are labeled by Sa2 Name16. Details are shown for Sa2 Name16. The data is filtered on SA2 Top 10 % Private Greenspace, which keeps 10 memb
12Highest % of public greenspace (top 10)
Avg. House Sale Avg. Unit Sale Avg. % Public
SA2 SA4
Price 2019 Price 2019 Greenspace
Heathcote - Waterfall Sydney - Sutherland $912,937 $662,500 80.50%
Berowra - Brooklyn - Cowan Sydney - North Sydney and Hornsby $1,007,297 $738,500 78.10%
Terrey Hills - Duffys Forest Sydney - Northern Beaches $2,185,206 $585,000 75.00%
Asquith - Mount Colah Sydney - North Sydney and Hornsby $1,065,767 $660,995 66.30%
Menai - Lucas Heights -
Sydney - Sutherland $998,368 $738,072 64.10%
Woronora
Bayview - Elanora Heights Sydney - Northern Beaches $1,871,173 $1,718,333 57.80%
Woronora Heights Sydney - Sutherland $1,095,702 $976,250 57.40%
Turramurra Sydney - North Sydney and Hornsby $1,924,818 $993,229 57.00%
Helensburgh Illawarra $941,500 $726,368 56.20%
Manly Vale - Allambie
en space Sydney - Northern Beaches $1,795,332 $772,182 52.70%
Heights
Top 10 SA2s for % public greenspace
Avg. % Public Greenspa..
0.5270 0.8048
Berowra - Brooklyn - Cowan
Asquith - Mount Colah
Terrey Hills - Duffys Forest
Turramurra Bayview - Elanora Heights
Manly Vale - Allambie Heights
Menai - Lucas Heights - Woronora
Heathcote - Waterfall
Helensburgh
p
erated) and Latitude (generated). Color shows average of % Public Greenspace. The marks are labeled by Sa2 Name16. Details are shown for Sa2 Name16. The data is filtered on Top 10 Public greenspace, which keeps 10 members.
13Conclusion
We can see some tentative indicators of value placed on A more detailed hedonic pricing analysis looking at the wider
greenspace in the Sydney metropolitan market but it does not Australian market is planned, so as to fully draw out the
appear to be a significant factor in pricing at this point in time. relationship between greenspace and property prices.
This may in part come down to the fact that our city has far
greater amounts of greenspace than many of the cities As we mark Earth Day 2021, following two years of
analysed in Europe – for example, Sydney has 46% public extraordinary and extreme climate events, we hope this
greenspace whilst Amsterdam has 13% and London 33%. In analysis prompts some readers to reflect on the potential
cities where accessible greenspace is scarce, it is possible that benefits we gain in living alongside nature and caring for our
this scarcity has led residents and authorities to begin to place greenspace, in the cities and beyond.
more value on it.
We also note that the Sydney market is not necessarily an
accurate reflection of other Australian or New Zealand
residential markets, and that a wider geographic analysis may
present different results.
corelogic.com.au
©2021 CoreLogic, Inc. All Rights Reserved.
14
This material may not be reproduced in any form without express written permission.You can also read