Implementation of Long Short-Term Memory and Gated Recurrent Units on Grouped Time-Series Data to Predict Stock Prices Accurately
←
→
Page content transcription
If your browser does not render page correctly, please read the page content below
Implementation of Long Short-Term Memory and Gated Recurrent Units on Grouped Time-Series Data to Predict Stock Prices Accurately Armin Lawi ( armin@unhas.ac.id ) Hasanuddin University https://orcid.org/0000-0003-1023-6925 Hendra Mesra Hasanuddin University Supri Amir Hasanuddin University Method Article Keywords: Forecasting Methods, Time-Series Forecasting, Deep Learning, Stock Price, Recurrent Neural Network, Long-Short Term Memory, Gated Recurrent Unit, Forecasting Accuracy Posted Date: November 8th, 2021 DOI: https://doi.org/10.21203/rs.3.rs-1057875/v1 License: This work is licensed under a Creative Commons Attribution 4.0 International License. Read Full License
Springer Nature 2021 LATEX template

       Implementation of Long Short-Term Memory and Gated
       Recurrent Units on Grouped Time-Series Data to Predict
                       Stock Prices Accurately
                           Armin Lawi, Hendra Mesra† and Supri Amir†
     Department of Information Systems, Hasanuddin University, Jl. Perintis Kemerdekaan
                    Km. 10, Makassar, 90245, South Sulawesi, Indonesia.

                    *Corresponding author(s). E-mail(s): armin@unhas.ac.id;
                Contributing authors: hendra@unhas.ac.id; supriamir@unhas.ac.id;
                        † These authors contributed equally to this work.

                                                   Abstract
     Stocks are an attractive investment option since they can generate large profits compared to
     other businesses. The movement of stock price patterns on the stock market is very dynamic;
     thus it requires accurate data modelling to forecast stock prices with a low error rate. Fore-
     casting models using Deep Learning are believed to be able to accurately predict stock price
     movements using time-series data, especially the Long Short-Term Memory (LSTM) and Gated
     Recurrent Unit (GRU) algorithms. However, several previous implementation studies have not
     been able to obtain convincing accuracy results. This paper proposes the implementation of the
     forecasting method by classifying the movement of time-series data on company stock prices
     into three groups using LSTM and GRU. The accuracy of the built model is evaluated using
     loss functions of Rooted Mean Squared Error (RMSE) and Mean Absolute Percentage Error
     (MAPE). The results showed that the performance evaluation of both architectures are accu-
     rately in which GRU is always superior to LSTM. The highest validation for GRU was 98.73%
     (RMSE) and 98.54% (MAPE), while the LSTM validation was 98.26% (RMSE) and 97.71% (MAPE).

     Keywords: Forecasting Methods, Time-Series Forecasting, Deep Learning, Stock Price, Recurrent Neural
     Network, Long-Short Term Memory, Gated Recurrent Unit, Forecasting Accuracy.

1 Introduction                                             and it requires careful attention to stock price
                                                           movements [1]. Technical factors are one of the
Stocks or shares are securities that confirm the           methods that is used in learning the prediction
participation or ownership of a person or entity           of stock price movements through past historical
in a company. Stocks are an attractive investment          data patterns on the stock market [2]. Therefore,
option because they can generate large profits             forecasting models using technical factors must
compared to other businesses, however, the risk            be careful, thorough, and accurate, to reduce risk
can also result in large losses in a short time. Thus,     appropriately [3].
minimizing the risk of loss in stock buying and                There are many stock trading prediction mod-
selling transactions is very crucial and important,        els have been proposed, and mostly using technical

                          1
Springer Nature 2021 LATEX template

factor on daily stock trading as the data features,    and the Brazilian markets are more data driven
i.e., high, low, open, close, volume and change        compared to the Swedish market. [9].
prices. The high and low prices are, respectively          This paper proposes a method of implementing
the achievement of the highest and lowest prices in    and evaluating the LSTM and GRU Neural Net-
a day. The open and close prices are the opening       work architecture to build a stock price forecasting
and closing prices of the day, respectively. Volume    model in grouped time-series data using techni-
is the number of exchanges traded, and change is       cal factor and measuring forecasting accuracy. The
the percentage of price movements over time [4, 5].    investigation uses seven years of benchmark data
     Nowadays, the development of computing            on daily stock price movements with the same fea-
technology to support Deep Learning (DL) is            tures as several previous related works to show
growing very rapidly, one of which is the use of the   differences in results. Therefore, there are three
Graphics Processing Unit (GPU) that supports           main contributions of this paper in the following
data learning. The data training process will be       context: First, a forecasting method framework is
many times faster when using a GPU compared            proposed using a Deep Learning approach which is
to a regular processor [6]. Recurrent Neural Net-      structured in three stages, i.e., data preparation,
work (RNN) is one of the DL prediction models          model development, and performance evaluation.
on time-series data such as stock price movements.     The second contribution is a mechanism for group-
The RNN algorithm is a type of neural network          ing time series data of 9 companies into 3 groups of
architecture whose processing is called repeat-        stock prices, i.e., low, medium, and high (each of
edly to process input which is usually sequential      which consisting of 3 companies) is used as a group
data. Therefore, it is very suitable for predict-      share price that forms a pattern of movement in
ing stock price movements [6, 7]. There are two        the stock market. Finally, the third contribution,
most widely used RNN development architectures,        the resulting forecasting performance evaluation
i.e., Long Short-Term Memory (LSTM) and Gated          is better than the previous related work investiga-
Recurrent Unit (GRU).                                  tions in terms of accuracy and validation obtained
     Several previous studies predicted stock prices   using the loss function Root Mean Squared Error
with various approaches including conventional         (RMSE) and Mean Absolute Percentage Error
statistics, heuristic algorithms and also Machine      (MAPE).
Learning. Predictions generally use four value
features, i.e., open, close, high and low values,      2 Method and Materials
unfortunately the highest accuracy can only be
achieved at 73.78%. Thus the results were less         2.1 Proposed Method
realistic and not in accordance with the actual
stock price [8]. Meanwhile, another study used         In general, the proposed investigation method
Deep Learning approach of the LSTM neural net-         mainly consists of three stages, i.e., the pre-
work to estimate financial time series on returns      processing or data preparation, data processing
data from three stock indices of different market      or model building and validation, and finally the
sizes, i.e., the large NYSE S&P 500 market in the      post-processing or performance evaluation. The
US, the emerging market Bovespa 50 in Brazil,          method workflow is depicted in Fig. 1 and its
and OMX 30 as a small market in Sweden. They           stages are explained in the following sub-sections.
showed the output of the LSTM neural network is
very similar to the conventional time series model     2.2 Data Sources
of ARMA(1,1)-GJRGARCH(1,1) with regression             The data used in this experimental inves-
approach. However, when trading strategies are         tigation is the New York Stock Exchange
implemented based on the direction of change,          (NYSE) S&P 500 historical prices company
deep LSTM networks far outperform time series          dataset obtained from the Kaggle website
models. This indicated the weak form of the effi-      (https://www.kaggle.com/camnugent/sandp500).
cient market hypothesis does not apply to the          This benchmark data contains a collection of
Swedish market, while it does to the US and            stock data from 501 companies listed on the
Brazilian markets. It also suggested the American      NYSE. There were 851,264 total data recorded,
Springer Nature 2021 LATEX template

3

    Fig. 1 Proposed LSTM and GRU forecasting method.

    with 1,762 data per company. The number of            market on every holiday, including Saturdays and
    companies with complete data is 467, whereas 34       Sundays. In the table, there are no holidays in
    companies have incomplete data (missing value)        the stock time series, for instance data from 2010-
    due to new companies listed on NYSE with              01-08 jumps to 2010-01-11, which means no stock
    shorter date ranges. The investigated data are        trading behavior that occurs on Saturdays and
    selected from several companies that represent        Sundays.
    the complete company data.                                 Fig. 2 shows the time-series graph of the Ama-
                                                          zon for 7 years from the beginning of 2010 to the
    Table 1 An example complete data of Amazon (AMZN)     end of 2016. In the graph, it is clear that the close,
                                                          open, high, and low price positions in one trading
          Date       Open     Close    Low      High      day are almost the same. Therefore, the data anal-
        2010-01-04   136,25   133,90   133,14   136,61
                                                          ysis process is focused on the close price feature,
        2010-01-05   133,43   134,69   131,81   135,48    i.e., the daily closing price for each stock. This is
        2010-01-06   134,60   132,25   131,65   134,73    because the close price is the most important price
        2010-01-07   132,01   130,00   128,80   132,32    in conducting technical analysis between open,
        2010-01-08   130,56   133,52   129,03   133,68
        2010-01-11   132,62   130,31   129,21   132,80
                                                          high, and low prices. The closing price also reflects
        2010-01-12   128,99   127,35   126,55   129,82    all information available to all market participants
             .
             .
                       .
                       .
                                 .
                                 .
                                          .
                                          .
                                                   .
                                                   .      at the end of the stock trading.
             .         .         .        .        .
        2016-12-30   766,47   749,87   748,28   767,40
                                                          2.3 Long Short-Term Memory
                                                          Long Short-Term Memory (LSTM) is a variant
        Table 1 shows an example of the complete          of Recurrent Neural Networks (RNN) that allows
    company data for Amazon with 1,762 data. Stock        long-term memory. As it is known that RNN
    time-series data recorded for 7 years, from January   learns by re-propagating the gradient, but the
    4, 2010, to December 30, 2016. It should be noted     gradient disappears or diverges as the t becomes
    that the S&P 500 data does not trade the stock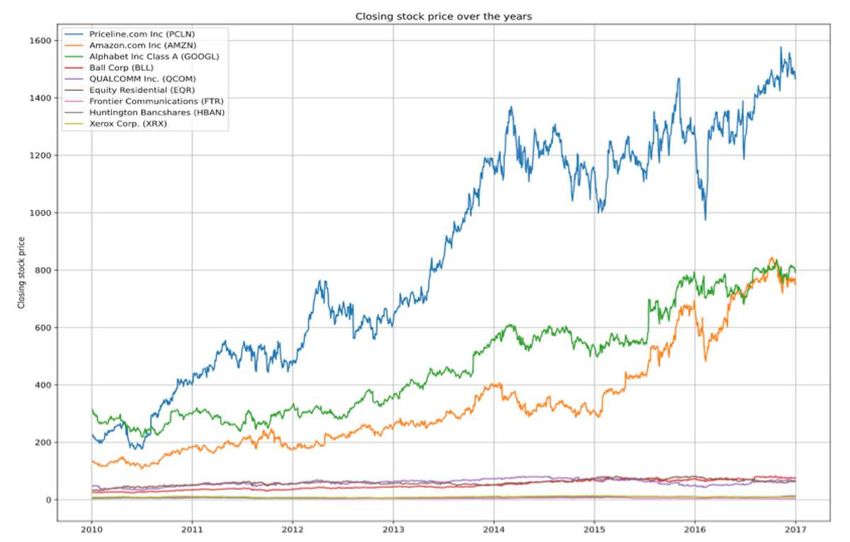
Springer Nature 2021 LATEX template

Fig. 2 An example of stock price time-series data of Amazon.

longer. Therefore, it has been found that ordinary
RNNs do not train long-term memory-dependent
serial data properly. LSTM is proposed as one of
the algorithms to remedy this problem. LSTM has
variable Ct for long-term information storage in
LSTM cells or blocks. Then, the old information is
removed or new information is updated to the Ct
variable to activate the corresponding long-term
memory. LSTM is currently applied to language
translation, speech recognition, text generation,
and more [11–13].
    In a normal RNN, data is propagated in the
order of the input, intermediate, and output lay-              Fig. 3 Structure of the LSTM block and its gates.
ers before the results are passed to the next block.
LSTM has the same mechanism, however, the
                                                                  long-term memory in the current cell state. C̃t
intermediate layer of RNN only has one activa-
                                                                  is calculated using Eq. 1.
tion function such as a neural network, whereas
this layer in LSTM has several activation func-
                                                                          C̃t = tanh(wC xt + uc ht−1 + bc ).       (1)
tions and complicated operations as its gates are
performed. The arithmetic portion in the interme-
                                                                  C̃t does not need to store all the information
diate layer of the LSTM is called the cell or block
                                                                  in long-term memory, but it stores only the
of the LSTM. The structure of the LSTM block
                                                                  necessary information efficiently. Therefore, C̃t
and its gates is given in Fig. 3.
                                                                  should be evaluated by a storage rate it . The
    The following is a brief description of the
                                                                  storage rate it is calculated using Eq. 2 from xt
LSTM gates and their respective computations
                                                                  and ht−1 .
according to the purpose of their operation.
1. Input Gate. This gate receives two inputs;                                it = σ(wi xt + ui ht−1 + bi ).        (2)
   i.e., xt and the output value ht−1 of the pre-
   vious cell, in order to store C̃t as a candidate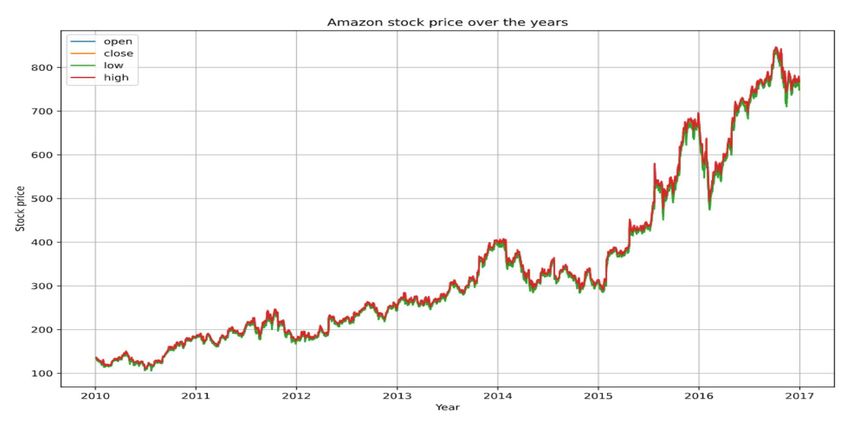
Springer Nature 2021 LATEX template

5

    2. Forgetting Gate. This gate controls to for-           1. Reset Gate. The memory rate rt is calculated
       get information from long-term memory. The               using Eq. 7 with input is the current input
       storage rate ft is calculated using Eq. 3.               data xt and the information (long-term mem-
                                                                ory) ht−1 transmitted from the previous state.
               ft = σ(wf xt + uf h( t − 1) + bf )      (3)      This gate controls the long-term memory is for-
                                                                gotten or retained. The idea is almost the same
    3. Output Gate. The output value ot in the                  as the forgetting gate of LSTM.
       cell is based on the input information xt and
       ht−1 . The current long-term memory is stored                    rt = σ(wr xt + ur h( t − 1) + br )      (7)
       in ht . Eqs. ?? and 5 are used to compute ot
       and ht , respectively. The otimes operation rep-      2. Update Gate. At the update gate, the long-
       resents the Hadamard product of the matrix               term memory ht−1 is transmitted from the
       components of the same size.                             previous state and the new long-term memory
                                                                ht is created from the current input xt . The ht
                  ot = σ(wo xt + uo ht−1 + bo )        (4)      is resulted by mixing the ratio of 1−z
                                                                                                     z    with a
                                                                new candidate long-term memory h̃t . Informa-
                      ht = ot ⊗ tanh(Ct )              (5)      tion of h̃t is calculated using Eq. 8 from the
    4. Memory Update. The long-term memory                      input information xt and the reset rt from the
       Ct−1 of the previous cell appropriately forgets          long-term memory ht−1 .
       some information from the resultant ft and the
       new information it of the input gate is updated             h̃t = tanh(wh xt + ri ⊗ (uh ht−1 ) + bh )    (8)
       using Eq. 6 for the latest long-term memory Ct .
                                                                The ratio zt is obtained using Eq. 9, which
                  Ct = (ft ⊗ Ct−1 + it ⊗ C̃t )         (6)      activates the old long-term memory and the
                                                                current input.
    2.4 Gated Recurrent Unit
                                                                          zt = σ(wz xt + uz ht−1 + bz )         (9)
    The Gated Recurrent Unit (GRU) is another RNN
    that enables long-term memory with more simple              Finally, the long-term memory ht is updated
    structure than LSTM. The GRU architecture is                using Eq. 10 and it is passed to the next state.
    also proposed to solve the vanishing gradient prob-
    lem. Fig. 4 depicts the GRU block structure and                     ht = zt ⊗ h̃t + (1 − zt ) ⊗ ht−1       (10)
    its two gates.
                                                             2.5 Performance Measurement
                                                             In the context of predictive model optimization,
                                                             the function used to evaluate the performance
                                                             model is the loss error function or the differ-
                                                             ence between the actual and predictive of the
                                                             response/label values. The loss function in this
                                                             paper uses Rooted Mean Square Error (RMSE)
                                                             and Mean Absolute Percentage Error (MAPE).
                                                             Equations 11 and 12 give the calculation formulas
                                                             for RMSE and MAPE values, respectively [14–16].
                                                                                 v
                                                                                 u n
                                                                                 u1 X
                                                                        RMSE = t          (yi − ŷi )2 ,  (11)
                                                                                    n i=1
    Fig. 4 Structure of the GRU block and its gates.                                    n
                                                                                     1 X yi − ŷi
                                                                         MAPE =            |      |,           (12)
                                                                                     n i=1   yi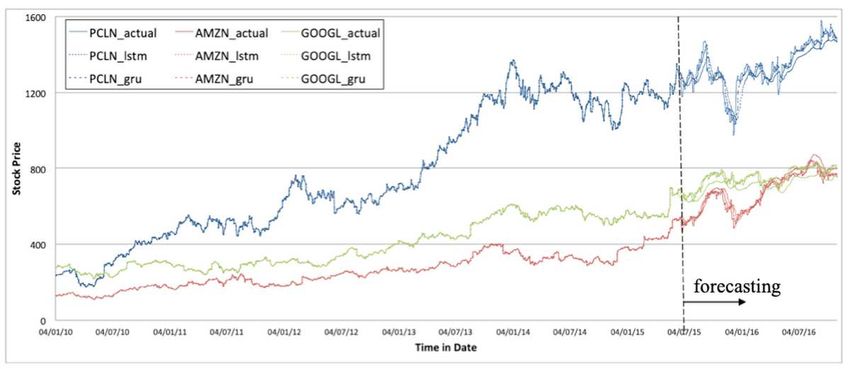
Springer Nature 2021 LATEX template

where n, yi and ŷi are the number of data, the         the actual price pattern.
actual and prediction of the ith data, respectively.
The validation and accuracy metrics of the model                                xi − min(x)
                                                                      x′i =                              (13)
are determined by the error value based on the                                max(x) − min(x)
RMSE and MAPE by extracting them from 1.
                                                        Table 2 presents a fragment result of the original
                                                        data and the normalized data.
3 Result and Discussion
                                                        Table 2 Data normalization using rescaling Max-Min.
3.1 Preprocessing Result
Preprocessing or data preparation is a very impor-           No     Original Data     Normalized Data
tant stage to make the raw data into quality data             1       133.899994           0.034373
that is ready to be processed according to model              2       134.690002           0.035447
development needs to model evaluation. It is the              3       132.250000           0.032130
                                                               ..           ..                 ..
initial data processing in advance to be trained                .            .                  .
in building the model while being validated up               1761     7 65.150024          0.892341
to data testing to evaluate the performance of               1762     749.869995           0.871573
the built model. The following are four sequential
steps in the data preprocessing stage.

3.1.1 Company Grouping                                  3.1.3 Data Segmentation
There were nine selected companies with com-            Segmentation is the process of separating and
plete time-series data to be grouped into three         grouping data, from raw data into grouped data
groups based on the company’s stock prices; i.e.,       and response data required by the system [6]. At
the higher, medium, and lower stock price. The          this stage, the data is grouped into many timestep
selec-tion of the nine companies is considered to       data with a size of 40 historically ordered data and
represent the same technical price behavior that        the 41st data being forecast data for the model.
occurs in the NYSE stock market. Companies in           The longer the size of the timestep will produce a
the higher-stock group include Priceline (PCLN),        better forecast, however, it requires a longer com-
Amazon (AMZN), and Google (GOOGL). In the               putational training time. The timestep grouping
group of medium stock price companies are Ball          always shifts to the right one step until it reaches
Corp (BLL), Qualcomm (QCOM), and Equity                 the last timestep. Illustration of data segmenta-
Residential (EQR). Companies in the lower stock         tion is given in Fig. 6. The process of segmenting
price group are Frontier Communica-tion (FTR),          the data works as follows. The input vector of
Huntington Bancshares (HBAN), and Xerox Corp            the timestep data x is 40 consecutive data, and
(XRX). Fig. 5 clearly shows the price differ-ences      the output is a single value of the next 41st data.
between the three groups of companies.                  Therefore, the segmentation process prepares 40
                                                        ordered data, which is used to predict the next
3.1.2 Data Normalization                                41st data. This step is iterated until it reaches the
                                                        last timestep data.
The normalization is meant to rescale all data into
the same specified data range. The purpose of data
normalization is to avoid the influence of the dom-     3.1.4 Data Splitting
inant pattern of stock price behavior that has a        The segmented data were divided into training
greater value over the features of a smaller stock.     and testing data. The ratio of the distribution of
The use of the same value range will provide a          training and testing data were 4:1, i.e., 80% for
pattern of actual stock price behavior that gener-      training and 20% for testing of all available data.
ally applies or occurs in a stock exchange market       The training data is the first 5 years and 6 months
[10]. This process scales the stock data values into    of the company’s time-series stock price data, and
a value range from 0 to 1. The Min-Max normal-          the testing data is the last 1.5 years. The result of
ization of Eq. 13 is to keep the stock prices follows   data segmentation produces 1,762 data that are
Springer Nature 2021 LATEX template
7
Fig. 5 Visualization of the stock price time-series data of the selected nine companies.
Table 3 Parameter setting of LSTM and GRU.
Layer (Type) Output Shape Param
lstm (LSTM: tanh) 161600
(None, 40, 200)
Fig. 6 Illustration of the data segmentation. gru (GRU: tanh) 121800
lstm 1 (LSTM: tanh) 120400
(None, 40, 100)
gru 1 (GRU: tanh) 90600
divided into training data and testing data. The
data training used to build the model is 1,412 dropout (Dropout: 0.3) (None, 40, 100) 0
data (which is also model validation data) from lstm 2 (LSTM: tanh) 42240
(None, 64)
2010-01-04 to 2015-08-12, whereas the testing data gru 2 (GRU: tanh) 31872
is 350 data used for evaluate the accuracy from dense (Dense: linear) (None, 1) 65
2015-08-13 to 2016-12-30.
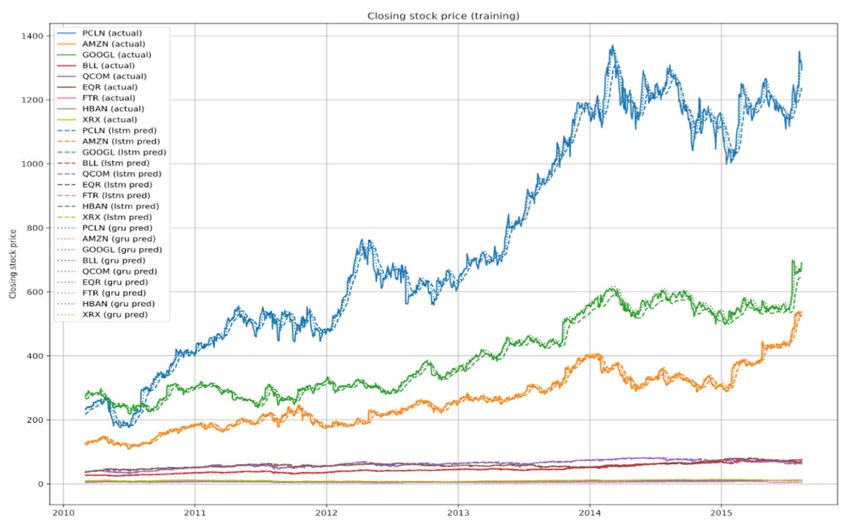
3.2 Building Trained Models results are already convergent. Model construction
information is given in Table 5.
Implementation of both the designed LSTM and The results of 1,412 training data from Jan-
GRU models are constructed the same in 3 layers; uary 4, 2010 to August 14, 2015 were validated
i.e., the input layer has 200 tanh cells with an using the LSTM and GRU trained models are
input vector of 40 lengths, the hidden layer has 200 given in Fig. 7. Visualization of the LSTM and
tanh cells with 40 input vectors, and the output GRU trained models showing the time series of
layer has 64 tanh cells. Dropout value is 0.3 and 1 the nine selected companies using training data.
dense layer or output layer. We only use 5 epochs Validation indicated by the dashed line is for the
in the training data of each company because the LSTM trained model and the dotted line for the
GRU model.
Springer Nature 2021 LATEX template
Fig. 7 Trained LSTM (dashed lines) and GRU (dotted lines) models.
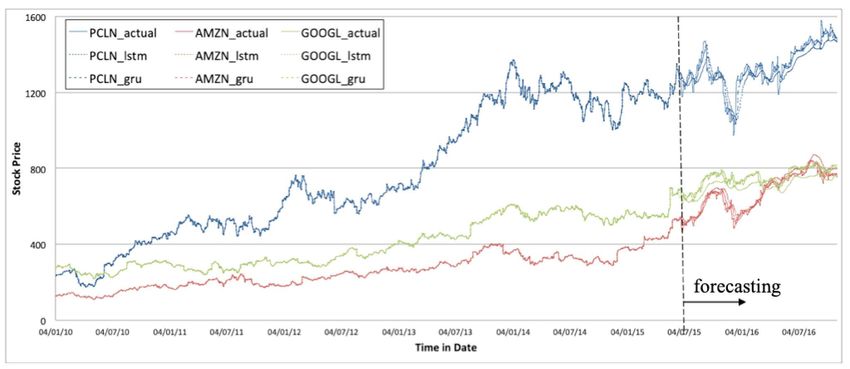
3.3 Model Validation 3.4 Discussion
Validation of the model is evaluated using the The rest of 350 data vectors as the testing data
percentage loss of RMSE and MAPE results (sub- are used to evaluate the performance of the fore-
stracted by 100%). Both trained models gave casting LSTM and GRU models. Forecasts for the
excellent validations in the range of 94.76%- three companies with higher stock prices are given
98.73%. Trained models using GRU always supe- in Fig. 8. Actual data for all time (solid line) is
rior than LSTM. The trained model validation is shown to give an idea of the stock price move-
given in Table 4. ments of the three companies with forecasted data
LSTM (dotted line) and GRU (dashed line).
Table 4 Validation of the LSTM and GRU models based Fig. 9 depicts 350 data testing as a visual com-
on RMSE and MAPE. parison of the actual data (solid line) with the
results of the LSTM (dotted line) and the GRU
RMSE Validation MAPE Validation
Company (dashed line) forecasting models. This is to give
LSTM GRU LSTM GRU an insight into the actual movement of data with
the predicted results of the remaining medium and
PCLN 97.36% 98.23% 95.97% 97.47%
AMZN 98.26% 98.73% 96.34% 97.28%
lower stock price groups.
GOOGL 96.94% 98.17% 96.65% 98.00% The summary of accuracy performance evalua-
BLL 97.60% 98.40% 97.71% 98.54% tion is presented in Table 5 where all models have
QCOM 94.76% 96.72% 96.62% 97.97% very good accuracies in the range of 93.83% to
EQR 96.39% 97.62% 97.57% 98.40%
98.42%. Models built using GRU are always supe-
FTR 95.87% 97.14% 96.48% 97.58%
HBAN 97.23% 97.64% 97.02% 97.55% rior in providing accuracy compared to LSTM.
XRX 95.43% 96.46% 97.01% 97.68% The highest accuracy for the LSTM model uses
the RMSE and MAPE measures of 95.95% and
97.56%, respectively, for Ball Corp (BLL). While
the GRU model provides the highest accuracy,
better than LSTM, using the RMSE metric withSpringer Nature 2021 LATEX template
9
Fig. 8 Forecasting companies with high stock price group with the overall data.
97.39% for Amazon (AMZN) and the MAPE mea- groups, normalizing the data by group and seg-
sure with 98.42% for Equity Residential (EQR). menting the data for further processing at a later
stage. These three levels of stock price groups
Table 5 Accuracy of the LSTM and GRU models based form the pattern of price movements in the stock
on RMSE and MAPE. market so as to produce accurate forecasts (as a
second contribution). Then at the stage of devel-
RMSE Accuracy MAPE Accuracy oping the LSTM and GRU models, validation and
Company
LSTM GRU LSTM GRU evaluation models have been built using training
data and test data, respectively. At the final stage,
PCLN 95.39% 97.04% 96.00% 97.73%
a performance evaluation has been carried out
AMZN 95.18% 97.39% 95.78% 97.80%
GOOGL 92.77% 97.26% 94.66% 98.30% by comparing the validation and accuracy values
BLL 95.95% 97.18% 97.56% 98.37% ??of the model built so that the value is main-
QCOM 93.83% 96.28% 95.61% 97.49% tained by using each validation and evaluation
EQR 95.33% 97.16% 97.29% 98.42%
model. Forecasting methods are able to predict
FTR 95.91% 97.17% 95.67% 96.94%
HBAN 94.76% 96.09% 96.28% 97.11% stock price movements according to their groups
XRX 94.87% 96.40% 96.82% 97.74% in the stock market with very good accuracy. As
the third contribution, all models have very good
and consistent accuracy in the range of 93.83% to
98.42%. The accuracy of the model built using the
GRU algorithm is always superior to the LSTM.
4 Conclusion The highest accuracy for the LSTM model uses
This paper has succeeded in building a prediction the RMSE and MAPE measures of 95.95% and
model using LSTM and GRU Neural Networks 97.56%, respectively. The GRU model provides
to forecast stock prices in groups in the stock the highest accuracy, which is better than the
market with three main contributions. The first LSTM, using the RMSE metric with 97.39% and
contribution, the forecasting method is built using the MAPE measure with 98.42%.
a Deep Learning approach framework which is
arranged in three stages, i.e., data preparation, Conflict of Interest
model development, and performance evaluation.
The authors declare no conflict of interest.
At the data preparation stage, the data has been
grouped based on the stock price level into threeSpringer Nature 2021 LATEX template
Fig. 9 Forecasting 350 days of (a) the medium and (b) lower stock price groups.
References [4] Srivastava, Praveen Ranjan, Zuopeng Justin
Zhang, and Prajwal Eachempati. ”Deep Neu-
[1] Chen, Wei, Haoyu Zhang, Mukesh Kumar ral Network and Time Series Approach for
Mehlawat, and Lifen Jia. ”Mean?variance Finance Systems: Predicting the Movement of
portfolio optimization using ma-chine the Indian Stock Market.” Journal of Organi-
learning-based stock price prediction.” zational and End User Computing (JOEUC)
Applied Soft Computing 100 (2021): 106943. 33.5 (2021): 204-226.
[2] Troiano, Luigi, Elena Mejuto Villa, and Vin- [5] Nabipour, Mojtaba, et al. ”Predicting stock
cenzo Loia. ”Replicating a trading strategy market trends using machine learning and
by means of LSTM for financial industry deep learning algorithms via continuous and
applications.” IEEE transactions on industrial binary data; a comparative analysis.” IEEE
informatics 14.7 (2018): 3226-3234. Access 8 (2020): 150199-150212.
[3] Suyanto, Suyanto, Julia Safitri, and Arif [6] Budiharto, Widodo. ”Data science approach
Prasetya Adji. ”Fundamental and Technical to stock prices forecasting in Indonesia dur-
Factors on Stock Prices in Pharmaceutical ing Covid-19 using Long Short-Term Memory
and Cosmetic Companies.” Finance, Account- (LSTM).” Journal of big data 8.1 (2021): 1-9.
ing and Business Analysis (FABA) 3.1 (2021):
67-73. [7] Zhang, Yongjie, Gang Chu, and Dehua Shen.
”The role of investor attention in predictingSpringer Nature 2021 LATEX template
11
stock prices: The long short-term memory net-
works perspective.” Finance Research Letters
38 (2021): 101484.
[8] Yan, Xinzhi, et al. ”Exploring Machine Learn-
ing in Stock Prediction Using LSTM, Binary
Tree, and Linear Regression Algorithms.”
International Core Journal of Engineering 7.3
(2021): 373-37.
[9] Hansson, Magnus. ”On stock return prediction
with LSTM networks.” Master Thesis, Lund
University (2017).
[10] Kurani, Akshit, et al. ”A Comprehensive
Comparative Study of Artificial Neural Net-
work (ANN) and Support Vector Machines
(SVM) on Stock Forecasting.” Annals of Data
Science (2021): 1-26.
[11] Le, Xuan-Hien, et al. ”Application of long
short-term memory (LSTM) neural network
for flood forecasting.” Water 11.7 (2019): 1387.
[12] Baytas, Inci M., et al. ”Patient subtyping
via time-aware LSTM networks.” Proceedings
of the 23rd ACM SIGKDD Intfl Conf. on
Knowledge Discovery and Data Mining (2017).
[13] I. Goodfellow, Y. Bengio, and A. Courville,
Deep Learning, Boston: MIT Press (2016).
[14] Chung, Junyoung, et al. ”Empirical eval-
uation of gated recurrent neural networks
on sequence modeling.” arXiv preprint
arXiv:1412.3555 (2014).
[15] Kumar, Shailender, et al. ”A Survey on Arti-
ficial Neural Network based Stock Price Pre-
diction Using Various Meth-ods.” 2021 5th
International Conference on Intelligent Com-
puting and Control Systems (ICICCS). IEEE
(2021).
[16] Hu, Zexin, Yiqi Zhao, and Matloob Khushi.
”A survey of forex and stock price predic-
tion using deep learning.” Applied System
Innovation 4.1 (2021): 9.Figures Figure 1 Proposed LSTM and GRU forecasting method.
Figure 2

An example of stock price time-series data of Amazon.
Figure 3

Structure of the LSTM block and its gates.
Figure 4

Structure of the GRU block and its gates.
Figure 5

Visualization of the stock price time-series data of the selected nine companies.

Figure 6

Illustration of the data segmentation.
Figure 7

Trained LSTM (dashed lines) and GRU (dotted lines) models.

Figure 8

Forecasting companies with high stock price group with the overall data.
Figure 9

Forecasting 350 days of (a) the medium and (b) lower stock price groups.
You can also read