Proposed Acquisitions of 13 Properties in China and 3 Properties in Vietnam - Extraordinary General Meeting 13 January 2022

Page created by Joel Snyder
 
CONTINUE READING
Proposed Acquisitions of 13 Properties in China and 3 Properties in Vietnam - Extraordinary General Meeting 13 January 2022
Proposed Acquisitions of 13 Properties in China
         and 3 Properties in Vietnam
            Extraordinary General Meeting
                   13 January 2022
Proposed Acquisitions of 13 Properties in China and 3 Properties in Vietnam - Extraordinary General Meeting 13 January 2022
1

Disclaimer
This presentation has been prepared by Mapletree Logistics Trust Management Ltd. (in its capacity as the manager of Mapletree Logistics Trust (“MLT”, and the manager of MLT, the “Manager”)) for information purposes only and should not
be used for any other purposes. The content of this presentation has not been reviewed by any regulatory authority. The information and opinions in this presentation provided as at the date of this presentation (unless stated otherwise) are
subject to change without notice. The accuracy of such information and opinions are not guaranteed and this presentation may not contain all material information concerning MLT. None of the Manager, MLT nor any of their respective
affiliates, advisors and representatives or any of their respective holding companies, subsidiaries, affiliates, associated undertakings or controlling persons, or any of their respective directors, officers, partners, employees, agents,
representatives, advisers (including any global co-ordinator and bookrunner in respect of any equity fund raising that may be undertaken by the Manager) or legal advisers make any representation or warranty, express or implied and whether
as to the past or the future regarding, and none of them assumes any responsibility or liability whatsoever (in negligence or otherwise) for, the fairness, accuracy, completeness or correctness of, or any errors or omissions in, any information
contained herein or as to the reasonableness of any assumption contained herein or therein, or for any loss howsoever arising whether directly or indirectly from any use, reliance or distribution of these materials or its contents or otherwise
arising in connection with this presentation. Further, nothing in this presentation should be construed as constituting legal, business, tax or financial advice. None of Mapletree Investments Pte Ltd (the "Sponsor"), MLT, the Manager, HSBC
Institutional Trust Services (Singapore) Limited (as the trustee of MLT) or any of their respective subsidiaries, affiliates, advisors, agents or representatives has independently verified, approved or endorsed the material herein.
The value of the units in MLT (“Units”) and the income derived from them may fall as well as rise. Units are not obligations of, deposits in, or guaranteed by, the Manager or any of its affiliates. An investment in Units is subject to investment
risks, including the possible loss of the principal amount invested. Investors have no right to request the Manager to redeem their Units while the Units are listed. It is intended that Unitholders may only deal in their Units through trading on the
Singapore Exchange Securities Trading Limited (the “SGX-ST”). Listing of the Units on the SGX-ST does not guarantee a liquid market for the Units.
This presentation may contain forward-looking statements that involve assumptions, risks and uncertainties. Such forward-looking statements are based on certain assumptions and expectations of future events regarding MLT's present and
future business strategies and the environment in which MLT will operate and must be read together with those assumptions. The Manager does not guarantee that these assumptions and expectations are accurate or will be realised. Actual
future performance, outcomes and results may differ materially from those expressed in forward-looking statements as a result of a number of risks, uncertainties and assumptions. Although the Manager believes that such forward-looking
statements are based on reasonable assumptions, it gives no assurance that such expectations will be met. Representative examples of these risks, uncertainties and assumptions include (without limitation) general industry and economic
conditions, interest rate trends, cost of capital and capital availability, competition from similar developments, shifts in expected levels of property rental income, changes in operating expenses including employee wages, benefits and training,
governmental and public policy changes and the continued availability of financing in the amounts and the terms necessary to support future business. The past performance of MLT and the Manager is not necessarily indicative of their future
performance. The forecast financial performance of MLT (if any) is not guaranteed. You are cautioned not to place undue reliance on these forward-looking statements, which are based on the Manager’s current view of future events. No
assurance can be given that the future events will occur or that projections will be achieved. The Manager does not assume any responsibility to amend, modify or revise any forward-looking statements, on the basis of any subsequent
developments, information or events, or otherwise. You should conduct your own independent analysis of the Sponsor, the Manager and MLT, including consulting your own independent legal, business, tax and financial advisers and other
advisers in order to make an independent determination of the suitability, merits and consequences of investment in MLT.
This presentation is for information only and does not constitute or form part of an offer, solicitation, recommendation or invitation for the sale or purchase of any securities of MLT in Singapore or any other jurisdiction nor should it or any part of
it form the basis of or be relied upon in connection with any investment decision, contract or commitment whatsoever. You agree that you will not rely on any representation or warranty implied herein or the information contained herein in any
action or decision you may take or make. This presentation is being provided to you for the purpose of providing information in relation to the forthcoming transaction by MLT. This presentation is not being distributed by, nor has it been
approved for the purposes of section 21 of the Financial Services and Markets Act 2000 (“FSMA”) by, a person authorised under FSMA. This presentation is being communicated only to persons in the United Kingdom who are (i) authorised
firms under the FSMA and certain other investment professionals falling within article 19 of the FSMA (Financial Promotion) Order 2005 (the “FPO”) and directors, officers and employees acting for such entities in relation to investment; (ii) high
value entities falling within article 49 of the FPO and directors, officers and employees acting for such entities in relation to investment; (iii) persons to whom it may otherwise lawfully be communicated.
The securities of MLT have not been and will not be registered under the United States Securities Act of 1933, as amended (the “Securities Act”) or under the securities laws of any state or other jurisdiction of the United States and may not
be offered or sold within the United States except pursuant to an exemption from, or in a transaction not subject to, the registration requirements of the Securities Act and in compliance with any applicable state securities laws. The Manager
does not intend to conduct a public offering of any securities of MLT in the United States.
Neither this presentation nor any part thereof may be (a) used or relied upon by any other party or for any purpose, (b) copied, photocopied, duplicated or otherwise reproduced in any form or by any means, or (c) forwarded, published,
redistributed, passed on or otherwise disseminated or quoted, directly or indirectly, to any person either in your organisation or elsewhere. By attending this presentation, you agree to be bound by the terms above.
These materials contain a summary only and do not purport to contain all of the information that may be required to evaluate any potential transaction mentioned in this presentation, including the acquisition by MLT of the proposed acquisitions
of (a) a 100.0% interest in 13 new logistics assets located in the People’s Republic of China through the acquisition of 13 property holding companies and (b) a 100.0% interest in three logistics assets located in Vietnam through the acquisition
of three property holding companies, as interested person transactions. This presentation is for information purposes only and does not constitute or form part of an offer, solicitation, recommendation or invitation for the sale or purchase of any
securities of MLT in Singapore or any other jurisdiction. No part of it nor the fact of its presentation shall form the basis of or be relied upon in connection with any investment decision, contract or commitment whatsoever.
For terms not defined herein, please refer to the circular released on the SGXNET titled "The proposed acquisitions of (a) a 100.0% interest in 13 new logistics assets located in the People’s Republic of China through the acquisition of 13
property holding companies and (b) a 100.0% interest in three logistics assets located in Vietnam through the acquisition of three property holding companies, as interested person transactions" dated 22 December 2021. Any discrepancies in
the tables, graphs and charts included herein between the listed amounts and totals thereof are due to rounding.
The advertisement has not been reviewed by the Monetary Authority of Singapore.
Proposed Acquisitions of 13 Properties in China and 3 Properties in Vietnam - Extraordinary General Meeting 13 January 2022
2

Notice of EGM
Proposed Acquisitions of 13 Properties in China and 3 Properties in Vietnam - Extraordinary General Meeting 13 January 2022
Acquisition Overview and Rationale
Proposed Acquisitions of 13 Properties in China and 3 Properties in Vietnam - Extraordinary General Meeting 13 January 2022
4

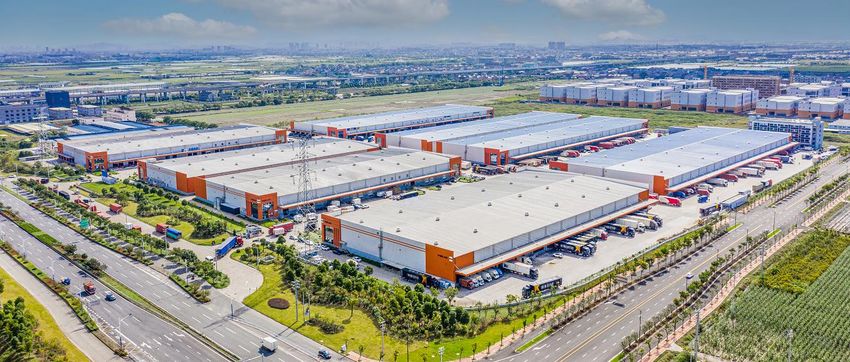
Overview of the Properties1
        Aggregate Agreed                                 Net Property                                      Net Lettable Area                    Committed               Weighted Average
         Property Value                               Income (“NPI”) Yield                                      (“NLA”)                         Occupancy             Lease Expiry (“WALE”)

      S$1,014.6 million2                                        ~5.1%3                                     1,051,525 sq m                           90.1%                  2.9 years4
                  China                                         Vietnam

  1    Mapletree Wenzhou                         14 Mapletree Bac Ninh 4
  2    Mapletree Zhengzhou                       15 Mapletree Bac Ninh 5
  3    Mapletree Yangzhou                        16 Mapletree Logistics Park 5                                        9
  4    Mapletree Kunming                                                                                                               No. of Properties       13                    3

  5    Mapletree Yuyao 2                                                                                       12 8
  6    Mapletree Xi’an
  7    Mapletree Yixing                                                                      6             2    3 7                    NLA (‘000)           863.0 sq m           188.5 sq m

  8    Mapletree Yantai                                                                                          5 10
  9    Mapletree Harbin
                                                                                                                      1                Committed
 10 Mapletree Yuyao                                                                                                                                          88.0%5               100.0%
                                                                                                 11                                    Occupancy
 11 Mapletree Chongqing                                                                 4                  13
 12 Mapletree Tianjin                                                                       15 14
 13 Mapletree Zhongshan                                                                                                                WALE4                2.6 years            3.9 years

                                                                                                                                       Agreed Property
                                                                                                      16                                                    S$883.3 m            S$131.3 m
                                                                                                                                       Value2

All information is as at Latest Practicable Date unless otherwise stated.
1) Refers to the 100.0% interest in 13 PRC Properties and three Vietnam Properties.
2) Based on the illustrative exchange rate of S$1.00 = RMB4.65 and S$1.00 = USD0.73.
3) NPI yield includes Income Support.
4) Weighted average lease expiry by proportionate NLA.
5) Seven of the PRC Properties are currently undergoing stabilisation and hence are currently operating below current market levels.
Proposed Acquisitions of 13 Properties in China and 3 Properties in Vietnam - Extraordinary General Meeting 13 January 2022
Fast Growing Domestic Markets Supported by Resilient Economic                                                                                                                                    5

1A Fundamentals

Relatively Low Urbanisation Rates with Significant Growth Potential                                  Robust Consumption Growth
Urban Population Growth and Percentage of Urban Population                                           Consumption Expenditure per Capita and Growth Rate
(%)                                                                                                  (USD’000, %)

             31.4%      13.9%       20.4%       3.4%          14.2%    -3.3%     6.3%         7.4%         1.9         4.0          28.2        19.7         30.8    14.8       42.4         21.4
  100.0%                                                                                                  10.0%

                                                                                                                                           Consumption expenditure per capita of China and
                                                                                                                      8.2%                 Vietnam was estimated to be 15% and 7% of the
   75.0%                                                                                                                                     average of developed countries respectively,
                                                                                                                                            suggesting huge growth potential in the future

                                                                                                                                   5.3%
   50.0%
                                                                                                                                                4.5%
                                                                                                                                                             3.9%    3.7%      3.7%

                                                                                                                                                                                             2.6%
   25.0%

    0.0%
              VN          CN         MY          SK            AU       JP        HK          SG           VN          CN           AU           SG          HK      SK         US           JP

               Urban Population Growth Rate from 2020 – 2031F (%)                                             2020 Consumption Expenditure per Capita (USD'000)

              2020 Urbanisation Rate (%)                        2031F Urbanisation Rate (%)                  Consumption Expenditure per Capita Growth: ’22F – ‘25F (CAGR)

           Source: Independent Market Research Consultants.                                               Source: Independent Market Research Consultants.

   Both China and Vietnam are projected to exhibit strong growth in their urban populations of 13.9% and 31.4% respectively, between 2020 and 2031

   Consumption expenditure per capita of China and Vietnam is expected to grow at a compound annual growth rate (“CAGR”) of 8.2% and 10.0% respectively from 2022 to
    2025, amongst the highest growth rates in Asia Pacific

   Increasing urbanisation and a growing middle class is expected to support rising consumption in both China and Vietnam, resulting in higher demand for logistics space
Proposed Acquisitions of 13 Properties in China and 3 Properties in Vietnam - Extraordinary General Meeting 13 January 2022
Limited Supply of Grade A Warehouse Space Presents Opportunity for                                                                                                                                   6

1B MLT to Fill the Market Gap

Relatively Low Supply of Grade A Warehouse with Significant Headroom for Growth                                                     Average Rent Premium for Grade A vs. Traditional
Logistics Real Estate Space per Capita and Grade A Warehouse Supply as a % of Total Stock                                           Warehouses
(sq m, %)                                                                                                                           (%)

                                                                                                                                                    30%

 JP     6.5%

                                                                                                                                                    25%
 US                                                               63.5%

                                                                                                                                                                                        20%

 SG                        48.0%

                                                                                                                                                                                        15%
 AU                                       80.7%
                                                                                                                                                     CN                                 VN
                                                                                                                                          Rent Premium between Grade A and Traditional Warehouses (%)

 CN     6.8%                                                                                                                         Source: Independent Market Research Consultants.
                                              Limited Supply of                               Significant
                                                   Grade A                                   Headroom for
                                                                                                                                       Limited supply of Grade A warehouse space
                                                 Warehouse                                     Growth
                                                                                                                                        across China and Vietnam
 VN     21.1%
                                                                                                                                       Low logistics space per capita vs countries like
                                                                                                                                        Japan and the US suggests significant headroom
      0.0            0.5           1.0            1.5             2.0        2.5           3.0          3.5             4.0   4.5       for growth

            Total Logistics Real Estate Space per Capita (sq m)           Grade A Warehouse Supply (% of total stock)                  Grade A warehouse space commands a sizeable
       Source: Independent Market Research Consultants.
                                                                                                                                        rent premium over traditional warehouses
Proposed Acquisitions of 13 Properties in China and 3 Properties in Vietnam - Extraordinary General Meeting 13 January 2022
Augmenting Growth while Maintaining Large Exposure to Developed                                                                                                                                                            7

1C Markets in Asia Pacific

                         Existing Portfolio                                                                                 Enlarged Portfolio1
                         Assets under Management (“AUM”) and Gross Revenue                                                  Assets under Management and Gross Revenue
                         (SGD million, %)                                                                                   (SGD million, %)
                                                               0.8%                                                                                          0.7%
                                                            1.8%                                                                                          2.8%              22.0%
                                                                              24.1%
   (as at 30 Sep 2021)

                                                                                              75.9%                                                                                               69.3%
                                                                4.7%                                                                                          4.3%
           AUM

                                                            16.8%      S$10,762.9                                                                                    S$11,793.1
                                                                                                                                                                                          22.6%
                                                                         million          24.7%                                                            22.9%       million

                                                                8.2%
                                                                       7.7%                                                                                         7.5%          10.2%
                                                                              11.2%                                                                                        7.0%

                                                               1.2%                                                                                          1.0%
                                                            3.0%                                                                                          4.1%
                                                                                29.2%                                                                                         26.5%
(as at 30 Sep 2021)

                                                                                              71.6%                                                                                               65.1%
  Gross Revenue

                                                               5.4%                                                                                          4.9%
      6-Month

                                                                           S$328.8                                                                                     S$362.4
                                                                                                                                                                       million            16.0%
                                                            18.8%          million
                                                                                          17.6%                                                            24.9%

                                                                    7.7%                                                                                                            9.1%
                                                                           7.1% 10.0%                                                                                  7.0% 6.5%

                               Singapore            Hong Kong SAR              Japan              Australia   South Korea      China           Malaysia             Vietnam                India          Developed Markets
                            Source: Company information.
                            1) Excludes the proposed acquisition of the Japan Property.

   The Acquisitions will increase the NLA of MLT’s portfolios in China and Vietnam – in line with MLT’s strategy to scale up presence in higher growth markets,
    complementing the stability provided by developed markets

   Post Acquisitions, developed markets will continue to account for the majority of MLT’s portfolio, contributing approximately 69.3% and 65.1% to the enlarged portfolio’s
    AUM and gross revenue respectively on a pro forma basis
Proposed Acquisitions of 13 Properties in China and 3 Properties in Vietnam - Extraordinary General Meeting 13 January 2022
8

2    Capture Opportunities from Structural Trends Accelerated by COVID-19
     COVID-19 Fueling the Rapid Growth of the E-commerce Logistics Market                              “China Plus” Strategy to Benefit Vietnam
2A    E-commerce Logistics Market Size and Growth                                               2B     Registered FDI Investment and Registered Capital Growth
      (USD billion, %)                                                                                 (USD billion, %)

     0.6          138.7        0.6          1.0         14.2      5.2        150.0       16.9   40.0                                                                                60.0%

                                                                                                35.0                                                                                50.0%
    19.9%                            ~ 1.6x – 2.7x that of average developed countries
                                                                                                30.0                                                                                40.0%
                                                                                                                                                                                    30.0%
                                                                                                25.0
                  12.0%
                                                     Average Developed                                                                                                              20.0%
                                                   Countries’ Growth: 7.4%                      20.0
                             10.2%                                                                                                                                                  10.0%
                                           8.7%                                                 15.0
                                                        7.2%                                                                                                                        0.0%
                                                                 6.1%        6.0%        6.0%
                                                                                                10.0                                                                                (10.0)%
                                                                                                 5.0                                                                                (20.0)%
                                                                                                 0.0                                                                                (30.0)%
     VN            CN        SG          HK          SK           AU             US      JP               2016       2017        2018         2019           2020   2021F   2022F
           2020 E-commerce Logistics Market Size (USD billion)                                               Registered Capital (USD billion)
           Forecast E-commerce Logistics Market Size Growth: ‘20 – ‘25F (CAGR)                                Registered Capital Growth (%)
     Source: Independent Market Research Consultants.                                                     Source: Independent Market Research Consultants.

 Rapid rise of e-commerce has bolstered demand for logistics space,                             Despite the COVID-19 pandemic, Vietnam’s FDI has increased by 4.4% (first 9
  with tenants favouring modern Grade A logistics facilities                                      months of 2021)  Vietnam is expecting a strong FDI growth of 19.9% in 2022

2C   “Just-in-Time” to “Just-in-Case”
      Increased Emphasis on Supply Chain Security and Resilience

 Supply chain resilience will be prioritised over efficiency especially for businesses          Inventory of retailers is expected to grow by 10% to 15% to serve as buffer
  operating in critical sectors  increase “safety stock”                                         stock

                  Above structural trends will boost demand for warehouse space, especially for modern Grade A warehouses
Proposed Acquisitions of 13 Properties in China and 3 Properties in Vietnam - Extraordinary General Meeting 13 January 2022
Deepen and Expand Coverage across Key Cities in China with Addition                                                                                                                                               9

3A of Three New Provinces

                                                                                                                                          Narrowing Consumption Gap between Tier 1 & Non-Tier 1 Cities
                                                                                                                                          Urban Consumption Expenditure per Capita in China
                                                                                                                                          (RMB)

                                                                                                                           Heilongjiang

                                                                                                                                Jilin                                                          74,678
                                                                                                                                                                                                            30%
             Xinjiang
                                                                                                                     Liaoning                                                                               52,124
                                                                                                                                                    42,125
                                                                                                 Beijing
                                                                  Inner Mongolia                                                                                    41%
                                                                                                                                                                24,838
                                                                                              Hebei        Tianjin
                                                                     Ningxia
                                                                                     Shanxi
                                         Qinghai                                                    Shandong

                                                                 Gansu                                                                                     2020                                      2031
                                                                                         Henan                                                      Tier 1 Cities                               Non-Tier 1 Cities
                                                                          Shaanxi                                Jiangsu
            Tibet                                                                                                                                Source: Independent Market Research Consultants.
                                                                                                         Anhui
                                                                                                                           Shanghai
                                                       Sichuan                           Hubei                                            Growing Network Effect
                                                                    Chongqing                                     Zhejiang
                                                                                                    Jiangxi
                                                                                     Hunan                                                         Expand network in China to         43 assets covering 29 cities
                                                                    Guizhou                                  Fujian
               No. of            NLA
               Assets           (sq m)
 Existing
                    30     2,006,791
                                                   Yunnan
                                                                           Guangxi         Guangdong
                                                                                                                       Taiwan
                                                                                                                                                    57% of tenants in China will be leasing space in more
 assets                                                                                                  Hong Kong                                  than one MLT asset in China
 New                                                                                             Macau
                    13      863,015
 assets
 Total              43     2,869,806                                            Hainan                                                             Enlarged portfolio has access to an aggregate population
                                                                                                                                                   base in China of       > 142 million people
 Source: Company information.
10

3B   Deepen Presence In Thriving Logistics Hubs of Vietnam
                                                                                                                          Key Attractiveness of Bac Ninh

                                                                                                                             Close proximity to Hanoi, the largest consumption market in Northern
                                                                              Lang Son

                                                                 Thai
                                                                                                                              Vietnam, allows it to serve as the logistics and distribution hub for domestic
                                                                 Nguyen                                                       consumption
                   Bac Ninh
                                                                                                                             Home to a prominent electronics cluster with many global multinational
                                                                                                        Quang Ninh
                                                      Noi Bai                     Bac Giang
                                                      Int’l Airport
                                                                             Bac Ninh
                                                                                                                              corporations setting up production bases in the region
                                                                                 Mapletree Bac Ninh 4
                                                                               Mapletree Bac Ninh 5
                                                           Hanoi                                                             Attractive to foreign investors with its close proximity to China, which allows
                                                                           Hai Phong
                                                                                       Hai Phong Port
                                                                                                                              manufacturers to source supplies from Southern China, and access to an
                                                                                                                              abundant workforce

                                                                                                                             3rd highest recipient of FDI in Northern Vietnam

                                                                                      Binh Duong                          Key Attractiveness of Binh Duong

                                                                                                                             Close proximity to Ho Chi Minh City, the largest consumption market in
                                                                       Mapletree
                                                                                                        Bien Hoa
                                                                                                        Railway
                                                                                                                              Vietnam, creates strong demand for warehouse space to support
                                                                       Logistics Park 5
                                                                                                                              e-commerce and local retailers
                                                                                                                   Dong
                                                    Ho Chi
                                                    Minh City
                                                                                                                   Nai       Largest warehouse market in Southern Vietnam, accounting for about half
                                                                                                          Long Thanh
                                                                                                                              of its total supply
                                                                      Tan Son Nhat                        Int’l Airport
                                                                      Int’l Airport

                                                                                  Tan Cang – Cat Lai
                                                                                                                             Demand for logistics facilities is sustained by a thriving manufacturing
                                                                        Saigon
                                                                                  Terminal Port
                                                                                                                              sector, as Binh Duong is home to the country’s largest southern industrial
                             Binh Duong                                 Railway                                               zones

     Location of Existing Assets      Location of New Assets to be Acquired                                                  2nd highest recipient of FDI in Southern Vietnam

 Sources: Independent Market Research Consultants and company information.
11

 4A   High Quality Modern Facilities with Long Land Tenure
                                                                     Strong Floor Loading and             Efficient Column Grid or
                   Newly Built
                                                                        Clear Ceiling Height               Wide Column Spacing

          Weighted Average Age1:                                  Floor Loading of 3.0 tons / sq m
                1.6 years                                        and Ceiling Height of 9.0 – 10.0 m

                              Direct Access                                             Land Tenure                          Large Floor Plate

                            Wide ramp for
                                                                                  Weighted Average Land
                      double-storey warehouse
                                                                                         Tenure2:
                        to provide convenient
                                                                                       ~43.8 years
                         access to every floor
                                                                                                                                 Average:
                                                                                                                              c.14,000 sq m

Source: Company information.
1) By NLA as at Latest Practicable Date.
2) Weighted average land tenure as at Latest Practicable Date.
12

 4B    Strong and Diversified Tenant Base
Tenant Base By Sector1                                                                                                  Top 10 Tenants for the Properties
(By % of Gross Revenue2)                                                                                                (By % of Gross Revenue2)

                                                                            83%
                                            5%

                                                                        50%
                                   14%

                         2%
                          1%                                                                                            Top 10 Tenants of MLT’s Portfolio
                           1%                                                                                           (By % of Gross Revenue3)
                                        13%                                                                                 7.2%                                            Existing Portfolio
                                                      10%
                                                                                                                                       3.6%        3.4%
                                                                       2%
                                                                2%                                                                                            2.3%        1.9%      1.6%         1.4%      1.4%        1.3%        1.3%

      Food & Beverage Products               Fashion, Apparel & Cosmetics           Consumer Staples
                                                                                                                            CWT        Coles      Equinix    JD.com,     Cainiao Woolworths    SBS        TE Logis      XPO        HKTV
      Furniture & Furnishings                Retail                                 Electronics & IT                                   Group                   Inc.                           Holdings    Co., Ltd.   Worldwide
                                                                                                                                                                                                                      Logistics
      Others                                 Materials, Construction                Document Storage                                                             Enlarged Portfolio         New Top 10 Tenants
                                             & Engineering                                                                  6.5%
      Commodities

                                                                                                                                       3.3%        3.1%       3.0%
                                                                                                                                                                          2.5%
   83% of the Properties’ Gross Revenue caters to the consumer markets                                                                                                             1.9%         1.9%
                                                                                                                                                                                                           1.5%        1.3%        1.2%
   34% are new tenants (by gross revenue)  diversify tenant base and reduce
    concentration risks                                                                                                     CWT        Coles      Equinix     S.F.       JD.com,     Best        Cainiao Woolworths    SBS        TE Logis
                                                                                                                                       Group                 Express       Inc.                                       Holdings    Co., Ltd.
Source: Company information.                                                                                                                                 Co.,Ltd.
1) The trade sector breakdown reflects the nature of the underlying goods that are stored and handled by the respective tenants at the PRC Properties and Vietnam Properties.
2) Gross revenue for the month ending 31 December 2021.
3) Gross revenue for the month ended 30 September 2021.
Financial Details
Transaction Summary:                                                                                                                                                                                              14

Acquisitions of 13 Properties in China and 3 Properties in Vietnam
                                             The proposed acquisitions of:
                                                       A 100.0% interest in 13 logistics assets located in the PRC (the “PRC Properties” and the proposed acquisition, the “PRC Acquisitions”) through
                                                        the acquisition of 13 property holding companies; and
                                                       A 100.0% interest in three logistics assets located in Vietnam (the “Vietnam Properties”, and the proposed acquisition, the “Vietnam
                                                        Acquisitions”) through the acquisition of three property holding companies,
                                                   as interested person transactions (collectively, the “Acquisitions” and the 16 assets, the “Properties”).
                                             The total acquisition cost is estimated to be approximately S$1,058.0 million, comprising:

  Proposed Transaction                                 the PRC Acquisition Price of approximately RMB4,161.9 million (S$894.1 million), which comprises (a) the PRC Aggregate Share Consideration
                                                        which will be paid in cash; (b) the PRC Intercompany Loans, which will be satisfied partly in cash and partly via the issue of the Consideration Units;
                                                        and (c) the PRC Bank Loans;
                                                       the Vietnam Acquisition Price of approximately USD97.9 million (S$134.1 million) which will be paid in cash;
                                                       the acquisition fee payable in Units to the Manager for the Acquisitions (the “Acquisition Fee”) which is estimated to be approximately S$5.1 million
                                                        (representing 0.5% of the Total Acquisition Price); and
                                                       the estimated professional and other fees and expenses of approximately S$24.7 million incurred or to be incurred by MLT in connection with the
                                                        Acquisitions and the Equity Fund Raising,
                                                   (collectively, the “Total Acquisition Cost”).

                                             PRC Properties by Knight Frank Petty Limited (“Knight Frank”) and Beijing Colliers International Real Estate Valuation Co., Ltd (“Beijing Colliers”):
                                              RMB4,162.0 million (S$894.1 million) and RMB4,131.0 million (S$887.5 million) respectively; and
  Independent Valuation
                                             Vietnam Properties by Cushman & Wakefield (Vietnam) Ltd. (“C&W Vietnam”) and VAS Valuation Co., Ltd in association with CBRE (Vietnam) (“CBRE
                                              Vietnam”): USD97.0 million (S$132.8 million) and USD96.7 million (S$132.4 million) respectively.

                                             The Agreed PRC Property Value of RMB4,111.7 million (S$883.3 million), represents a discount of approximately 1.2% to Knight Frank’s aggregate
                                              valuation of RMB4,162.0 million (S$894.1 million) and a discount of approximately 0.5% to Beijing Colliers’ aggregate valuation of RMB4,131.0 million
     Aggregate Agreed                         (S$887.5 million); and
      Property Value                         The Agreed Vietnam Property Value of USD95.9 million (S$131.3 million), represents a discount of approximately 1.1% to C&W Vietnam’s aggregate
                                              valuation of USD97.0 million (S$132.8 million) and a discount of approximately 0.8% to CBRE Vietnam’s aggregate valuation of USD96.7 million (S$132.4
                                              million).

All information is as at 14 December 2021 (“Latest Practicable Date”) unless otherwise stated. Based on the illustrative exchange rate of S$1.00 = RMB4.65 and S$1.00 = USD0.73.
15

Discount to Independent Valuations
Aggregate Agreed Property Value Relative to Independent Valuations1
(SGD million)

       Aggregate Agreed Property Value of 13 PRC Properties and three Vietnam                                            1.2%
                                                                                                                        Discount      894.1
                                     Properties

                                                                                                                                                   0.5%
                                  1.2%                                                        CN                                                  Discount       887.5
                                 Discount   1,026.9

                                                                                                             883.3
                                                           0.5%
                                                          Discount       1,019.9

                1,014.6
                                                                                                   Aggregate Agreed Property Valuation by Independent   Valuation by Independent
                                                                                                             Value            Valuers Appointed by       Valuers Appointed by
                                                                                                                                      Trustee                   Manager
                                                                                                                         1.1%
                                                                                                                        Discount      132.8
                                                                                                                                                   0.8%
                                                                                                                                                  Discount       132.4

                                                                                                            131.3
                                                                                              VN

     Aggregate Agreed Property     Valuation by Independent      Valuation by Independent          Aggregate Agreed Property Valuation by Independent   Valuation by Independent
               Value              Valuers Appointed by Trustee Valuers Appointed by Manager                  Value            Valuers Appointed by       Valuers Appointed by
                                                                                                                                      Trustee                   Manager

Source: Independent Valuers.
1) As at 31 October 2021.
16

Financing Considerations
             The Acquisitions are to be partially funded by a combination of debt and Equity Fund Raising, which comprised of a Private Placement and a Preferential Offering

                                                                                                                                                                                                     Acquisition Fee in
                                                                                                                                               S$ million1                                                 Units
                                                                                                                                                                                                                     4
                                                                                                                                                                                                       S$5.1 million

 PRC Acquisition Price                                                                                                                             894.12
                                                                                                                                                                                                      Consideration
                                                                                                                                                                                                          Units       5
                                                                                                                                                                                                      S$200.0 million
 Vietnam Acquisition Price                                                                                                                         134.13

                                                                                                                                                                                                         Equity Fund
           Total Acquisition Price for Acquisitions                                                                                               1,028.1                                                  Raising
                                                                                                                                                                                                          ~S$494.9
                                                                                                                                                                                                                   6
                                                                                                                                                                                                           million

 Acquisition Fee                                                                                                                                     5.1

                                                                                                                                                                                                       Loan Facilities
 Estimated professional and other fees and expenses in connection with the Acquisitions                                                                                                                  ~S$358.0
                                                                                                                                                    24.7
 and the Equity Fund Raising                                                                                                                                                                              million

           Total Acquisition Cost                                                                                                                 1,058.0                                        Illustrative Sources
                                                                                                                                                                                               (Total S$1,058.0 million)
1)   Any discrepancies in the tables between the listed amounts and totals thereof are due to rounding.
2)   The acquisition price for the PRC Acquisitions is the aggregate of the PRC Aggregate Share Consideration, the value of the PRC Intercompany Loans, and the value of the PRC Bank Loans.
3)   The acquisition price for the Vietnam Acquisitions is the aggregate of the Vietnam Aggregate Share Consideration and the value of the Vietnam Intercompany Loans.
4)   Based on 0.5% of the Total Acquisition Price, paid in the form of approximately 2,734,423 Acquisition Fee Units at an issue price of S$1.88 per Acquisition Fee Unit.
5)   The 106,382,979 Consideration Units issued at an issue price of S$1.88 per Consideration Unit.
6)   The Equity Fund Raising consist of the issue of 212,766,000 New Units representing approximately 4.9% of the existing number of issued Units as at 22 November 2021 under a private placement to institutional and other investors at an
     issue price of S$1.88 per New Unit to raise gross proceeds of approximately S$400.0 million (the “Private Placement”) and a non-renounceable preferential offering of 159,109,907 New Units to existing Unitholders at a preferential
     offering ratio of 37 New Units for every 1,000 existing Units to raise gross proceeds of approximately S$292.8 million (the “Preferential Offering”). The Manager intends to utilise approximately S$494.9 million from the gross proceeds of
     the Equity Fund Raising of approximately S$692.8 million to partially finance the Total Acquisition Cost.
17

DPU, NAV per Unit Accretive Acquisitions
Pro Forma DPU (FY20/21)1                                                          Pro Forma NAV per Unit 4                                                              Pro Forma Aggregate Leverage
(Singapore cents)                                                                 (S$)                                                                                  (%)

                                                         2,3                                                                                 5
                                                 8.415                                                                                1.37
                                                                                                                                                                                              6                                 7
                                                                                                                                                                                      39.0%                             39.1%

               8.326                                                                                1.33

      Before the Acquisitions           After the Acquisitions                           Before the Acquisitions             After the Acquisitions                           Before the Acquisitions           After the Acquisitions

Source: Company information.
1) For the financial year ended 31 March 2021.
2) Assuming that the Properties had a portfolio occupancy rate of 90.1% for the entire financial year ended 31 March 2021 and all leases, whether existing or committed as at the Latest Practicable Date, were in place since 1 April 2020. All
    tenants were paying their rents in full and including Income Support of up to RMB20.9 million (S$4.5 million). MLT’s expenses comprising borrowing costs associated with the drawdown of S$358.0 million from the Loan Facilities, the
    Manager’s management fees, Trustee’s fees and other trust expenses incurred in connection with the operation of the Properties have been deducted. Excluding Income Support, the DPU would be 8.312 cents.
3) Includes (a) approximately 212.8 million New Units issued in connection with the Private Placement at an issue price of S$1.88 per New Unit and 51.6 million New Units issued in connection with the Preferential Offering at an issue price
    of S$1.84 per New Unit, (b) approximately 2,734,423 Acquisition Fee Units issued as payment of the Acquisition Fee payable to the Manager at an issue price of S$1.88 per Acquisition Fee Unit, (c) 106,382,979 Consideration Units
    issued at an issue price of S$1.88 per Consideration Unit and (d) approximately 3.0 million new Units issued in aggregate as payment to (i) the Manager for the base management fee and (ii) the Property Manager as payment for the
    property management and lease management fees for such services rendered to the Properties for the financial quarters ended 30 June 2020, 30 September 2020 and 31 December 2020.
4) As at 31 March 2021.
5) Includes (a) approximately 212.8 million New Units issued in connection with the Private Placement at an issue price of S$1.88 per New Unit and 51.6 million New Units issued in connection with the Preferential Offering at an issue price
    of S$1.84 per New Unit, (b) approximately 2,734,423 Acquisition Fee Units issued as payment of the Acquisition Fee payable to the Manager at an issue price of S$1.88 per Acquisition Fee Unit and (c) 106,382,979 Consideration Units
    issued at an issue price of S$1.88 per Consideration Unit.
6) Pro forma as at 30 September 2021, including committed acquisitions announced to date (excluding the proposed acquisition of the Japan Property, further details of which are set out in the announcement by MLT dated 22 November
    2021 and was completed on 16 December 2021), partially funded by approximately S$150.0 million out of the gross proceeds arising from the issue of S$400.0 million in principal amount of 3.725% fixed rate subordinated perpetual
    securities (as first announced by the Manager on 26 October 2021).
7) Includes gross proceeds of S$692.8 million from the Equity Fund Raising, S$200 million worth of Consideration Units, the Loan Facilities as well as the drawdown of debt facilities to part finance the proposed acquisition of the Japan
    Property.
18

MLT After the Proposed Acquisitions
Enlarged Assets Under Management of c.S$11.79 billion from c.S$10.76 billion
                                                      Before the Acquisitions1                                 Properties2                              After the Acquisitions                                  % Change

 NLA                                                         6,463,362 sq m                                  1,051,525 sq m                                 7,514,887 sq m                                           16.3%

 Assets Under Management                                   S$10,762.9 million                              S$1,030.2 million3                             S$11,793.1 million                                          9.6%

 WALE4                                                           3.7 years                                       2.9 years                                       3.6 years                                            2.7%

 Number of Tenants                                                   753                                             66                                             819                                               8.8%

 Occupancy Rate                                                   97.8%5                                          90.1%6                                          96.7%                                               1.1%

 Aggregate Leverage                                               39.0%7                                              -                                           39.1%8                                              0.1%
 (Pro forma as at 30 September 2021)

 Net Asset Value per Unit (S$)                                      1.33                                              -                                            1.379                                              3.3%
 (Pro forma as at 31 March 2021)

Source: Company information.
1) As at 30 September 2021.
2) As at the Latest Practicable Date.
3) Based on the aggregate Agreed Property Value of the Properties, which includes any capitalised costs.
4) Weighted average by proportionate leased NLA.
5) Based on actual occupancy.
6) Based on committed occupancy. The committed occupancy for the PRC Properties is 88.0% and for the Vietnam Properties is 100.0%.
7) Pro forma as at 30 September 2021, including committed acquisitions announced to date (excluding the proposed acquisition of the Japan Property, further details of which are set out in the announcement by MLT dated 22 November
    2021 and was completed on 16 December 2021), partially funded by approximately S$150.0 million out of the gross proceeds arising from the issue of S$400.0 million in principal amount of 3.725% fixed rate subordinated perpetual
    securities (as first announced by the Manager on 26 October 2021).
8) Includes gross proceeds of S$692.8 million from the Equity Fund Raising, S$200 million worth of Consideration Units, the Loan Facilities as well as the drawdown of debt facilities to part finance the proposed acquisition of the Japan
    Property.
9) Includes (a) approximately 212.8 million New Units issued in connection with the Private Placement at an issue price of S$1.88 per New Unit and 51.6 million New Units issued in connection with the Preferential Offering at an issue price
    of S$1.84 per New Unit, (b) approximately 2,734,423 Acquisition Fee Units issued as payment of the Acquisition Fee payable to the Manager at an issue price of S$1.88 per Acquisition Fee Unit and (c) 106,382,979 Consideration Units
    issued at an issue price of S$1.88 per Consideration Unit.
EGM Resolutions
20

Summary of Approvals Required
     The Independent Financial Adviser1 is of the opinion that
            the Acquisitions (including the Income Support) are on normal commercial terms and are not prejudicial to the interests of MLT and its minority Unitholders;
            the proposed issue of 106,382,979 Consideration Units is on normal commercial terms and is not prejudicial to the interests of MLT and its minority
             Unitholders; and
            the terms of the proposed issue of the Consideration Units, which is the subject of the Whitewash Resolution, are fair and reasonable and the Whitewash
             Resolution is fair and reasonable.
     Accordingly, the IFA has advised the Independent Directors and the Audit and Risk Committee to recommend that Unitholders vote in favour of the Acquisitions,
     the issue of 106,382,979 Consideration Units and the Whitewash Resolution.

                                      The proposed acquisitions of (a) a 100.0% interest in 13 logistics assets located in the PRC through the acquisition of 13 property holding companies
           Resolution 1               and (b) a 100.0% interest in three logistics assets located in Vietnam through the acquisition of three property holding companies, as interested
                                      person transactions.

           Resolution 2               The proposed issue of 106,382,979 new units in MLT as partial consideration for the PRC Acquisitions.

           Resolution 3               The proposed Whitewash Resolution.

1)       The Manager has appointed Ernst & Young Corporate Finance Pte Ltd (the “Independent Financial Adviser”), pursuant to Rule 921(4)(a) of the Listing Manual, as well as to advise the independent directors of the Manager (the
         “Independent Directors”), the audit and risk committee of the Manager (the “Audit and Risk Committee”) and the Trustee in relation to the Acquisitions (including the Income Support), the proposed issue of the Consideration Units and
         the proposed Whitewash Resolution.
Appendix A
22

Structure Post-Acquisition of PRC Properties

                      MLT

                                                Pursuant to the PRC Share Purchase Agreements each
                                                 dated 22 November 2021, the Trustee, on behalf of MLT,
                            100.0% interest      will acquire a 100.0% interest in each of the eight SG
                                                 SPVs, the four HK (A) SPVs and the HK (B) SPV that hold
                                                 the PRC Properties from the PRC Vendors

                   Singapore /
                                                The PRC Acquisition Price will be the sum of the PRC
                 Hong Kong SPVs                  Aggregate Share Consideration, the value of the PRC
                                                 Intercompany Loans and the value of the PRC Bank
                                                 Loans, being approximately RMB4,161.9 million (S$894.1
                            100.0% interest      million). Out of the PRC Acquisition Price, the PRC
                                                 Aggregate Share Consideration will be paid in cash to the
                                                 PRC Vendors while the PRC Intercompany Loans will be
                                                 satisfied partly in cash and partly via the issue of the
                  PRC WFOEs                      Consideration Units to the Relevant PRC Vendors on the
                                                 terms set out in the respective PRC Share Purchase
                                                 Agreements

                            100.0% interest     Following the completions of the PRC Acquisitions, MLT
                                                 will own 100.0% of the ordinary shares in the issued share
                                                 capital of each of the 13 PRC Property SPVs

                 PRC Properties
23

Structure Post-Acquisition of Vietnam Properties

                                            MLT

                                                    100.0% interest
                                                                                  Pursuant to the Vietnam Share Purchase Agreements
                                                                                   each dated 22 November 2021, the Vietnam Purchaser
                                   Singapore SPV1                                  will acquire a 100.0% interest in each of the three Cayman
                                                                                   SPVs that hold the Vietnam Properties from the Vietnam
                                                                                   Vendor
                                                    100.0% interest
                                                                                  The Vietnam Acquisition Price will be the sum of the
                                                                                   Vietnam Aggregate Share Consideration and the value of
                                    Cayman SPVs                                    the Vietnam Intercompany Loans, being approximately
                                                                                   USD97.9 million (S$134.1 million). The Vietnam
                                                                                   Acquisition Price will be paid in cash to the Vietnam
                                                    100.0% interest                Vendor on the terms set out in the respective Vietnam
                                                                                   Share Purchase Agreements

                                    Vietnam SPVs                                  Following the Vietnam Completion, MLT will indirectly hold
                                                                                   100.0% of the ordinary shares in the issued share capital
                                                                                   of each of the three Cayman SPVs
                                                    100.0% interest

                                        Vietnam
                                       Properties

         1)   MLT will hold the Cayman SPV indirectly through a Singapore SPV.
Appendix B
25

Overview of MLT
                               Mapletree Logistics Trust

                                                                                             Public Unitholders                             MIPL
 Sponsor                      Mapletree Investments Pte Ltd (“MIPL”)

                              Mapletree Logistics Trust Management Ltd. (“MLTM”)
 Manager                                                                                              69.90%                           30.10%1
                               −    Wholly-owned subsidiary of the Sponsor

 Sponsor Stake                30.10%1
                                                                                                                                                       Trustee – HSBC

 Investment
 Mandate
                              Primarily logistics and distribution spaces in Asia-Pacific

 Existing                     163 properties with total assets under management of                                                                   Manager – MLTM
 Portfolio                     S$10.8 billion

 Property                     Mapletree Property Management Pte. Ltd. (“MPM”)
 Manager                       −    Wholly-owned subsidiary of the Sponsor
                                                                                                                  Existing Portfolio

 Trustee
                              HSBC Institutional Trust Services (Singapore) Limited                    Total of 163 properties across
                                                                                                                                                   Property Manager – MPM
                               (“HSBC”)                                                              9 geographic markets in Asia-Pacific

All information is as at 30 September 2021 unless otherwise stated.
1) As at Latest Practicable Date.
26

Snapshot of MLT
 Key Indicators                                                 As at 30 September 2021                                Location of Properties
                                                                                                                       (As at 30 September 2021)
 Assets under Management (S$ million)                                          10,763

                                                                                                                                                                                                                  Japan
                                                                                                                                                                         South Korea
                                                                                                                                                                                                          Number of Properties: 18
                                                                                                                                                                     Number of Properties: 18
                                                                                                                                                                                                          Occupancy Rate: 96.2%
 Market Capitalisation1 (S$ million)                                           8,484.5                                                                               Occupancy Rate: 98.4%
                                                                                                                                                                                                          AUM: S$1,204.2 million
                                                                                                                                                                      AUM: S$880.5 million
                                                                                                                                               China
                                                                                                                                       Number of Properties: 30
                                                                                                                                       Occupancy Rate: 95.9%
 Free Float1 (S$ million)                                                      5,930.7                                                  AUM: S$1,807.6million                                           Hong Kong SAR
                                                                                                                                                                                                      Number of Properties: 9
                                                                                                                                                                                                      Occupancy Rate: 99.7%
                                                                                                                                                                                                      AUM: S$2,659.8 million
 Aggregate Leverage (%)                                                        39.0%2                                                    India
                                                                                                                                 Number of Properties: 2
                                                                                                                                                                                                           Vietnam
                                                                                                                                 Occupancy Rate: 98.2%
                                                                                                                                                                                                     Number of Properties: 7
                                                                                                                                  AUM: S$86.6 million
                                                                                                                                                                                                     Occupancy Rate: 100.0%
                                                                                                                                                                                                      AUM: S$191.7 million
 Net Asset Value Per Unit (S$)                                                  1.323
                                                                                                                                                    Malaysia
                                                                                                                                              Number of Properties: 15                        Singapore
                                                                                                                                              Occupancy Rate: 100.0%                     Number of Properties: 52
                                                                                                                                               AUM: S$507.5 million                      Occupancy Rate: 98.1%
 Net Lettable Area (million sq m)                                                6.5                                                                                                     AUM: S$2,597.1 million

 Portfolio Occupancy (%)                                                       97.8%4                                                                               Australia
                                                                                                                                                              Number of Properties: 12
                                                                                                                                                              Occupancy Rate: 100.0%
                                                                                                                                                               AUM: S$827.9 million
 WALE by NLA (years)                                                             3.7

 No. of Tenants                                                                  753

All information is as at 30 September 2021 unless otherwise stated.
1) As at Latest Practicable Date.
2) Pro forma as at 30 September 2021, including committed acquisitions announced to date (excluding the proposed acquisition of the Japan Property, further details of which are set out in the announcement by MLT dated 22 November
      2021 and was completed on 16 December 2021), partially funded by approximately S$150.0 million out of the gross proceeds arising from the issue of S$400.0 million in principal amount of 3.725% fixed rate subordinated perpetual
      securities (as first announced by the Manager on 26 October 2021).
3) Includes net derivative financial instruments, at fair value, liability of S$36.6 million. Excluding this, the NAV per unit would be at S$1.33.
4) Based on the actual occupancy.
27

Growth in Amount Distributable and DPU since Listing
       Strong track record of delivering stable distributions and consistent long-term returns to Unitholders through different economic and property cycles

       Focused and proactive approach towards asset and lease management, acquisitions and capital management

DPU
(S$ cents)

                                                   Global Financial
                                                       Crisis
                                                                                                                                                                                                                                8.33
                                                                                                                                                                                                                  8.14
                                                                                                                                                                                                   7.94
                                                                                                                                         7.50                                        7.62
                                                                                                                           7.35                         7.38          7.44
                                                   7.24
                                                                                                             6.86
                                    6.57                                                      6.54
                                                                 6.02           6.09

                      5.07

        1.85

               1                                                        2                            3
       FY05           FY06          FY07          FY08           FY09          FY10         FY11/12        FY12/13       FY13/14       FY14/15        FY15/16       FY16/17        FY17/18       FY18/19        FY19/20       FY20/21

1) FY05 comprised the period from Listing Date of 28 July 2005 – 31 December 2005.
2) Decline in FY09 DPU due to increase in unit base following rights issue in August 2008.
3) This reflects the performance for the 12-month period from 1 April 2011 to 31 March 2012. For the 15-month period ended 31 March 2012 (due to a change in financial year-end from 31 December to 31 March), distribution per unit was
   8.240 Singapore cents.
Appendix C
29

Overview of the PRC Properties

                                  Mapletree Wenzhou                          Mapletree Zhengzhou                         Mapletree Yangzhou                           Mapletree Kunming                           Mapletree Yuyao 2
                            2 blocks of double-storey, 4 blocks
                                                                       6 blocks of single-storey warehouse        4 blocks of single-storey warehouse, 5 blocks of single-storey warehouse, 4 blocks of single-storey warehouse,
     Description             of single-storey and 1 block of 5-
                                                                                 and 1 dormitory                      1 block of 3-storey dormitory        1 block of 3-storey dormitory        1 block of 5-storey dormitory
                                      storey dormitory

    City/Province                    Wenzhou/Zhejiang                            Zhengzhou/Henan                            Guangling/Jiangsu                            Kunming/Yunnan                               Yuyao/Zhejiang

      Land Area                         160,008 sq m                                162,264 sq m                               139,965 sq m                                117,660 sq m                                119,864 sq m

          NLA                           126,571 sq m                                94,735 sq m                                 83,807 sq m                                 65,650 sq m                                 69,824 sq m

         WALE                             4.0 years                                   4.1 years                                   1.9 years                                   1.6 years                                   0.8 year

     Land Tenure                           46 years                                   46 years                                    46 years                                    46 years                                    46 years

   Age of Building                         0.3 year                                    0.8 year                                   2.1 years                                   1.1 year                                   2.0 years

      Occupancy                              94%1                                       95%1                                         87%                                        97%1                                        82%1

                                                                                 11.4 m by 24.0 m /
                                     12.0 m by 12.0 m /
                                                                                 10.4 m by 24.0 m /                          11.4 m by 21.0 m /                         11.4 m by 24.0 m /                          11.4 m by 21.0 m /
     Column Grid                     12.0 m by 22.0 m /
                                                                                 11.4 m by 24.0 m /                           11.4 m by 20.0 m                           11.4 m by 20.0 m                            11.4 m by 24.0 m
                                      12.0 m by 24.0 m
                                                                                  11.4 m by 27.2 m

Clear Ceiling Height                        9.0 m                                       9.0 m                                       9.0 m                                       9.0 m                                      9.0 m

    Floor Loading                       3.0 t per sq m                              3.0 t per sq m                             3.0 t per sq m                              3.0 t per sq m                              3.0 t per sq m

                                            Best                                                                           Yang Zhou Shun Feng                                 Best                                      Baina
                                                                                       Huihai
    Key Tenant(s)                           J&T                                                                           Jiang Su Shun He Feng                               Baolong                                     J&T
                                                                                     Fengwang
                                           Teneng                                                                           Yangzhou Sinotrans                                Meituan                           Ningbo Zhicheng Deppon

All information is as at Latest Practicable Date unless otherwise stated.
1) Properties that are currently undergoing stabilisation and hence are currently operating below current market levels as the current in-place rent is lower than the current market rent and/or the current in-place occupancy rate is lower than
      the current general market occupancy rate.
30

Overview of the PRC Properties (Cont’d)

                                     Mapletree Xi’an                            Mapletree Yixing                            Mapletree Yantai                           Mapletree Harbin                            Mapletree Yuyao

                                     6 blocks of single-                         6 blocks of single-                         4 blocks of single-                         4 blocks of single-                        4 blocks of single-
     Description
                                     storey warehouse                            storey warehouse                            storey warehouse                            storey warehouse                           storey warehouse

    City/Province                       Xi’an/Shaanxi                              Yixing/Jiangsu                            Yantai/Shandong                            Harbin/Heilongjiang                           Yuyao/Zhejiang

      Land Area                         122,286 sq m                                133,492 sq m                               119,210 sq m                                100,000 sq m                                 83,622 sq m

          NLA                            71,006 sq m                                73,932 sq m                                 65,071 sq m                                 59,128 sq m                                 48,914 sq m

         WALE                              0.9 year                                   1.8 years                                   2.2 years                                   1.1 years                                  1.5 years

     Land Tenure                           44 years                                   47 years                                    47 years                                    46 years                                    43 years

   Age of Building                        2.5 years                                    0.8 year                                   0.9 year                                    2.3 years                                  5.0 years

      Occupancy                              74%1                                       74%1                                         94%                                        89%                                         78%1

                                                                                                                                                                                                                    11.4 m by 26.0 m /
                                                                                 11.4 m by 24.0 m /                          11.4 m by 22.0 m /                         11.4 m by 21.0 m /
     Column Grid                      11.4 m by 24.0 m                                                                                                                                                              11.4 m by 24.0 m /
                                                                                  11.4 m by 25.0 m                            11.4 m by 24.0 m                           11.4 m by 24.0 m
                                                                                                                                                                                                                     11.4 m x 26.0 m

Clear Ceiling Height                        9.0 m                                       9.0 m                                       9.0 m                                       9.0 m                                      9.0 m

    Floor Loading                       3.0 t per sq m                              3.0 t per sq m                             3.0 t per sq m                              3.0 t per sq m                              3.0 t per sq m

                                         Gooday                                                                             Shandong Deppon                                YTO (Harbin)                                    ANE
    Key Tenant(s)                 Shanxi Huajie Logistics                           ZJ Shuangjie                                  SF                                         Zhongtie                                     Guming
                                         Yuehai                                                                               Hongjiu Fruits                                  Nezha                                        J&T

All information is as at Latest Practicable Date unless otherwise stated.
1) Properties that are currently undergoing stabilisation and hence are currently operating below current market levels as the current in-place rent is lower than the current market rent and/or the current in-place occupancy rate is lower than
      the current general market occupancy rate.
31

Overview of the PRC Properties (Cont’d)

                                                      Mapletree Chongqing          Mapletree Tianjin     Mapletree Zhongshan

                                                          2 blocks of single-      3 blocks of single-     2 blocks of single-
                Description
                                                          storey warehouse         storey warehouse        storey warehouse

               City/Province                                  Chongqing                 Tianjin          Zhongshan/Guangdong

                 Land Area                                   73,587 sq m              59,114 sq m             41,163 sq m

                     NLA                                     47,037 sq m              33,227 sq m             24,112 sq m

                    WALE                                       8.6 years               2.0 years               2.2 years

                Land Tenure                                    43 years                47 years                 46 years

              Age of Building                                  6.2 years                0.6 year               1.2 years

                Occupancy                                         91%                     92%                    100%

                                                                                   11.4 m by 24.5 m /
                Column Grid                               11.4 m by 21.7 m                                  11.4 m by 24.0 m
                                                                                    11.4 m by 21.0 m

           Clear Ceiling Height                                  9.0 m                   9.0 m                   9.0 m

               Floor Loading                                3.0 t per sq m           3.0 t per sq m          3.0 t per sq m

                                                        Chongqing Tongxiang
                                                                                        Cainiao
               Key Tenant(s)                                 Zhongtie                                              JD
                                                                                        Nezha
                                                          CQ Wulingshan

       All information is as at Latest Practicable Date unless otherwise stated.
32

Overview of the Vietnam Properties

                                                      Mapletree Bac Ninh 4                          Mapletree Bac Ninh 5                         Mapletree Logistics Park 5

                                           4 blocks of Grade A single-storey with cross-   4 blocks of Grade A single-storey with cross-   4 blocks of Grade A single-storey warehouses
                Description
                                           docking warehouses and mezzanine offices        docking warehouses and mezzanine offices                    with mezzanine offices

               City/Province                                   Bac Ninh                                     Bac Ninh                                       Binh Duong

                 Land Area                                  113,079 sq m                                  158,273 sq m                                    113,036 sq m

                     NLA                                     56,755 sq m                                   70,247 sq m                                     61,508 sq m

                    WALE                                       3.7 years                                    4.9 years                                       2.9 years

                Land Tenure                                    36 years                                      36 years                                       34 years

              Age of Building                                   0.6 year                                     0.5 year                                       1.2 years

                Occupancy                                        100%                                         100%                                            100%

                                                                                                        11.4 m by 20.5 m /
                                                          11.4 m by 24.0 m /                                                                            11.4 m by 24.0 m /
                Column Grid                                                                             11.4 m by 18.0 m /
                                                           11.4 m by 18.0 m                                                                              11.4 m by 24.0 m
                                                                                                         11.4 m by 23.5 m

           Clear Ceiling Height                                 10.0 m                                        10.0 m                                         10.0 m

               Floor Loading                                3.0 t per sq m                                3.0 t per sq m                                  3.0 t per sq m

                                                                                                          Best Logistics
                                                                 DHL                                   Indo Trans Logistics                                 DKSH
               Key Tenant(s)
                                                         Indo Trans Logistics                            Damco (Maersk)                             Wanek (Ashley Furniture)
                                                                                                            Gemadept

       All information is as at Latest Practicable Date unless otherwise stated.
You can also read