Proposed Budget 2019-2020 - Sudbury Catholic District ...
←
→
Page content transcription
If your browser does not render page correctly, please read the page content below
Proposed Budget
  2019-2020

                  1|Page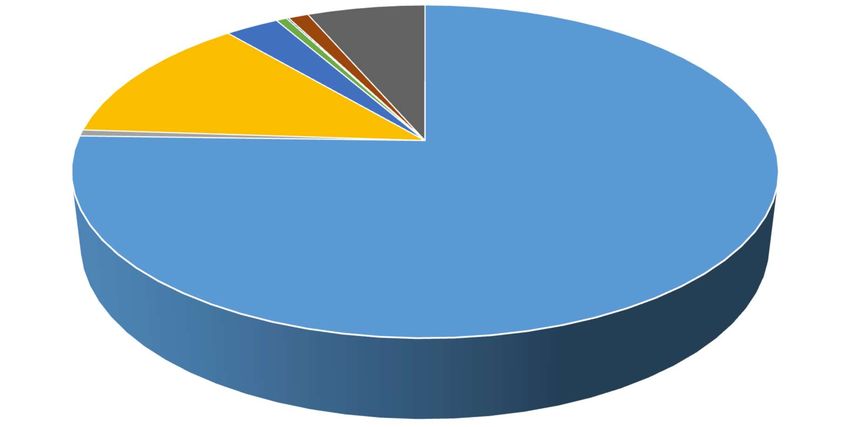
Table of Contents
Budget Framework .....................................................................................................................................................3
Highlights of the 2019-20 Grants for Students Needs ...............................................................................................4
   Program Priority Funding (formerly Education Programs – Other) .......................................................................6
Enrolment ...................................................................................................................................................................6
   Elementary Enrolment Trending by Grade.............................................................................................................6
   Elementary Global Enrolment Trending (ADE) .......................................................................................................7
   Secondary Global Enrolment Trending (ADE) ........................................................................................................7
   Population Trends for Northeastern Ontario .........................................................................................................8
   Population Trends for Greater Sudbury .................................................................................................................8
   Elementary Enrolment Projections by School and Program ..................................................................................9
   Secondary Enrolment Projections by School....................................................................................................... 10
Summary Budget Analysis ....................................................................................................................................... 11
   Summary Budget Comparison Analysis ............................................................................................................... 12
   Revenues ............................................................................................................................................................. 12
   Grants for Student Needs .................................................................................................................................... 13
   Expenditures Trending ........................................................................................................................................ 14
   Detailed Estimated Expenditures ........................................................................................................................ 15
   Explanations of Variance ..................................................................................................................................... 16
   Information Technology Capital Plan .................................................................................................................. 22
   Facilities Capital Funding ..................................................................................................................................... 22

                                                                                                                                                                           2|Page
Budget Framework
Our Mission
To realize each students’ potential within our inclusive Catholic learning community by nurturing
and developing their mind, body and spirit.
Our Vision
Leaders in Learning and Faith.
Values
Modeling Jesus in the world through faith, respect, community, innovation and learning.
The following guiding principles, current issues and trends provide guidance and direction for the
development of the budget, serve as the basis for expenditure decisions, and align with the
following Strategic Pathways:
Strengthen our faith-based, inclusive and equitable community.
Promote innovation.
Advance leadership and learning for all.
The guiding principles used by the board in the development of the 2019-20 budget continue to
be as follows:
To remain student focused guided by our strategic pathways;
To preserve programs and enhance deliverables to students;
To increase efficiencies of operations;
To ensure value for money;
To take a conservative approach; and
To ensure legislative compliance.
3|Page
Some of the current issues and or trends that the board took into consideration while developing
the budget this year are as follows:
Ability to attract and retain talent
Succession planning and leadership development
Need to reduce absenteeism
Changes in population affecting enrolment
Community Pressures
Changing needs of our staff and students (ex. Mental health)
Addressing students with exceptionalities (ex. Autism)
Retention of French as a Second Language students over time
Highlights of the 2019-20 Grants for Students Needs
On March 15, 2019 the Ministry of Education issued memorandum 2019: B08 – New Vision
for Education, in which the government communicated its plans to modernize the
classroom. On April 26, 2019 the Ministry of Education issued memorandum 2019: B14 –
Grants for Students Needs (GSN) Funding for 2019-20 and on May 10, 2019 the Ministry
issued memorandum 2019:SB06 – 2019-20 Estimates (District School Boards). In these
memos the government set out funding parameters for 2019-20 school year. A summary
of the funding are as follows:
Class Size and Supports
Early Childhood Educators funded classroom ratio change from 1.14 FTE to 1.00 FTE
Intermediate (grades 4-8) – Funded average class size adjusted from 23.84 to 24.5
Secondary (grades 9-12) - Funded average class size adjusted from 22.0 to 28.0 over 4
years through attrition in which period attrition protection will be in place
Attrition Protection
Changes to class sizes will be phased in over a 4 year period and during this period the
board will be provided top-up funding for those positions that are not reduced through
attrition. Class sizes will be increased where attrition prohibits the board to do so. (Any
staff reductions that are the result of declining enrolment will not be supplemented by the
top up funding.)
Secondary Programming
The pupil foundation grant within the GSN, funds the staffing of additional secondary
programming teacher staff at a ratio of 1.02 FTE per 1,000 Average Daily Enrolment (ADE).
This funding is scheduled to end August 31, 2019 and staffing has been adjusted
accordingly.
4|Page
Local Priorities Funding
This funding was established during the last round of collective bargaining and came into
affect for the 2017-18 school year. This funding will end with the expiry of the current
Collective Agreements August 31, 2019 and staffing will be adjusted accordingly.

Cost Adjustment Allocation
The Cost Adjustment Allocation is part of the Teacher Qualification Grant and assists in
supplementing boards for education workers salaries that are above the benchmarks
indicated in the Pupil Foundation Grant. This funding is ending August 31, 2019 and boards
are expected to use other sources of funding to support these costs.

Behaviour Expertise Amount
To allow boards to hire professional staff and enhance professional development
opportunities in the area of Applied Behaviour Analysis.

E-Learning
Starting in 2020-21, the delivery of e-learning will be centralized. Secondary students will
take a minimum of four e-learning credits out of the 30 credits needed to graduate. The
average class size will be 35. There are not enough details to determine the impact of this
initiative on the board.

Human Resource Transition Supplement
This funding was intended to temporarily supplement HR departments for additional
reporting and workloads that were created during the last round of collective bargaining.
This funding is ending August 31, 2019.

International Student Recovery Amount
For every international student the board has enrolled our GSN grant will be reduced by $1,300.

Other funding adjustment
Utilities funding and transportation funding will see increases similar to percentage increases
that have occurred in the last few years. There will also be an increase to salary benchmarks for
the coming year.

Balanced Budget
The board is expected to balance its 2019-20 budget; however, boards are permitted an in-year
deficit of no more than 1% of operating revenue of the preceding year as per the Education Act.
The additional requirement, should Bill 100 – Protecting What Matters Most Act receive Royal
Accent, is that a plan/resolution must also be submitted showing the elimination of the in-year
deficit within two years.

                                                                                        5|Page
Program Priority Funding (formerly Education Programs – Other)
Although the ministry has announced some program funding boards have not received any
transfer payment agreement so the amounts are not known at this point.

Enrolment
A significant part of the budget-setting process will be completed based on academic staffing
decisions which are made in April. These decisions are made based on grant estimates and
enrolment projections for the coming year using the best information that we have at that time.
It is important to note that our enrolment projections are derived from a combination of
historical trends, registration data, staff experience, local area knowledge and statistical
forecasting information provided from the Baragar system. Elementary enrolment has leveled
off the last couple of years and we are projecting a similar trend for the upcoming year.
However, it is projected that secondary enrolment will continue to trend downwards for at least
another couple of year. The most difficult enrolment to project is that of new FDK joining the
board and the number of grade 12’s that return.

It is important to note that when preparing class organization both the needs of the school and
the primary class requirements are taken into consideration. Class organizations are revisited in
September once students are actually in the classroom and adjustments are made accordingly.

Elementary Enrolment Trending by Grade
                                                     Enrolment (ADE)
2,500

2,000

                                                                                                              JK
1,500

                                                                                                              SK

1,000                                                                                                         1-3

                                                                                                              4-8

  500

   -
        2010-11   2011-12   2012-13   2013-14   2014-15   2015-16   2016-17   2017-18   2018-19   2019-20
                                                                                        Revised   Projected

                                                                                                   6|Page
Elementary Global Enrolment Trending (ADE)
                                                Elementary Enrolment
                                            Average Daily Enrolment (ADE)
      5,000

      4,800

      4,600

      4,400
                                                                                               Revised
                                                                                                         Projected
      4,200                                            4,076                                     4,106
                                                                                      4,040                4,070
                                                                  4,013     3,997
ADE

      4,000    3,918
                         3,792     3,784     3,758
      3,800

      3,600

      3,400

      3,200

      3,000
              2010-11   2011-12   2012-13   2013-14   2014-15    2015-16   2016-17   2017-18   2018-19    2019-20

                                                               YEAR

Secondary Global Enrolment Trending (ADE)
                                                Secondary Enrolment
                                            Average Daily Enrolment (ADE)
      3,000

      2,500
                         2,261
               2,155               2,158
                                             2,055
                                                       1,985
                                                                  1,916     1,911              Revised
      2,000
 ADE

                                                                                      1,852               Projected
                                                                                                 1,784
                                                                                                           1,703

      1,500

      1,000
              2010-11   2011-12   2012-13   2013-14   2014-15   2015-16    2016-17   2017-18   2018-19    2019-20
                                                             YEAR

                                                                                                         7|Page
Population Trends for Northeastern Ontario
                                     Population Trends of Northeastern Ontario
                     40,000

                     35,000

                     30,000

                     25,000
                                                                                                    Age 0-4
        Population

                     20,000                                                                         Age 5-9

                                                                                                    Age 10-14
                     15,000
                                                                                                    Age 15-19
                     10,000

                      5,000

                         0
                              2013   2014   2015   2016   2017   2018   2019   2020   2021   2022

Population Trends for Greater Sudbury
                                      Popultation Trends for Greater Sudbury
                     12,000

                     10,000

                      8,000
                                                                                                    Age 0-4
        Population

                      6,000                                                                         Age 5-9

                                                                                                    Age 10-14
                      4,000
                                                                                                    Age 15-19

                      2,000

                         0
                              2013   2014   2015   2016   2017   2018   2019   2020   2021   2022

                                                                                                     8|Page
Elementary Enrolment Projections by School and Program
                                          Prog. Type    J    K    1    2    3    4    5    6    7    8    Total
Holy Cross Catholic School                Regular       20   15   18   22   18   30   33   39              195
                                          FI            32   31   35   36   13   24   20   22              213
                                                                                                           408

Holy Trinity Catholic Elementary School   Regular       29   35   43   41   35   45   51   49              328
                                          FI            29   34   24   43   23   22   23   15              213
                                                                                                           541

Immaculate Conception School              Regular       12   14   16   15   14   16   22   18              127
                                          FI            12   10   13   12   7    10   10   7               81
                                                                                                           208

Pius Xii School                           Regular       20   31   19   24   29   26   26   25              200
                                          Specialized                                                      4
                                          Programs
                                                                                                           204

St. Anne School                           Regular       6    6    15   6    9    21   25   23   52   39    202
                                          FI            12   12   16   22   23   11   17   10   22   13    158
                                                                                                           360

St. Charles School                        Regular       16   12   13   13   15   18   23   13   19   14    156
                                          FI            25   28   32   27   22   30   26   15   23   18    246
                                                                                                           402

St. David School                          Regular       26   33   37   31   27   28   32   27              241

St. Francis School                        Regular       16   16   19   10   13   16   17   15              122
                                          FI            21   21   18   21   16   13   10   8               128
                                          Specialized                                                      54
                                          Programs
                                                                                                           304

St. James School                          Regular       15   13   13   10   20   17   27   18   17   18    168
                                          FI            15   16   20   16   16   15   4    19   4    7     132
                                                                                                           300

St. John School                           Regular       12   11   18   19   19   15   26   27   29   17    193
                                          FI            22   16   12   15   15   12   4    12   9    12    129
                                                                                                           322

St. Joseph School                         Regular       3    1    0    1    0    0    1    0               6

St. Mark School                           Regular       0    1    0    0    2    0    2    2               7

St. Paul School                           Regular       7    7    12   8    9    13   10   9               75
                                          FI            14   14   23   14   25   16   18   8               132
                                                                                                           207

                                                                                                          9|Page
Prog. Type     J       K   1    2       3   4    5       6    7    8          Total
Marymount Elementary                      Regular                                                      31    30          61
                                          FI                                                           12    25          37
                                                                                                                         98

St. Benedict Catholic Elementary School Regular                                                        49    59          108
                                          FI                                                           23    29          52
                                          Specialized                                                                    10
                                          Programs
                                                                                                                         170

St. Charles College Elementary School     Regular                                                      127 115           242
                                          FI                                                           22    21          43
                                          Specialized                                                                     7
                                          Programs
                                                                                                                         292

Secondary Enrolment Projections by School

                                   SCC      Marymount St. Benedict                    B.A.C.           St. Albert        Total
Enrolment Projection                 741.00      177.00     394.00                       300.00               40.00       1,652.00
Regular Projection
(98% of Enrolment Projection)           726.18          173.46           386.12           294.00             40.00        1,619.76
Self-Contained Projection                53.00                            31.00                                              84.00
Total Projections                       779.18          173.46           417.12           294.00             40.00        1,703.76

                                                                                                                      10 | P a g e
Summary Budget Analysis
0% 1%
2019-20 Estimated Revenues
1% 6%
3%
1% 13%
0%
75%
Grants for Students Needs Other Education Grants
Grants from Other Ministries - Deferred Taxation
School Generated Funds Federal Grants
Investment Income Revenues from Other Sources
Amortization of Deferred Capital Contributions
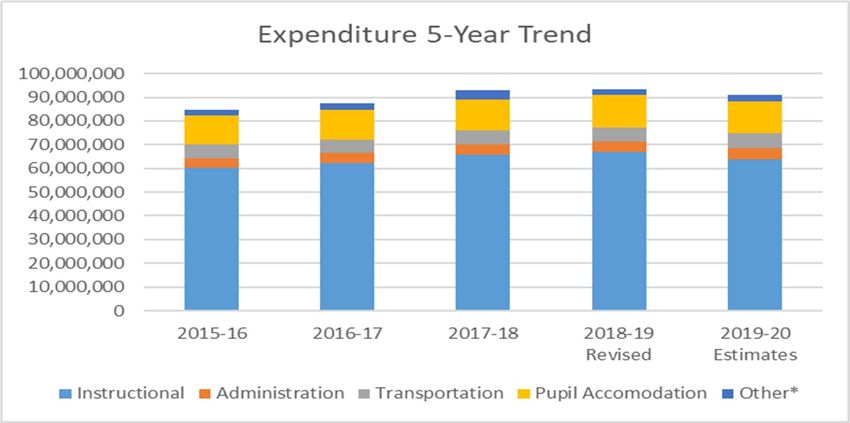
2019-20 Estimated Expenses
3% 5%
15% 7%
70%
Admin and Governance Transportation Instructional Pupil Accommodation Other
11 | P a g eSummary Budget Comparison Analysis
2018-2019 2018-2019 2019-2020
Estimates Revised Estimates
Revenues
Grants for Students Needs 69,620,905 70,876,622 69,113,430
Other Education Grants 1,902,804 1,114,198 0
Grants from Other Ministries - Deferred 570,604 558,174 555,000
Taxation 12,645,940 11,659,106 11,659,106
School Generated Funds 2,853,694 2,689,745 2,689,745
Federal Grants 598,057 694,516 535,667
Investment Income 110,000 143,000 110,000
Revenues from Other Sources 1,186,800 1,121,815 1,015,700
Amortization of Deferred Capital Contributions 5,282,441 5,330,508 5,913,733
94,771,245 94,187,684 91,592,381
Expenditures
Admin and Governance 4,699,377 4,666,987 4,430,693
Transportation 5,900,108 5,900,108 6,167,537
Instructional 67,149,073 66,828,734 64,109,202
Pupil Accommodation 13,572,389 13,540,661 13,632,478
Other 2,610,265 2,575,532 2,575,532
93,931,212 93,512,022 90,915,442
Surplus from Operations for Year 840,033 675,662 676,939
Less: Unavailable Internally Appropriated
Less: Unavailable for Compliance 800,992 665,413 665,412
Surplus for Compliance 39,041 10,249 11,527
Opening Accumulated Surplus for
Compliance 3,977,505 3,789,356 3,799,605
Surplus for Compliance 39,041 10,249 11,527
Internally Appropriated 0 0 0
Acumulated Available for Compliance 4,016,546 3,799,605 3,811,132
Accumulated Unavailable for Compliance 800,992 665,413 665,412
Closing Accumulated Surplus 4,817,538 4,465,018 4,476,544
4.24% 4.03% 4.16%
Revenues
School boards in Ontario have one main funding source, the Province, though part of this is
satisfied by a residential/commercial tax that is determined by the Province and comes from
local taxpayers. School boards calculate grant allocations in accordance with Provincial
regulations in four broad categories – Foundation Grants, School Foundation Grants, Special
12 | P a g ePurpose Grants and Pupil Accommodation Grants. Tax revenue is calculated according to
provincially-determined formulae and this amount is deducted from total grant allocations, as
calculated, to form the net contribution by the Province. Each municipality is informed by the
Ministry of Finance as to the portion of local taxes that it must forward to school boards in their
jurisdiction.
Grants for Student Needs
These grant allocations are calculated based on four broad categories. Overall the board
experienced a slight decrease in this area due to projected declining enrolment.
Pupil Foundation Grant
The Foundation grant is a per pupil allocation that supports the elements of a classroom
education that are required by, and generally common to, all students (ie. Teachers, ECE’s,
Library and Guidance, EA’s, etc. as well as textbooks and learning materials). This allocation
decreased due in part to declining enrolment and in part to the reduction of benchmark funding.
These adjustments to benchmark funding were mainly due to the change in class size however,
this is somewhat offset by the Teacher Job Protection Funding Allocation.
School Foundation Grant
This grant supports the costs of in-school administration and leadership (salaries and benefits for
principals, vice-principals, and office support staff) as well as supplies for school administration
purposes. The funding for these expenses remained consistent with the previous year and the
board does take the position that it funds these positions within this allocation.
Special Purpose Grants
Special Purpose allocations have decreased overall in 2019-20 projected estimated funding.
Significant changes in allocations are as follows:
The Special Education Allocation consists of several components, one of those is the Special
Incident Portion, which is funding through an application process and is based on the specific
needs of our system and students. We project this amount conservatively in the budget and
considering historical trending and forecasted demands. There was an increase in the Behavioral
Expertise Amount consistent with ministry direction. Our board received an additional $100K to
assist with hiring professional staff and enhance professional development opportunities in the
area of applied behaviour analysis.
The Language Allocation increased due to increased enrolment in secondary French pupil
credits.
The Learning Opportunities Allocation has significantly decreased over the previous year due the
termination of the Local Priorities Funding. This funding was approximately $825K and
accounted six positions, that will no longer be funded.
The Experience and Qualification Allocation increased significantly this year even with the
elimination of the cost adjustment and fewer teachers in the system due to the addition of the
13 | P a g eTeacher Job Protection Funding Allocation. This amount offsets the decline in the Pupil
Foundation Allocation.
The Declining Enrolment Adjustment recognizes that it takes time for boards to react and adjust
their cost structures accordingly because board costs do not all decline in a way that is strictly
proportional to the declining enrolment that they are experiencing. There is an increase in this
allocation of approximately $120K.
The Indigenous Education Allocation is also projected to increase in 2019-20 based on
anticipated increased enrolment in elementary language classes and an increase in secondary
pupil credits that is anticipated.
Pupil Accommodations Grant
The School Operations Allocation addresses the costs of operating school facilities (heating,
lighting, maintaining, cleaning) and is calculated as a combination of a per pupil amount,
community use of schools and a few other components. The board is experiencing a decrease in
this area of funding in 2019-20. This does add challenges, to an area that is already stretched to
its limits, trying to maintain aging schools and deal with the increasing costs of utilities. This
grant has also been negatively impacted by the secondary adjustment to class size as the Square
Area Factor has decreased proportionately and this drives funding in this grant.
Expenditures Trending
The trending clearly show that the board is continuously investing in the area of instructional
resources to meet the needs of its students while maintaining relatively little change in the other
areas of spending. In 2019-20 the reduction in spending on instructional resources is due in part
to the elimination of the Local Priorities Funding, and an increase in class sizes (even with the
protection funding due to retirements). Also, 2019-20 expenses do not include Program Priority
Funding agreement amounts as they are not yet confirmed.
14 | P a g eDetailed Estimated Expenditures
2018-19 2019-20
Description Revised Estimates
Budget Budget
INSTRUCTION
Classroom Teachers (Note 1) 42,533,216 40,218,759
Supply Staff (Note 1) 2,208,275 2,228,275
Teacher Assistants 4,279,269 4,843,840
Early Childhood Educator (Note 1) 1,837,500 1,837,500
Textbooks and Supplies 2,216,518 1,738,958
Computers 934,017 738,895
Professionals Paraprofessionals and Technicians (Note 1) 2,960,488 3,115,335
Library and Guidance 913,200 901,927
Staff Development 481,477 307,099
Department Heads 80,000 80,000
Principals and VPs (Note 2) 3,166,954 3,229,570
School Office 1,786,974 1,770,874
Coordinators and Consultants 2,040,588 1,869,132
Continuing Education 981,751 849,038
Instruction - Amortization and Write Downs 408,507 380,000
Total Instruction Expenses 66,828,734 64,109,202
ADMINISTRATION
Trustees (Note 3) 94,471 94,471
Directors and Supervisory Officers (Note 4) 595,719 576,136
Board Administration (Note 5) 3,924,878 3,708,086
Admin - Amortization and Write Downs 51,919 52,000
Total Administration Expenses 4,666,987 4,430,693
TRANSPORTATION
Pupil Transportation 5,900,108 6,167,537
Total Transportation Expenses 5,900,108 6,167,537
PUPIL ACCOMMODATION
School Operations and Maintenance (Note 6) 7,237,405 6,840,562
School Renewal Expense 112,663 49,099
Other Pupil Accommodation (Note 7) 1,313,129 1,253,702
Pupil Accommodation - Amortization and Write Downs 4,877,464 5,489,115
Total Pupil Accommodation Expenses 13,540,661 13,632,478
OTHER
School Generated Funds Expenses 2,575,532 2,575,532
Other Expenses Category Total 2,575,532 2,575,532
Total Expenses Category 93,512,022 90,915,442
15 | P a g eExplanations of Variances
Note 1: Instruction
Elementary Panel ($000)
Professionals/Paraprofessionals
ECE
Supply Teachers
Classroom Teachers
0 5,000 10,000 15,000 20,000 25,000 30,000
2019-20 Estimates 2018-19 Revised 2017-18 2016-17 2015-16
Professional/Paraprofessional budget is lower than the previous year, yet consistent with
the 5 year trend. The change in this year was movement of budget costs between
elementary and secondary.
Early Childhood Educators are hired at a level directly related to the number of FDK
classes with enrolment greater than 15. There were fewer classes projected for 2019-20.
Supply teacher budgets remained consistent based on current year requirement levels.
Classroom teachers’ budget decreased due to elimination of Local Priority funding and
the enrolment distribution across the system and review of special education resources.
Secondary Panel ($000)
Professionals/Paraprofessionals
Supply Teachers
Classroom Teachers
0 2,000 4,000 6,000 8,000 10,000 12,000 14,000 16,000
2019-20 Estimates 2018-19 Revised 2017-18 2016-17 2015-16
Professionals/Paraprofessionals increased in this year as there was movement of budget
costs between elementary and secondary.
16 | P a g e Supply teacher budgets remained constant based on current year requirement levels
Classroom teachers decreased due to elimination of Local Priority funding and
adjustments to class size from 22 to 28 and review of special education resources.
Protection funding assisted with the phase in of the class size change however,
retirements positions are not covered by this funding.
Special Education
2018-19 2019-20
Projected Estimates
April 30, 2019
Revenue
SEPPA (Special Education per pupil amount) 4,553,434 4,476,159
Special Equipment Amount 309,927 306,371
Differentiated Special Education amount 5,262,877 5,165,667
Special Incidence Portion Amount 1,200,000 900,000
Section 23 Facilities Amount 162,352 162,352
Behaviour Expertise Amount 114,080 228,333
Total Special Education Allocation 11,602,670 11,238,882
Expenses
All Special Education Teachers 6,423,871 5,695,588
Supply Teachers 146,964 146,964
Educational Assistants 4,279,269 4,843,840
Supplies 41,468 40,927
SEA equipment 50,000 50,000
Computers 220,000 220,541
Professionals/Technical Staff 1,165,250 1,388,920
Staff Development 38,648 38,648
Coordinator / Behavioural Expert 344,104 376,154
Total Special Education Expenses 12,709,574 12,801,582
Less: Self-Contained Classes Allocation (covered by board GSN grants) 852,703 827,882
Total Special Education Expenses 11,806,871 11,973,700
Total Surplus or (Deficit) (204,201) (734,818)
Use of Deferred Revnues
Opening Operating Deferred Revenue 703,015 750,000
Revenue for operating 11,382,743 11,018,955
Expense for operating (11,586,871) (11,753,159)
Closing Operating Deferred Revenue 498,887 15,796
Opening SEA Deferred Revenue 583,384 583,311
Revenue for SEA 219,927 219,927
Expense for SEA (220,000) (220,541)
Closing SEA Deferred Revenue 583,311 582,697
17 | P a g eThe projected budget for 2018-19 showed that we would spend the majority of the operating
deferred revenues, however with some positions remaining vacant longer than expected and
some not coming to fruition at all we are not expecting to incur the level of expenses that we
budgeted. The senior team, as part of the budget process, reviewed the resources that are part
of the special education portfolio and assessed their impact. This assessment lead to some
changes and realignment of resources (ex. removal of some facilitator positions, as they were
put in place to assist with embedded professional development in a temporary capacity). There
are also impacts on positions that were funded through special allotments that did not renew for
the upcoming year (ex. Empower and Autism). The increase in budget for Educational Assistants
consists of the combination of slightly increasing our number of EA’s and the estimated cost of
filling all the position identified for the whole school year. The change in Professional and
Technical staff is due to the fact that not all positions were filled in the current year and we are
budgeting to have them filled completely for the 2019-20 school year. The board will continue to
plan and prioritize how it will move forward ensuring to provide the supports that have the
greatest impact on meeting our students’ needs.
Program Leadership Allocation (PLA)
The PLA provides funding to support six lead positions that are included as part of Instructional
expenses and were previously funded through other allocations within the GSN and through
EPO. The PLA is enveloped, in that funding must be spent on lead’s salary, benefits, travel and
professional development. There is flexibility within the envelope to address on-the-ground
needs provided the general guidelines are followed. The following indicates the means by which
the board in planning to spend these funds.
Program
Mental School Student Early Indigenous Leadership
Health Effectiveness Success Years (TELT) Education Allocation
Leaders Leads Leads Leads Contacts Leads Total
Funding
Salary and Benefits 128,878 167,657 167,657 167,657 101,157 83,828 816,834
PD / travel amount 13,455 17,503 17,503 17,503 10,561 8,752 85,277
142,333 185,160 185,160 185,160 111,718 92,580 902,111
Expenses
Salary and Benefits 200,000 167,912 167,912 167,912 159,775 329,330 1,192,841
PD 10,000 11,503 11,503 11,503 5,561 5,756 55,826
Travel 3,455 6,000 6,000 6,000 5,000 3,000 29,455
213,455 185,415 185,415 185,415 170,336 338,086 1,278,122
Under/(Over) spent (71,122) (255) (255) (255) (58,618) (245,506) (376,011)
Please note that the overflow in the Mental Health Leaders, TELT and Indigenous Education columns are
being charged to the consultant and professional/paraprofessional lines in the budget.
Note 2: Principal/Vice-Principal
This School Foundation grant supports the cost of in-school administration and leadership. The
board has made it a priority to maintain expenses to a level that can be offset by this grant to
ensure that administration expenses are reasonable and within the guidelines provided.
18 | P a g ePrincipal and Vice-Principal staffing has been distributed as below noted and is within the
funding allocation.
Elementary Panel
School 2019-20 2019-20
Principal Vice-Principal
Holy Cross School 1.00 0.50
Immaculate Conception School 1.00
Pius XII School 1.00
St. Anne School 1.00 0.50
St. Charles School 1.00 0.50
St. David School 1.00 0.20
St. Francis School 1.00 0.20
St. James School 1.00
St. John School 1.00
St. Joseph School St. Charles College
VP will cover
St. Mark School St. Paul's Principal
will cover
St. Paul School 1.00
Holy Trinity 1.00 0.80
11.00 2.70
Secondary Panel
School 2018-19 2018-19
Principal VP Time
St. Charles College 1.00 2.00
Marymount Academy 1.00 1.00
St. Benedict 1.00 1.83
Bishop Alexander 1.00 1.00
St. Albert's 0.20
4.20 5.83
Staffing 15.20 8.53 3,229,570
Funded FTE's 17.20 7.29 3,452,010
19 | P a g eNote 3: Trustees
Trustee Governance Budget 2018-19 2019-20
Revised Estimates
Honoraria (Note 1) 59,294 59,294
Benefits (CPP,EI,EHT) 2,480 2,480
Provincial Negotiation(Note 2) 43,017 43,017
Membership Fees - OCSTA (Note 2) 32,000 32,000
Professional Development 21,650 21,650
Travel 4,000 4,000
Technology 4,000 4,000
Office Supplies and Services 3,047 3,047
Total 169,488 169,488
Note 1 - Honoraria - Each trustee is paid a base amount, an enrolment amount, a committee attendance amount (if applicable)
and a distance amount (if applicable) as per Ontario Regulation 357/06.
Note 2 - These items are considered part of the Board Administration budgets.
Note 4: Director and Supervisory Officer
The ministry provides funding for a Director of Education and 1.68 Supervisory Officers outside
of the Program Leadership Allocation (PLA). The board allocates the portion of funding related
to the Supervisory Officer to the Superintendent of Business and a portion of the Superintendent
that is responsible for Special Education. The budget for these positions are well within the
funding provided.
Note 5: Board Administration
Fees
Salaries Supplies
Employee Staff and Other Total
and and
Benefits Development Contract Expenses Expenses
Wages Services
Services
Board Admin - Trustees - 75,017 75,017
Board Admin - Directors and - 3,000 20,000 23,000
Supervisory Offices
Directors Office 223,272 57,451 - - - 280,723
Finance 324,415 81,104 9,280 36,240 113,000 564,039
Procurement 71,626 17,906 4,500 480 10,300 104,812
Human Resource Administration 591,820 153,767 16,980 58,105 278,680 1,099,352
Payroll Administration 130,904 32,726 3,830 1,480 168,940
Administration and Other 332,363 91,500 19,800 53,700 120,000 617,363
Information Technology 374,629 78,215 32,361 53,786 235,849 774,840
Administration
Board Administration 2,049,029 512,669 86,751 206,791 777,829 75,017 3,708,086
20 | P a g eNote 6: Facilities
2018-19 2019-20
Category Revised Estimates
Description Budget Budget
Custodial Operations Wages 2,461,622 2,404,000
Benefits 726,942 677,160
Supplies 215,000 195,000
Services 520,320 320,000
Maintenance Operations Wages 254,748 264,000
Benefits 93,940 94,260
Supplies 125,806 136,000
Services 442,823 378,323
Utilities Electricity 735,509 726,500
Heating - Oil 20,000 20,000
Heating - Gas 301,173 300,000
Water and Sewerage 242,280 225,000
School Operations and Wages 544,250 560,000
Maintenance Administration
Benefits 163,566 162,500
Supplies 5,000 3,000
Fees 32,095
Furniture and Equipment Expenses 70,000 58,500
HR and Professional Development 28,500 28,000
IT and Communication 8,376 7,474
Travel Expenses 17,000 21,500
Vehicle Expenses 78,000 70,500
Insurance 115,000 115,000
Miscellaneous Expenses 22,050 12,250
Leases Operating Component 45,500 29,500
Total Expenses 7,237,405 6,840,562
Note 7: Other Pupil Accomodation
This is the interest expense for two separate ‘loans’. In 2003, the government undertook a
review that made it clear that the state of Ontario’s school buildings was getting in the way of
the instruction being taught within them. The action plan to this was ‘Good Places to Learn’
whereby the government committed to supporting the financing of these projects for a period of
18 months and would reimburse boards who invested at the time the loans payments were due,
both principal and interest. This was the same case for a debenture loan that was entered into
by the board. The debenture was to invest in the purchase and upgrade of Bishop Alexander
Carter (BAC). Again this was completely funded by the government, both the principal and
interest.
21 | P a g eInformation Technology Capital Plan
2018-19 2019-20
Estimates Estimates
Funding Allocation
GSN - operating 279,857
GSN- Minor Tangible Capital Assets 486,865 820,000
Planned Expenditures
FDK/Early Learning Refresh 41,621
Intermediate iPad refresh 103,340
Secondary tablet/laptop refresh 216,677 129,498
Classroom Projector refresh (partial) 117,576
Student Link & Overdrive Subscription 6,978 7,510
Office 365 - Online collaboration 60,351 66,386
Enhance bandwidth (Wifi and Internet) 25,000
Enhance/refresh Enterprise Wifi 43,126 51,751
System Management Tools 22,493 22,493
Refresh Core Server Infrastructure 8,900
Refresh 25% Board Admin PC's 16,245
Disaster Recovery - Ongoing 65,000
Replacement of HR/Payroll System 300,000
Special Education Student Devices 220,541 220,541
707,406 1,038,621
Less: Equipment purchased through SEA (220,541) (220,541)
486,865 818,080
Facilities Capital Funding
2018-19 2019-20
Funding Allocation
Estimates Estimates
School Renewal Allocation
Capital 1,201,935 1,248,896
Maintenance 111,750 56,481
School Condition Improvement
70% Restricted to Major Building Components 3,128,846 3,377,423
30% Unrestricted to Locally Identified Renewal Needs 1,340,934 1,447,467
Greenhouse Gas Reduction - Apr 1, 2018 - March 31, 2019 496,650 NIL
Community Hub: 17-18 Allocation 386,738 NIL
6,666,853 6,130,267
22 | P a g eSchool Condition Improvement (SCI)
This funding source is to be used to keep schools in a state of good repair, starting in 2015-16,
school boards are required to direct 70 percent of their SCI funds to address major building
components (for example, foundations, roofs, windows) and systems (for example, HVAC and
plumbing). The remaining 30 percent of SCI funding can continue to address specifically
identified building components or, alternatively, building interiors and surrounding site
components (for example, utilities, parking and pavements).
Unspent funds in any given school year will be carried forward to the next school year and
continue to follow the “70/30” rule.
School Renewal Allocation (SRA)
This funding is provided for the purpose of addressing costs related to the repairs and
renovations of our schools. There has also been some additional funding provided for this
purpose whose use has been split with 40 percent of the funds allocated towards operating/
maintenance type expenditures (e.g. painting) and the remaining 60 percent of the funds
allocated towards expenditures that are capital in nature (e.g. roof repair, accessibility
enhancements, portable repair). While the operating / maintenance funds can be put towards
capital investments, the additional capital funds cannot be put towards operating / maintenance
items. Unspent SRA funds in any given school year will be carried forward to the next school
year. Any unspent operating / maintenance funds will be carried forward to address operating /
maintenance expenditures in the next school year.
Capital Project Selection
The following is a high- level overview of capital projects under consideration for completion for
the 2019-20 school year. Final project selection will be determined once an evaluation using
identified selection criteria is completed. Project selection may change due to sudden or urgent
needs that can arise through the school year.
Project selection criteria:
1. VFA Assessments – These are facility condition assessments for each site identifying the
life cycle of building components and assets and prioritizing each event by recommended
date of completion. This database is operated by the Ministry of Education and each
assessment is updated at identified intervals.
2. Budget – The Capital Budget consists of School Renewal funding and School Condition
Improvement funding which may change year over year. Projects are selected in
adherence to confirmed financial resources. Occasionally the Ministry of Education may
provide additional one time or targeted funding such as the Greenhouse Gas Reduction
Fund that supports energy saving projects.
3. Operational Impact – Project evaluation includes potential impact to operational costs
and utility budgets. Projects with a better pay back period may be given preference.
23 | P a g e4. School Needs – Discussions with school administration on identifying facility and/or
program needs are ongoing throughout the year and this information is included as part
of final project evaluation.
Capital Projects Forecasted for 2019-20
(Budgets are high-level estimates and will be updated once scope of work is finalized)
Site Project Description Budget
Holy Trinity/SCC Parking lot upgrades based on CIMA recommendations 600,000
St Charles College Phase 2 - Corridor retrofit/HVAC/electrical distribution upgrade 950,000
Various LED lighting upgrades at sites TBD 300,000
Various Washroom upgrades at sites TBD 300,000
St. Charles Elem. Exterior wall investigation/remediation and interior upgrades 400,000
MMA Phase 4 - interior fit up/HVAC/exterior wall remediation 1,000,000
St Albert Interior renovations 450,000
Bishop Alexander Siporex roof replacement 800,000
Various HVAC upgrades at sites TBD 300,000
St Francis Interior upgrades 250,000
5,350,000
24 | P a g eYou can also read