PSA & Opel / Vauxhall Alliance: Driving Towards A Better Future - Groupe PSA

Page created by Sue Bradley
 
CONTINUE READING
PSA & Opel / Vauxhall Alliance: Driving Towards A Better Future - Groupe PSA
PSA & Opel / Vauxhall Alliance: Driving Towards A Better Future
PSA & Opel / Vauxhall Alliance: Driving Towards A Better Future - Groupe PSA
A Game-Changing Alliance for PSA & Opel / Vauxhall
• Leading European OEM: #1 / #2 Positions Across Key Markets
• Complementary Brands
• Drive Efficiency on a Higher Scale
• Stronger Homebase to Address International Growth Opportunities
• Step-Change in Innovation Capability

 4.3 MM                                                   €55 Bn                                                           €4.8 Bn          +50%
    Vehicles                                                Auto Revenue(1)                                                Auto EBITDA(2)   R&D Spend

     Notes
     1. 2016A metrics
     2. 2016E metrics. Defined as recurring operating income + D&A, assuming 40% of Opel / Vauxhall Auto R&D capitalized                                2
PSA & Opel / Vauxhall Alliance: Driving Towards A Better Future - Groupe PSA
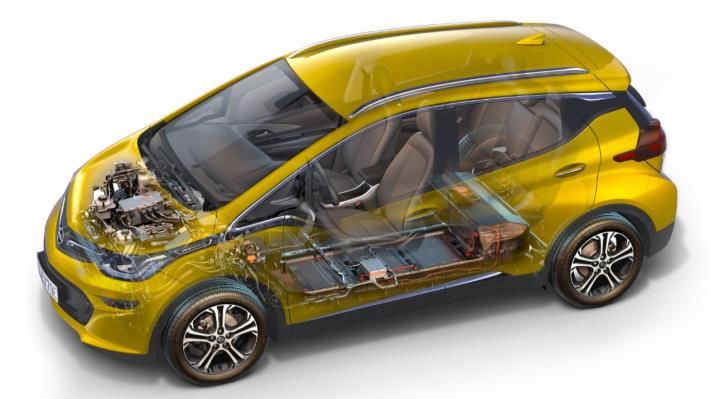
Opel / Vauxhall Teams to Drive Turnaround with Full PSA Support

                                                                  3
PSA & Opel / Vauxhall Alliance: Driving Towards A Better Future - Groupe PSA
Alliance Will Enhance Push-to-Pass and Raise Opel / Vauxhall to Industry Benchmark

                                                                   Current Perimeter

                                                                   Growth(1) by 2018 vs 2015
  Group Revenue                            10%
                                                                   Additional 15%(1) by 2021E

   Automotive                                               Average                                             (4)                    (4)
Recurring Operating                       >4.5%               over                     >6%   by 2021E(3)     2%       by 2020E      6%       by 2026E
      Margin                                               2016A-18E

 Operational Free
                                                                                                           Positive              by 2020E
  Cash Flow(2)

       Notes
       1. At constant (2015) exchange rate
       2. Defined as ROI + D&A – restructuring – capex – Capitalized R&D – Change in NWC
       3. vs. initial guidance of 6% by 2021
                                                                                                                                                        4
       4. Subject to full review of IFRS – US GAAP differences
PSA & Opel / Vauxhall Alliance: Driving Towards A Better Future - Groupe PSA
Existing PSA – Opel / Vauxhall OEM Partnership Already Delivering Significant Results
    Proven Cooperation Model                                Impact of 3 Joint Vehicle Programs from                c.€1.1 Bn Savings Already
    Based on Three Key Pillars                                           2017E Onwards                          Generated With Add. €0.3 Bn p.a.

                                                           Crossland X    C3 Aircross                           PSA Share - In € Bn
    Joint Purchasing Organization
                                                                                        220k units (2018E)(1)
    – Alignment of pricing to
      benchmark on joint procurement                                                      BVH1 platform           R&D/ Capex, Joint         +0.3 p.a.
                                                                                                                     Purchasing
      base                                                                                   Opel plant           Organization (JPO)
                                                                 Launch 2017E
    Joint Product Development &                                                                                          1.1
    Cross-Manufacturing
                                                           Grandland X   Peugeot 3008                                                  Mainly related to JPO
    – Three common vehicles                                                                                                            and purchasing on 3
                                                                                        300k units (2018E)(1)
      (20% of combined volumes)                                                                                                               projects
                                                                                          EMP2 platform
    – Projects on time/ at cost
                                                                                             PSA plant
    – Cost efficiency
                                                                 Launch 2017E

    Strong Cultural and Engineering
    Fit                                                           B-LCV

    – Joint working groups across both                                                  300k units (2019E)(1)
      companies                                                                           EMP2 platform                   0                      0
                                                                                                                   2012–17 Savings      Additional Savings
    – Track record in delivering                                                             PSA plant                 @ PSA                  @ PSA
      tangible savings                                           Launch 2018E

       Sources: Company Information, IHS (February 2017)
       Note
       1. Based on IHS                                                                                                                                         5
PSA & Opel / Vauxhall Alliance: Driving Towards A Better Future - Groupe PSA
The PSA – Opel / Vauxhall Combination Leads to Mass Market Leadership
                A Transformational Strategic Combination(1)...                                                         ...Strengthening PSA’s Position in Europe’s Mass OEM Market

                                                                                                                 European Light Vehicle Sales(2)
                                                                                                                 MM Units, 2016A

                                                                                                                  22.5%       17.1%       14.4%    7.9%   6.9%   6.6%   5.9%   5.6%

 Global Sales                                                                                                       3.9
                             3.1                                1.2                               4.3
  (MM units)

                                                                                                                                 3.0

  European                                                                                                                                 2.5
                           10.7%                              6.5%                              17.1%
   Market
                            (# 3)                             (# 7)                              (# 2)
   Share(2)

                                                                                                                                                    1.4
                                                                                                                                                           1.2   1.1
   Auto.                                                                                                                                                                1.0    1.0
  Revenue                   37.1                               17.7                              54.8
   (€ Bn)

                                                                                                                       0          0         0        0      0     0      0      0

Auto. EBITDA
                             4.0                              0.8(3)                              4.8
   (€ Bn)
                                                                                                                   %       Market Share

          Source: Company information, IHS Automotive (February 2017)
          Notes
          1. Based on 2016 figures
          2. Excluding Russia and Turkey
                                                                                                                                                                                      6
          3. Defined as recurring operating income + D&A, assuming 40% of Opel / Vauxhall Auto R&D capitalized
PSA & Opel / Vauxhall Alliance: Driving Towards A Better Future - Groupe PSA
Strong Geographic Complementarity
            Strong Complementarity                                      Leading Positions (#1 / #2) Across European Markets

                                                     2016A PSA & Opel / Vauxhall Volumes
                                                                                                                               +

      3.6
                             #8                 #6                                                                   11%           #2

      3.1
                             #6                 #4                                                                   17%           #2

      2.4
                             #2                 #9                                                                   31%           #1

      2.0
                             #4                 #6                                                                   14%           #2

                             #3                 #5                                                                   22%           #1
      1.3

      0.6
                             #3                 #5                                                                   21%           #1
    Market Size (MM units)                                 PSA Volume      Opel / Vauxhall Volume   PSA + O / V Market Share

       Source: IHS Automotive (February 2017)

                                                                                                                                        7
PSA & Opel / Vauxhall Alliance: Driving Towards A Better Future - Groupe PSA
Differentiated Brand Awareness and Image

  High Level of Spontaneous Brand Awareness…                                               …A Strong Image…       …and Low Cannibalization Risk

                                                                                                                        Willingness to Substitute(1)

                                                               64%
PSA & Opel / Vauxhall Alliance: Driving Towards A Better Future - Groupe PSA
Major Improvement in Momentum at Opel / Vauxhall
                                  Effective Strategic Action Plan Launched                                                           Improving Financial Performance(1)

                                                                                                                                   European Sales Volume (‘000)

 Model and                             29                                                              60%                                             +7.7%
                                                                                                                                                                   1.16
  Engine                                                                                                                                      1.08
 Offensive
                              Model launches over                                                   2016A sales with
                                2016A–2020E
Clear Additional Levers to Drive Performance Towards Benchmark Levels
                                                                              Relative Performance Across Key Metrics

2015A Harbour Rate                                                                                          Efficiency (# Hours / Car)

                                                                                                                    28.5                                            28.1

                                                                                   105%                                                   24.4
                                                96%
           82%
                                                                                                                                                     21.6

      Opel / Vauxhall                           PSA                            EU Average                           PSA                    PSA     Benchmark   Opel / Vauxhall
                                                                                                                  (2012A)                (2015A)

                                                                                                            Inventories % of Revenue
PSA Harbour Rate Evolution
                                                 96%                               98%                                                                             14.2%
                                                                                                                   11.6%
                                                                                                                                          7.7%       7.7%
          79%

         2014A                                2015A                                 2016A                           PSA                    PSA     Benchmark   Opel / Vauxhall
                                                                                                                  (2012A)                (2016A)                 (2016A)

          Sources: Company information, Harbour- Analyse DSI
          Note
          1. EU average includes: Kia, BMW, Mercedes, Renault, VW, PSA, Ford, Jaguar, FCA, Opel/ Vauxhall
                                                                                                                                                                                 10
Significantly Enhanced Scale Across Segments, Especially B & C
                     Segment                         Model Examples                     Europe Light Vehicle Sales (2)                                 Market Position
                                                                                        ‘000 Units, 2016A
                                                                                                                     Significant scale enhancements
                                                                                                                     on most competitive segments
                 A                                      C1                Adam                               242                                       #4            #2

                 B                                      208               Corsa                                                                  708   #3            #2

                 C                                      308               Astra                                                      521               #2            #2

                                                                                                                                                       #6            #3
 Passenger Car

                 D                                      508               Insignia                    131

                      B-SUV                             2008              Mokka                                              422                       #2            #2

                      C-SUV                             3008              Grandland X             106                                                  #5            #5

                      B-MPV                             C3 Picasso        Meriva                 89                                                    #7            #2

                      C-MPV                             5008              Zafira                               263                                     #2            #1

                       EV(1)                            ION               Ampera-E(1)     2.1

                                                             Berlingo /
                                                                          Combo
                                                             Partner                                                           442                     #2            #1
 LCV

                                                             Expert/
                                                                          Vivaro
                                                             Jumpy
                                                             Jumper/                            PSA                Opel / Vauxhall
                                                                          Movano
                                                             Boxer

                       Sources: IHS Automotive (February 2017)

                       Notes
                       1. Launched in 2016A
                                                                                                                                                                          11
                       2. Excluding Russia and Turkey
PSA Platforms and Powertrain Rapidly Rolled Out to Opel / Vauxhall
             Ramp Up of Joint Platforms to Full Convergence Within 8 Years                         Complementary Powertrain Offering
 % Combined Volumes on Common Platforms
                                                                                              PSA technologies deployed on Opel / Vauxhall
100%
                     Expected completion
                     of transaction                                                           – Small efficient ICE

                                                                                              – PHEV
80%
                                                                                              – Electric platforms (E-CMP)

                                                                            c. 70% by 2023E
60%

                                                                                                            Combined Sourcing
                                                                            c. 50% by 2020E
40%                                                                                           Platform convergence will facilitate combined
                                                                                              sourcing
       Crossland X
                                                                                               % Sourcing from Europe
20%
       Grandland X

                                                                                                     c. 45%             vs.        92%
                       Combo

 0%
       2017E                  2019E                 2021E   2023E   2025E             2027E

           Source: IHS Automotive (February 2017)

                                                                                                                                              12
Combination to Generate Annual Synergies of €1.7 Bn and €1.2 Bn Working Capital Release
                                               • Scale effects
      Purchasing               c. 30%          • Technical best practices leading to optimized purchasing
                                               • Combination of purchasing functions and European sourcing
                                               • Convergence of platforms and powertrains
         R&D                   c. 25%          • Design to cost
                                               • Full digitalization of product development

                                               • Alignment of industry benchmarks
     Manufacturing             c. 20%          • Plant modernization and improved efficiency

                                               • Alignment with industry benchmarks
        SG&A                   c. 10%          • Multiple areas of joint savings

                                               • Leveraging gains in manufacturing efficiency and common developments
        Capex                  c. 15%          • Optimization of joint capex

                           c. €1.7 Bn p.a.                        c. €1.1 Bn p.a.                            c. €(1.6) Bn

                      Run-Rate Synergies By 2026E    Synergies Expected By 2020E (c. 65%)             Total Implementation Costs

    Working Capital                            • PSA with strong track record
                              c. €1.2 Bn       • Full realization by 2022E
     Optimization

                                                                                                                                   13
Scope for Greater Innovation and Optimised Technology Spend
                      Opportunity to Optimize R&D Budget                                                      Re-Direct Investments to “Future Mobility” Technologies

R&D Budget
€ Bn                                      o/w €0.9 Bn outsourced
                                              R&D in HCC(1)

                             1.4                                   Net gain

                                                                                                                  Connected Car                 Autonomous Driving
                                                 3.3                                  2.9

     1.9

                                               Total           Savings /           Expected
                                              Budget      Joint Development        Combined
    2016A                    2016A                      (Platform / Powertrain)     Budget
                                                          & Reinvestment in
                                                          New Technologies                                        Shared Mobility                 Electric / Hybrid
                                                                              Target c. 5% of total revenue

            Source: Company information

            Note
            1. High Cost Countries
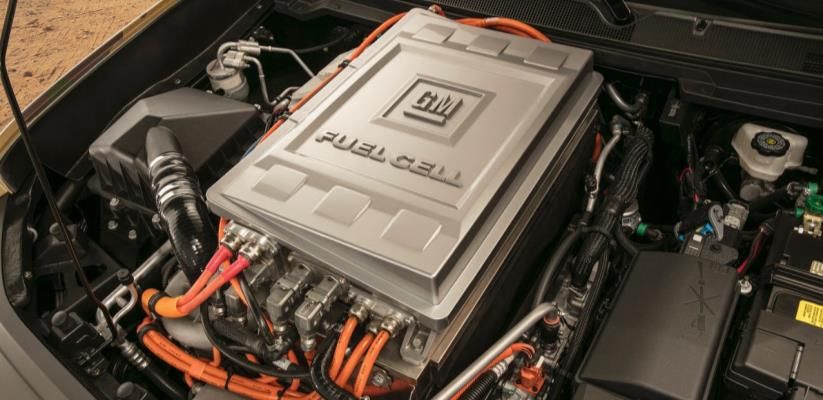
                                                                                                                                                                      14
Broadening Partnership with General Motors in Advanced Technologies and Services

                                                            • Long-term supply of Fuel Cell Stack system for
                                            Fuel Cell         future PSA vehicle

                                                            • PSA and General Motors electrification component
                                          Electrification     technology cooperation
                                                            • Shared purchasing and related scale

                                                                                                                 15
Auto Transaction Consideration for PSA of €1.32 Bn

 Opel /
 Vauxhall     €1.32 Bn   • 7.4% 2016A pro forma Revenue
 Automotive

 General                 • GM retains all pensions obligations excluding German active workers and certain
 Motors                    regional plans contributed to PSA
                 -
 Europe                  • Total net underfunded status of pensions obligations retained by GM: c. $6.5 Bn
 Pensions                • GM to fully fund plans assumed by PSA on IFRS (c. €3.0 Bn funding)

                                                                                                             16
PSA and BNP Paribas To Acquire General Motors’ European Financing Activities

            Continuation of PSA’s Highly Successful Partnership Model in Consumer / Dealer Financing,
                             Supporting the Development of Automobile Distribution

  • PSA and BNP Paribas to acquire General Motors Europe financing activities for €0.9 Bn, 0.8x Book Value

  • 50 / 50 ownership, with BNP Paribas to consolidate the entity

  • Well capitalised, low risk profile financing activity

  • Significant room for value creation through the partnership and alignment of Opel Financing Activities with
    best in class levels (penetration, cost of funding, IT platform…)

                                                                                                                  17
GM Europe Financing Activities Serve Opel and Vauxhall Across Europe
                 A High Quality Auto Finance Player
                                                                                            Pan-European Footprint
            Critical to Opel / Vauxhall’s Auto Operations

  Pan-European footprint, present in 11 countries
                                                                                72% of Earning
  Long-standing relationship with ~1,800 dealers                              Assets in Germany
                                                                                  and the UK
  Full spectrum product offering to consumers and dealers, including
   leasing activities in Germany
  Robust funding platform leveraging on German deposits (€1.8 Bn)
   and securitisation capabilities (€4.0 Bn)
  Earning Assets of €9.6 Bn (2/3 consumer, 1/3 commercial)
  c. 31% of Opel sales with an Opel financial service

                 Significant Value Creation Potential

  Rollout of best practices to raise Opel financial services
   performance to benchmark levels
  Leverage access to highly attractive cost of funding to ensure
                                                                        Geographies operated by General Motors European Financing Activities
   competitive offering

                                                                                                                                               18
FinCo Transaction Consideration for PSA of €0.46 Bn

                        • 0.8x 2016A P / BV of €1.2 Bn
                          ─ c. 9% 2016A RoE / 12% leverage
 General
 Motors                 • Acquired 50/50 with BNP Paribas
 Europe      €0.46 Bn
 Financial                ─ Formation of 50 / 50 JV
 Services                 ─ Funding gap assumed by BNP Paribas
                          ─ PSA share: c. €0.46 Bn
                          ─ Full consolidation by BNP Paribas, accounted for under the equity method by PSA

                                                                                                              19
Transaction Financing With Limited Impact on PSA Net Cash Position

                                                  •    Cash on balance sheet (c. €0.67 Bn) and warrants (c. €0.65 Bn)
                                                  •    In connection with the transaction, GM would subscribe to warrants with a 9-year maturity, exercisable
                                                       from 5th anniversary of issuance, corresponding to c. 39.7 MM PSA shares(1) / 4.2% of share capital(2)
                                                       ─ €1 strike (nominal)
                                                       ─ €17.34 reference price(1), total value of €0.65 Bn
 Opel / Vauxhall Automotive
                                                       ─ No governance rights, no voting rights
          €1.32 Bn
                                                       ─ Not transferrable
                                                       ─ Undertaking to sell shares upon exercise within 35 days
                                                       ─ Subject to May 10th EGM vote
                                                       ─ Undertaking from FFP/ EFP/ French State/ DFM (in aggregate 36.6% of capital and 51.5% of voting rights(2))
                                                         to vote resolution

   GM Europe Financial
     Services (50%)                               •    Cash on balance sheet
        €0.46 Bn

                                                                Cash-out / Net debt impact for PSA:                                                        Warrants:
                                                                            c. €1.13 Bn                                                                   c. €0.65 Bn
                                                                  64% of total transaction value                                                 36% of total transaction value

       Notes
       1. Reference price is the 20-day volume-weighted average share price of PSA as of February 13th, 2017 (pre-leak of February 14th, 2017)
       2. Based on fully diluted number of shares outstanding of 907 MM shares PF exercise of all outstanding 2014 warrants                                                       20
PSA Preserves Financial Flexibility

•   Total impact on net cash position of €(1.2) Bn

•   PSA pro forma 2016A net cash position of €5.7 Bn(1), leaving ample headroom for further profitable growth

    opportunities internationally

•   PSA pro forma transaction 2016A financial security at €16 Bn(1)

•   Pensions issue addressed, pension benefit obligations fully funded by General Motors at closing

        Note
        1. Manufacturing and sales companies, i.e. excluding finance companies
                                                                                                          21
An Attractive Transaction for PSA Shareholders

•   Opel / Vauxhall Automotive acquired for €1.3 Bn

    – 7.6% 2016A Revenue

•   c. €1.2 Bn working capital optimization opportunity

                                                                                                                         After-tax net present value of
                                                                                                                            synergies of c. €9 Bn(1)
•   Run-rate synergies of c. €1.7 Bn by 2026E

    – Front-loaded realisation: c. 65%+ by 2020E

•   FinCo acquired at 0.8x Book Value with increased profitability improvement potential through partnership

        Note
        1. NPV based on 10% WACC and 0% PGR, including €1.2 Bn working capital optimization fully materialized by 2022
                                                                                                                                                          22
Next Steps / Contemplated Timetable

                                                             • PSA and GM Supervisory Boards unanimously approved the transaction

                                                             • PSA Holding works councils approved the transaction

                                                             • Customary anti-trust and regulatory approvals
   Key Approvals
                                                             • Warrants issuance subject to shareholders’ approval at PSA EGM
                                                                  ‒ Core shareholders (FFP/ EFP, French State, DFM) undertakings to vote resolution(1)
                                                                  ‒ In the event the issuance is not approved by PSA’s EGM, PSA will settle the €0.65 Bn in
                                                                    cash over 5 years

                                                            • May 10th, 2017: PSA EGM
   Key Milestones
                                                            • Q4 2017: Expected closing

      Note
      1. Representing in aggregate 51.5% of theoretical voting rights assuming all warrants outstanding as of December 31 st, 2016 are exercised              23
Appendix: Additional Materials

                                 24
GME to Opel / Vauxhall Contributed Entity Walk-Through (Excluding Financial Services)
                                               Pro forma adjustments: distribution agreements of Cadillac/
                                               Chevrolet brands in Europe, carve-out of excluded activities,
                                                                    standalone costs
        (1)                                                                                                                            Contributed Perimeter
€MM                                                                                                                                                     (3)
                                                                              GME                                                           Standalone
P&L items                                                                    2016A                                                             2016A
Revenue                                                                      16,915                                                            17,743
EBITDA (pre-restructuring costs)                                               324                                                              230
 % margin                                                                    1.9%                                                             1.3%
       (2)
D&A                                                                            513                                                              511
 % revenue                                                                   3.0%                                                             2.9%             ROI %        2016A    2020E
ROI                                                                           (189)                                                            (282)
 % margin                                                                    (1.1%)                                                           (1.6%)                        (1.6%)   Positive
Restructuring costs                                                            (43)                                                            (43)
                                                                                                                                                                                           (4)
                                                                                                                                                                      (3)
EBIT                                                                          (232)                                                            (325)           IFRS                  2.0%
 % margin                                                                    (1.4%)                                                           (1.8%)

CF items
Capex                                                                        (1,041)                                                          (1,035)
 % sales                                                                     (6.2%)                                                           (5.8%)

BS items
Inventories                                                                                                                                    2,520
 % revenue                                                                                                                                    14.2%
              Notes
              1. EUR / USD 2016A FX rate of 1.1060
              2. Excluding R&D amortization as per US GAAP standards                                                                                                                    25
              3. Based on contributed entity (pro forma derived from GME accounts in US GAAP & adjusted to perimeter of transaction)
              4. Subject to full review of IFRS – US GAAP differences
Considerations on R&D Accounting: US GAAP vs IFRS

•   R&D is fully expensed in GME accounts under US GAAP
    – Opel / Vauxhall R&D expenses amount to €1.4 Bn in 2016

•   Under IFRS, PSA capitalizes part of gross R&D spending
    – Historically the capitalization rate has been of 40% in average
    – The R&D capitalized recognised in intangible assets is amortised from the start-of-production date, generally 2 years
      after the accrual, over the asset’s useful life (representing up to 7 years)

                                                                                                                              26
Opel / Vauxhall D&A Trajectory(1)

Rebased to 100
250

200
                                            Progressive alignment of D&A on capex
                                                level reflecting the extinction of
                                            c.$5.5 Bn impairment of GME long-lived
                                           assets in 2012 out of $15.8 Bn of assets in
                                                               2011

150

100
                     2016A                                          2017E                2018E   2019E   2020E

           Note
           1. Excluding R&D amortization as per US GAAP standards
                                                                                                                 27
PSA’s Recent International Developments
                        PSA will continue to pursue its international expansion and diversification strategy

                        • Signed a JV agreement with CK Birla Group to produce and sell vehicles and components in India by 2020E
        India            – Joint investment of c. €100 MM
                        • Recently acquire Ambassador brand in India from Hindustan motors

                        • Strongly positioned in China – 736k units in 2015A, 1 MM units mid term target
                        • Successful partnership with Dongfeng Motors
                         – Joint development of electric Common Modular Platform
        China
                         – Will deliver a worldwide offering of all-electric, high-performance B and C segment vehicles from 2019E
                        • JV with China Changan Automobile Group
                         – Production plant and R&D center in Shenzhen

                        • Investing in LCV business
    Latin America
                        • €320 MM investment in Argentina on a new platform

                        • New PSA plant in Morocco under construction
  Middle-East, Africa
                        • Local footprint through partnerships to access closed markets

                                                                                                                                     28
You can also read