Pushed to the Margins - A Quantitative Analysis of Gentrification in London in the 2010s - Runnymede Trust
←
→
Page content transcription
If your browser does not render page correctly, please read the page content below
Runnymede and CLASS report

Pushed to
the Margins
A Quantitative Analysis of Gentrification
in London in the 2010s

Adam Almeida
Runnymede:                           Acknowledgements
                                      This report was made possible thanks to the generous
 Intelligence for a                   support of Trust for London. Thank you to Dr. Halima Begum,
                                      Ellie Mae O'Hagan and John Page, who provided comments
 Multi-ethnic Britain                 and contributions. I would like to especially thank Dr. Faiza
                                      Shaheen, Dr. Phil Hubbard and Tim Wickson for their brilliant
                                      insight which helped shape the work, as well as numerous
 Runnymede is the UK’s                others who shared their understanding and personal
 leading independent thinktank        experiences of London and gentrification with me throughout
 on race equality and race            the research process. I would like to thank my family, whose
                                      stories of life in the city have demonstrated to me its power
 relations. Through high-             in transforming the lives of working-class immigrants and the
 quality research and thought         true beauty of living in community with others. Finally, I would
 leadership, we:                      like to thank Elephant and Castle for providing me with a
                                      home in London for the past four years and for showcasing
                                      the essence of living in a truly global city.
   •   Identify barriers to race
       equality and good race
       relations;
   •   Provide evidence to
       support action for social
       change;
   •   Influence policy at all
       levels.                        ISBN: 978-1-909546-37-0

                                      Published by Runnymede in June 2021, this document is
                                      copyright © Runnymede 2021. Some rights reserved.

                                      Open access. Some rights reserved.
                                      The Runnymede Trust wants to encourage the circulation of
                                      its work as widely as possible while retaining the copyright.
                                      The trust has an open access policy which enables anyone
                                      to access its content online without charge. Anyone can
                                      download, save, perform or distribute this work in any
                                      format, including translation, without written permission.
                                      This is subject to the terms of the Creative Commons
                                      Licence Deed: Attribution-Non-Commercial-No Derivative
                                      Works 2.0 UK: England & Wales. Its main conditions are:

                                      •   You are free to copy, distribute, display and perform
                                          the work;
                                      •   You must give the original author credit;
                                      •   You may not use this work for commercial purposes;
                                      •   You may not alter, transform, or build upon this work.

                                      You are welcome to ask Runnymede for permission to use
                                      this work for purposes other than those covered by the
                                      licence. Runnymede is grateful to Creative Commons for its
                                      work and its approach to copyright. For more information
                                      please go to www.creativecommons.org

Runnymede
Unit 119
Pill Box
115 Coventry Road
London E2 6GG
T 020 7377 9222
E info@runnymedetrust.org

www.runnymedetrust.org
CONTENTS

Forewords                              2

Introduction                           4

Executive summary                      6

Background                             7

Methodology summary                    9

Analysis                               10
 Southwark                             10
 Waltham Forest                        12
 Brent                                 14
 Opportunity Areas                     16

Discussion                             21

Policy recommendations                 25

Conclusion                             26

References                             27

Appendix                               31
 Methodology (complete)                31
 Data considerations and limitations   33
 Opportunity Area LSOAs                36
 Maps                                  38
2   Runnymede and CLASS report

Forewords

Gentrification is a complex and often unpopular process, but it is experienced very differently through the prisms
of both class and race. For the middle class home-owner, gentrification may mean some exciting new shops and
bars, and a welcome increase in the value of their primary asset; their home. But even for them, it often means an
unwelcome change in their neighbourhood, as long-term private renters are driven out by rising rents and home-
owners take the opportunity to relocate, particularly as they approach retirement. It also, all too often, means that
their children cannot afford to live in the neighbourhood they were born in. Meanwhile, for those in social housing
the ‘opportunities’ of the new shops and bars can prove elusive to those on lower incomes, and of course, those
new shops and bars are almost always there at the expense of previous well-used, if not always particularly
profitable, community spaces.

As this report shows, in London, one indicator of gentrification is a rapid change in demographics, as the
gentrifiers tend to be whiter than the communities that are being gentrified. Racialised communities often
feel that when their neighbourhood is gentrifying, it apparently no longer has a place for them. The traditional
community spaces, shops, cafes and pubs, are replaced by new, expensive and at times utterly unaffordable
and incomprehensible alternatives (the example of the ‘Cereal Killer’ breakfast cafe in Brick Lane comes to mind,
although its value as an example does not mean it is responsible for the trend).

While few people have a problem with the concept of ‘regeneration’ itself, particularly on the remaining system
built social housing estates in the capital, the question arises: are we regenerating a postcode at the expense
of the communities who have lived there? Equally importantly, where do the existing residents go when an area
goes ‘up market’? This is not a rhetorical question. Many traditionally disadvantaged and racialised ethnic groups
establish close knit communities, where a self-help community infrastructure bridges the gaps left in formal state
‘safety net’ provisions: whether that be debt advice, domestic violence services, or informal help getting work or
housing through community networks. The impact and extent of gentrification-led, forced (economic) dispersal of
these communities needs to be measured and evaluated.

This report does not measure the affordability of housing, but the rate of gentrification, measured by a matrix
that is explained in detail in the methodology section. People have complained about gentrification for over
half a century, and it has been an increasing concern since at least the turn of the century. But it is the rate
of acceleration, the rapidity of today’s changes, that is perhaps most destabilising and for many people (and
communities) hardest to navigate.

While many Londoners, already ‘feel’ the impact of gentrification in their communities, Runnymede are proud to
seek to find a way to objectively measure gentrification, and to begin the process of asking ‘how can communities
be better protected when regeneration occurs?’. Measuring a problem is the first step towards addressing it.
Further research will look at more detailed policy recommendations on how we can use regeneration (a process
which does not necessarily have to be synonymous with gentrification) to address long-standing disadvantage
faced by minoritized ethnic communities and low income households, and of course those who are living at the
intersection of economic and social inequality, disadvantaged by both race and class.

While we clap for carers, thank the teachers of our children and acknowledge the bravery of transport workers,
all too often these are the key workers, often from minoritized communities, whose very presence in the city is
increasingly threatened by gentrification.

This report is the start, the evidence base, upon which a much wider discussion must and will be built about how
we can develop policy around regeneration and gentrification that will contribute towards London becoming the
genuinely inclusive city it has always aspired to be.

Dr Halima Begum
Director of the Runnymede Trust
Pushed to the Margins: Gentrification in London in the 2010s        3

“London is the modern Babylon,” wrote Benjamin Disraeli in 1847. The city has always been a magnet for
the entire world; attracting rich and poor, young and old, white and Black. Most people living in London are
immigrants, whether from within Britain itself or further afield. The city pulls people in with its kaleidoscopic energy
and its streets rumoured to be paved with gold. My own father was part of a wave of people arriving in London,
travelling here from Dublin with his family aged 13, and living in Hackney until he reached his twenties.

But London’s creativity and community spirit has always been accompanied by an uneasy truce between the
city’s wealthiest and poorest people; between those born into countries colonised by the British Empire, and
those who ran that same empire. Arguably, Britain’s organised working class was founded in 1889 by London’s
dockers, who went on strike at the dock built by the East India Company to facilitate the corporation’s rule of
India. Both the upper and working classes lived mere feet away from one another in one dense urban metropolis.
But the different worlds in which they moved created tangible tensions, battles over space, and struggles for
power.

For a while, the truce between London’s classes was maintained by social housing programmes, which carved
out space for the city’s working people to claim as their own. After the Second World War, 4.4 million social
houses were built in the UK, the majority in London. The question of gentrification is often a question of who
owns London, and during the 1960s and 70s, there was a legitimate claim that the people themselves had a
piece of the city that was theirs. But after the Right to Buy policy was introduced in 1980, which gave people
an opportunity to buy their council homes, the number of social houses began to dwindle, causing a 69% drop
between 1979 and 2017. In response to this, as well as soaring house prices, the private rental sector exploded -
which was insecure and more expensive.

This report reveals that over the last three decades, working class, Black and ethnic minority Londoners have
increasingly found themselves at the mercy of the city’s urban design, its politics, and the movement of capital.
For these Londoners, gentrification does not mean artisanal coffee shops and new wine bars; it means being
pushed out of areas they have lived all their lives, losing local spaces, and the fracturing of communities. The
report shows how even seemingly arbitrary geographical features like transit terminuses, bodies of water and
warehouse spaces can dramatically change the composition of a community; determining who can afford to
live there, and who feels that the community is built for them. Gentrification is beginning to impact all but the
very wealthiest of Londoners, but it is through examining the experiences of those at the sharpest end can we
understand how it really works as a social and economic force.

The true strength of this report is that it does not deal with gentrification as an abstraction, but pinpoints exactly
where and how it is happening across three London boroughs. It is thanks to this precision that policymakers,
journalists and campaigners will be able to use the report to come together and create a London that works for
everyone - and belongs to everyone.

Ellie Mae O’Hagan
Director of CLASS
4      Runnymede and CLASS report

Introduction

     In such circumstances, any district in or near London,         These observations are the most noteworthy of her
     however dingy or unfashionable before, is likely to            1964 work, but Glass noticed other phenomena as
     become expensive; and London may quite soon be                 well: the shifting dynamics of class and labour, where
     a city which illustrates the principle of the survival of      the rigidity between professionals of different social
     the fittest – the financial fittest, who can still afford to   statuses had blurred; the increasingly fragmented
     work and live there.                                           nature of communities and groups that shared
     (Ruth Glass, ‘Aspects of change’, 1964)
                                                                    physical spaces with one another but not much
                                                                    else; and the marked entry of migrants (from the rest
Any piece of research which sets out to provide
                                                                    of the country and abroad) into London and their
a historical context for the phenomenon of
                                                                    experiences of housing discrimination, overcrowding
gentrification will inevitably reference sociologist
                                                                    and inequality occurring along the lines of race
Ruth Glass’s ground-breaking 1964 essay ‘Aspects
                                                                    (‘especially if their skin is coloured’, according to
of change’, where she first introduced the term into
                                                                    Glass, using language indicative of the time; 1964:
the public discourse. After living in London for more
                                                                    xxi). These elements will be identifiable to many
than 30 years, Glass began to note transformations
                                                                    who have spent a considerable amount of time in
that were taking place throughout the city, reflecting
                                                                    London in the 2010s, though they have taken on
both the ambitious societal changes shaping the
                                                                    unparalleled forms in recent times. According to
urban centres of post-war Britain and the nation’s
                                                                    the Runnymede Trust’s 2020 report The Colour of
emergent transition to a post-industrial economy.
                                                                    Money, all Black and minority ethnic (BME) groups
Glass observed a certain ‘gleam of affluence’ (1964:
                                                                    in Britain ‘are more likely to be in the lowest paid
xiv) that began to generate in neighbourhoods
                                                                    work, to be living in poverty [and to be paying] higher
throughout London which she sought to interrogate
further.                                                            housing costs in England’s large cities, especially
                                                                    London’ (Khan, 2020). Ethnic minorities comprise
                                                                    40% of the demographic makeup of London where
Glass noticed the introduction of the gentry, of both
                                                                    they experience particular inequalities in housing and
the upper and lower middle classes, into traditionally
                                                                    disproportionately live in the most deprived areas of
working-class neighbourhoods and their role in
                                                                    the city (Gulliver, 2016; Khan 2020).
reconstructing areas in their own image (spurring
the process of gentry-fication). They bought up
large, dilapidated Victorian homes that had been                    London in the 2010s was a decade marked by
subdivided into flats in preceding decades and                      flashes of stark opulence foregrounding a period
renovated them once again into stately, single-                     of great uncertainty. The national excitement of the
family houses. The shops and restaurants which                      2012 Olympic Games followed in the wake of the
populated the high streets of central and suburban                  murder of Mark Duggan and the resulting civil unrest
London (now known as Inner and Outer London                         during the 2011 ‘English riots’, as well as the tail-
boroughs) had also begun a process of change,                       end of the worst financial crisis in nearly a century.
where luxuries of the past were being sold as                       The induction of the Shard as the tallest building in
necessities of the present and ‘shabby Italian                      Britain, in a show of architectural marvel and acclaim,
restaurants [were replaced] by Espresso bars’                       occurred just one mile away from the demolition of
(Glass, 1964: xxv). These neighbourhood-level                       the Heygate Estate, home to more than 3,000 people
changes applied undue pressures on working-class                    and once an exemplar of the brutalist design of the
families, forcing them either to remain in the area in              post-war period (Sebregondi, 2012). Nearly 300,000
increasingly overcrowded conditions among their                     new homes were built in London in the 2010s, while
established kinship networks, or to move further                    rough sleeping tripled in the capital during the same
outwards into unfamiliar territory on the peripheries               period (Homeless Link, no date; MHCLG, 2021c).
of the city, where they were more isolated from
their communities and extended families. Most                       Gentrification was defined by these deep
pertinently, Glass saw the invasive nature of these                 contradictions of life in London, observed globally,
transformations and that once they had taken hold                   and it has reverberated back to the city where it
of one neighbourhood, the process would spread                      was first conceived. Nearly 60 years on from when
rapidly through others nearby.                                      Ruth Glass first noted these urban processes in
Pushed to the Margins: Gentrification in London in the 2010s   5

Islington, Paddington, Battersea and ‘even the              diminishment of truly affordable housing options,
“shady” parts of Notting Hill’ (Glass, 1964: xix), some     the dispersal of communities from their previously
areas have entered a phase of ‘super-gentrification’        established domains, and the increase in the number
which bears little resemblance to the small-scale           of vacant shops on our high streets constitute losses
changes that were first witnessed in the 1960s              of the past decade in what distinguishes London
(Shaheen, 2013). The process of gentrification,             as a distinct and unrivalled city on the global stage
most notably in the past two decades, has since             (GLA, no date, a; Butler, 2021). In the present
spread to parts of London in which it would have            day, the coronavirus epidemic has triggered an
likely been inconceivable to an observer in the past.       unprecedented suspension of the full functionality of
East London, which Glass identified as unaltered            the city and has prompted many of us to earnestly
by gentrification in her observations, has since seen       contemplate the nature of urban life, as our home
the destruction of slum dwellings and clearance of          lives and surrounding locales have come into hyper-
poorer residents to Barking, Dagenham and Ilford,           focus. The very purpose of cities, as well as the
the rise and fall of council housing, and the creation      amenities of the past, are being called into question
of ‘the world’s most expensive tech district’ (Co,          as spheres of work and study become uncoupled
2017; Royal Institute of British Architects, 2021).         from ‘place’ and facets of our lives increasingly
                                                            migrate online. While we embark upon the crucial
Through examining the past, London has an                   work of rebuilding our cities once the pandemic
opportunity to understand what we are at risk of            subsides and with the stated goal of ‘building back
losing if gentrification continues unabated and to          better’, we must begin to ask ourselves at the
consider what we want from future iterations of the         present opportune moment: what do we truly want
city. The growing precarity of housing tenure and           from our cities and whom do we want them to serve?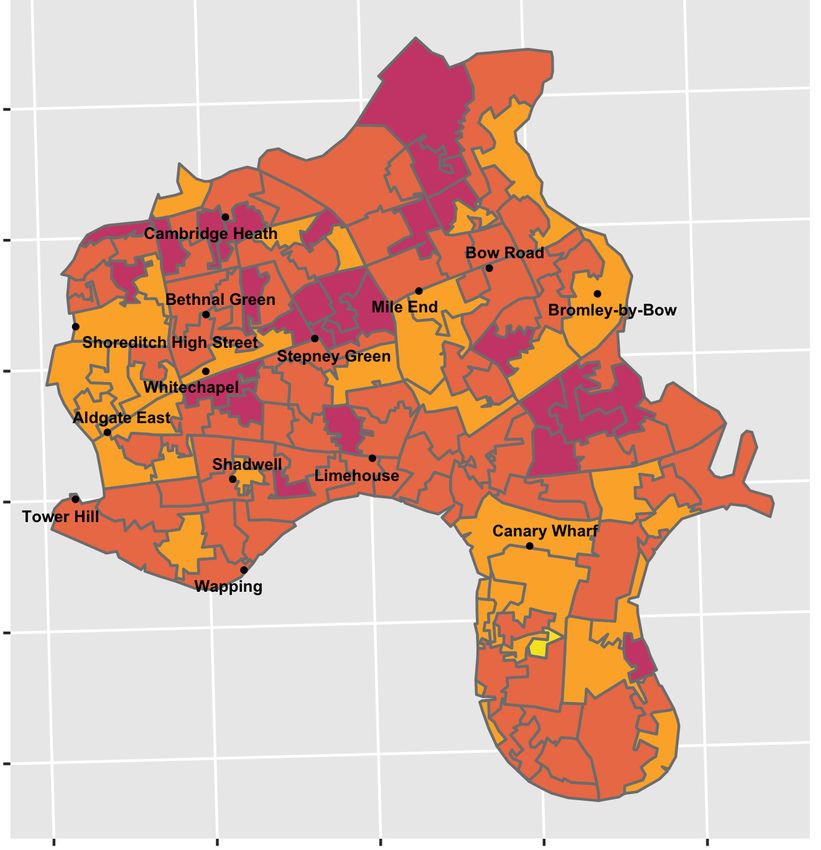
6   Runnymede and CLASS report

Executive summary

Gentrification was a notable phenomenon in London       Gallery, Blackhorse Road, Lea Bridge, an area near
in the 2010s and had a significant impact on the        the Wanstead Flats, and clusters of areas near
displacement of working-class and Black and ethnic      Leyton, Leyton High Road and Leytonstone stations.
minority (BME) residents in the capital. The boroughs   Gentrification was concentrated in the southern half
which gentrified most across London between 2010        of the borough, corresponding to the districts of
and 2016 were Tower Hamlets, Wandsworth and             Walthamstow and Leyton.
Newham and the boroughs which gentrified least
were Havering, Bexley and Bromley, all in descending    Brent gentrified the least of the three case study
order. The three case study boroughs selected           boroughs and severely gentrified in Kilburn, Willesden
for the quantitative analysis (Southwark, Waltham
                                                        Green, Harlesden, Park Royal and Wembley Park.
Forest and Brent) demonstrate varied patterns of
                                                        Gentrification was clustered in the south-eastern
gentrification.
                                                        quadrant of the borough, as well as in swathes of
                                                        Wembley.
Southwark gentrified most of the three case study
boroughs and severely gentrified in the London
                                                        Neighbourhoods located within ‘Opportunity Areas’
Bridge-West Bermondsey area, the Southwark-
Borough area, Elephant and Castle, Camberwell,          were significantly more likely to gentrify and had
East Dulwich, Peckham Rye and Queens Road               higher rates of displacement (as measured using the
Peckham, and pockets of Bermondsey, Old Kent            proxy indicator of population churn) in Southwark,
Road and Rotherhithe. Gentrification was widespread     Waltham Forest and Brent between 2010 and 2016.
throughout the borough except in areas with
exceptionally high or low levels of deprivation.        Southwark principally represents estate-demolition
                                                        gentrification and transit-induced gentrification.
Waltham Forest gentrified the second most of the        Waltham Forest principally represents spillover
three case study boroughs and severely gentrified       gentrification and transit-induced gentrification. Brent
in Walthamstow Central, Walthamstow Village,            principally represents spillover gentrification and new-
areas surrounding Lloyd Park and the William Morris     build gentrification.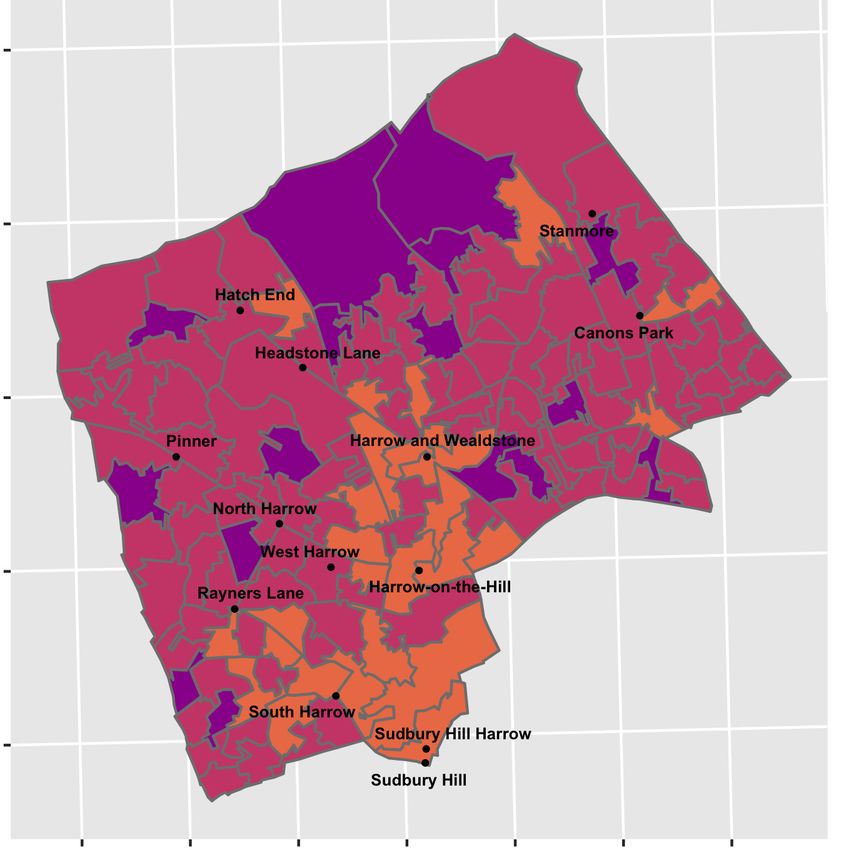
Pushed to the Margins: Gentrification in London in the 2010s     7

Background

The topic of gentrification has grown to prominence         through the voices of the multi-ethnic working class
in the mainstream of British society in recent years        themselves’ (Snoussi and Mompelat, 2019). With
and the term has emerged as commonplace after its           the intention of breaking past the common tendency
long-established home within the field of academia.         of pitting the ‘white working class’ against migrants
Gentrification, which is broadly defined as a process       and ethnic minorities, the ‘4P’ framework was
in which poor neighbourhoods are transformed by             developed to find commonality across the entirety
the entrance of middle-class occupants who trigger          of the working class through the themes of power,
a ‘socioeconomic uplift’ in the surrounding area, has       precariousness, place and prejudice. Gentrification
also seen a noticeable shift in its affective meaning       arose as an area where working-class Londoners
within its relatively short fixture in the mainstream.      held a shared resentment over the loss of community
When first introduced into the public discourse in the      space and identified a sense of helplessness and
2000s, gentrification was portrayed as a common             uncertainty over the urban processes that disrupted
good to improve the lives of the ‘forgotten people’         their families, networks and livelihoods.
in some of London’s inner neighbourhoods who
had seemingly been ‘left behind’ as the middle              The following quantitative analysis seeks to
classes fled to the suburbs and commuter towns in           interrogate the dynamics of race and class in London
preceding decades.                                          through the lens of gentrification and to map its
                                                            particularities as it shaped the city in the 2010s.
But as gentrification has developed over time               The report builds on the illuminating work led at the
and has become more pervasive in the city, its              grassroots level by community-run organisations and
embodiment as a transformational force in working-          in the halls of academia to provide empirical data
class neighbourhoods has become further realised            to inform the debate and to concretely assert what
and the term increasingly carries the burden of a           many Londoners feel and witness on a daily basis:
‘dirty word’ (White, 2015). Its application in new and      the city is becoming an increasingly unstable site of
burgeoning fields outside the realms of housing and         working-class life. Understanding how and where
cities is evidence of its resonance and stature in the      the defining elements of gentrification (displacement,
public consciousness: detailed works reflecting on          erasure, neighbourhood uplift) are driven in London
the gentrification of food, the gentrification of dog       and how they occur on the basis of race and
parks, the gentrification of football and even, in the      class might help us to improve the lives of those
seminal work of Sarah Schulman, the ‘gentrification         most marginalised in British society and to better
of the mind’ (Schulman, 2013; Bliss, 2017; Gander,          understand their lived experience in the capital.
2017; Mould, 2021). In our quantitative analysis
of gentrification, our aim is to gain insight into the      Within the mainstream, musings on gentrification
question of what exactly gentrification is, and how         towards the end of the 2010s held hipsters and
it has been experienced by the multiracial working          their emblematic coffee shops to be at the helm
class living in London in the 2010s.                        of these urban processes (Prynn, 2019). While our
                                                            neighbourhoods have assumed new and previously
The motivation for the current project emerged from         unthinkable forms (fancy cocktails served atop an
the findings of a previous report, ‘We Are Ghosts’:         abandoned car park in Peckham, weekly yoga
Race, Class and Institutional Prejudice, which was          brunches on Hackney Road in Shoreditch, an
undertaken collaboratively by the Runnymede                 exclusive members-only social club springing up in
Trust and the Centre for Labour and Social Studies          White City), the process of gentrification is galvanised
(CLASS) in 2019. This qualitative study, completed by       by forces that have become institutionalised
Dhelia Snoussi and Laurie Mompelat, examined the            throughout the city rather than by the behaviour
composition of Britain’s urban working class and their      patterns of individuals or groups. The implications
perspectives on life in the capital in the 2010s. The       imbedded within these shifts of consumption
work sought to analyse raw data, collected through          and aesthetic at the neighbourhood level tend to
focus group discussions from the community centres          work bidirectionally, where they act as a symptom
of North Kensington to the pubs of Rotherhithe, to          of the demographic changes taking place in the
effectively ‘inform the debate [on class in Britain]        surrounding area as well as signalling back to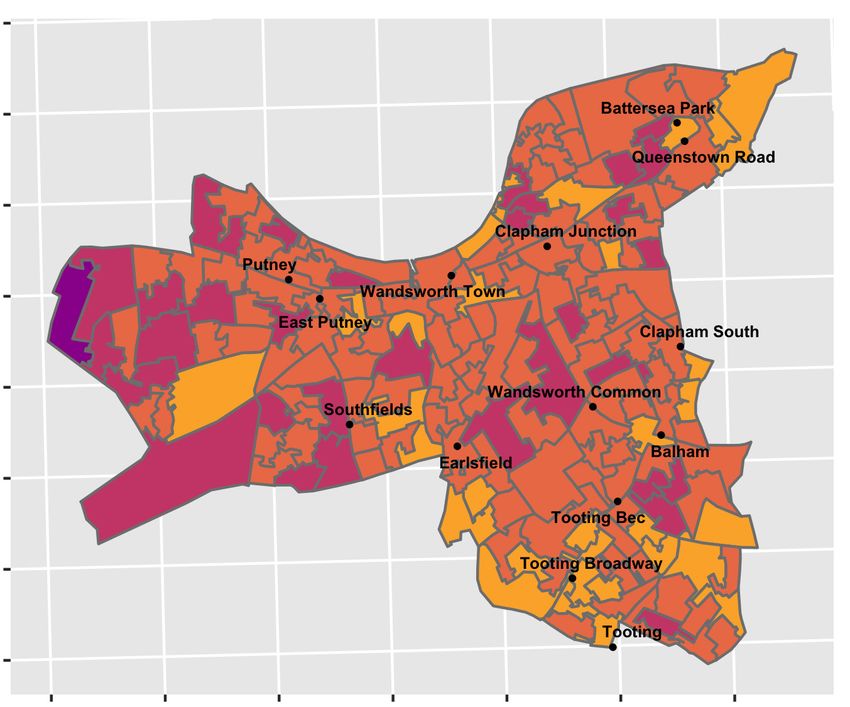
8     Runnymede and CLASS report

council- and city-level actors that a neighbourhood is          the livelihoods of working-class and BME people
a developing site of interest for the middle classes.           continued to be tenuous wherever they might be
                                                                located in the city (GLA, no date, b).
In thinking beyond the oft-referenced examples
that indicate a street or neighbourhood may be                  Three boroughs, Southwark, Waltham Forest and
‘in transition’, the goal of the present analysis is to         Brent, were qualitatively selected to represent
resituate gentrification at the macroscopic level of            different parts of London (Inner and Outer boroughs;
the city and understand its systemic and coordinated
                                                                different sub-regions of the city – south-east, north-
components. The project maintains that gentrification
                                                                east and north-west; varied patterns of gentrification)
exists on a continuum rather than in a binary of
                                                                and all contain significant working-class BME
‘gentrified’ or ‘ungentrified’. As Shaw (2008) has
posited,                                                        communities. These boroughs were chosen to
                                                                provide examples beyond the areas most frequently
     It is more useful to locate gentrifying neighbourhoods     identified by the general public as ‘gentrifying’
     and cities on a continuum of social and economic           or ‘gentrified’ in the first half of the 2010s (i.e.
     geographic change. The continuum need not                  Shoreditch, Brixton, Kings Cross). In addition, the
     imply that all neighbourhoods will move through all        influence of Opportunity Areas (OAs) on gentrification
     ‘stages’, nor that they will reach the same end state,     at the borough-wide level is explored in this report.
     nor, indeed, that they can only travel in one direction.   OAs were first introduced by the Mayor of London’s
                                                                2004 London Plan and denote swathes of the city
The process of gentrification, which creates a
tenuous environment for working-class life to flourish          that constitute major brownfield sites and deprived
in urban settings, occurs with varying intensity in             areas that are now the booming sites of mega-
different spaces and at different points in time. As            housing developments. The relationship between
wealth inequality grew between the richest and the              OAs and gentrification has been raised by grassroots
poorest in London and racial inequality remained                organisations engaged in campaigns for better
an insidious problem in British society in the 2010s,           housing and living conditions in London.
Pushed to the Margins: Gentrification in London in the 2010s 9
Methodology summary
The equation that forms the basis of our analysis • a b-value of 0.25 is added to standardise the
and was generated to calculate the gentrification gentrification score between 0.0 and 1.0
score of a Lower-Layer Super Output Area (LSOA)
A more detailed description of the methodology
is as follows:
and data used can be found in the Appendix of
1 1 1 1 this report.
G = – c - – e + – h - – d + 0.25
2 4 8 8
According to 2011 boundaries, there are 4,835
where: LSOAs across London, with 1,737 LSOAs located in
• G represents the index of gentrification, Inner London boroughs and 3,098 LSOAs in Outer
constituting a scale from 0.0 to 1.0 where the London boroughs.
lower bound signifies an area of minor gentrification
and the upper bound signifies an area of severe The mean gentrification score for LSOAs across
gentrification between 2010 and 2016 London is 0.485 (0.517 for Inner London LSOAs,
0.467 for Outer London LSOAs1). The median
• c represents the population churn at the gentrification score for London is 0.486 (Inner: 0.516,
household level within an area between the start Outer: 0.466). The range of gentrification scores
of 2010 and the end of 2016, or ‘a ratio of the across London is 0.165 to 0.775 (Inner: 0.312 to
households that have changed in each LSOA … 0.775, Outer: 0.165 to 0.737). Corresponding to
between [2010 and] 2016’ (CDRC, 2016). an alpha level of 0.05 in the Shapiro-Wilk normality
test, gentrification scores are not normally distributed
• e represents the relative change in the across London, Inner London or Outer London.
proportion of non-white residents at the
individual level within an area The gentrification scores were categorised within the
ranges shown in Table 1.
• h represents the relative change in median
house sale price compared with the borough- Table 1: Gentrification scores
wide average between December 2009 and
Level Gentrification score Number of LSOAs
December 2016 (i.e. the median house sale
price for a given LSOA was 90 per cent of the Severe 0.6–0.8 219
borough-wide average in 2009 and increased High 0.5–0.6 1,815
to 110 per cent of the borough-wide average Moderate 0.4–0.5 2,257
in 2016, producing a score of 0.22 using the Low 0.3–0.4 499
formula of relative change) Minor 0.1–0.3 45
• d represents the relative change in the index
of multiple deprivation (IMD) score between
2010 and 2015
1
Note: The mean gentrification scores of Inner and Outer London boroughs are significantly different (p-value ~ 0).10 Runnymede and CLASS report
Analysis
Table 2: Mean gentrification by London borough
(Inner and Outer)
Southwark
Between 2010 and 2016, Southwark experienced the
Inner London fifth-highest levels of gentrification across Inner London
Borough Mean gentrification
boroughs and the sixth-highest levels of gentrification
across all boroughs. Located in south-east London
Tower Hamlets 0.560 and bordered by the River Thames at its northern end,
Wandsworth 0.549 Southwark is defined by the presence of impressive
Hackney 0.530† post-war architecture and the sheer volume of homes
Lambeth 0.528 provided by the local authority. The borough was
Southwark 0.526 heavily shelled during air raids in the Second World
Hammersmith and Fulham 0.525 War due to its large industrial capacity, as well as
its extensive docklands and transport hubs which
Islington 0.525†
fuelled the wartime effort (principally located in London
Royal Borough of Greenwich 0.511†
Bridge, Bermondsey, Rotherhithe, and Elephant and
Lewisham 0.503 Castle) (Dark, 2020). The area was redeveloped by
Camden 0.494 the London County Council and affected metropolitan
City of London 0.469 boroughs in the 1950s and 1960s, when high-density
City of Westminster 0.467† brutalist estates were built to replace medium-density
Royal Borough of Kensington 0.466 terraced homes and abandoned brownfield sites.
and Chelsea These estates housed thousands of residents in
clustered high-rise structures, with the term ‘Cities
Outer London
in the Sky’ coined to represent the city’s vertical
Borough name Mean gentrification expansion. Due to the sizeable council housing stock
Newham 0.538† in Southwark, London represents a rare example
Ealing 0.515
of a Western metropolis where a significant portion
of working-class people continue to reside in the
Haringey 0.512
geographic centre of city (as opposed to inner-city
Waltham Forest 0.507
neighbourhoods in large US cities with little housing
Brent 0.500† provision still accessible to working-class residents)
Merton 0.481 (Bogin, Doerner and Larson, 2016).
Hounslow 0.479†
Barnet 0.477 The borough is home to a variety of BME communities
Royal Borough of Kingston upon 0.477 that have grown significantly since the beginning of
Thames the 21st century. There are 250 African churches
Richmond upon Thames 0.459 in Southwark alone, representing the highest
Enfield 0.458 concentration of such congregations outside of
Redbridge 0.455 the African continent (Alemoru, 2019). The African
Harrow 0.454 diaspora in South London originates mostly from
West Africa, predominantly Nigeria, Ghana or Sierra
Barking and Dagenham 0.453†
Leone (Williams, 2015). Southwark also contains a
Hillingdon 0.453
prominent Latin American community which began
Croydon 0.450 settling in Elephant and Castle in the 1990s, leading to
Sutton 0.447 the development of a community hub in the recently
Bromley 0.427 demolished Elephant and Castle Shopping Centre
Bexley 0.415 and the surrounding area (Román-Velázquez, 2016).
Havering 0.365 Latin Americans in Southwark are predominantly of
Note: † Boroughs where gentrification is not normally distributed, Colombian, Ecuadorian or Bolivian ethnic origins and
corresponding to a p-value of less than an alpha level of 0.05 according typically moved onwards to Britain after first settling
to the Shapiro-Wilk normality test. In other words, these boroughs contain
LSOAs which act as outliers that skew the mean gentrification score in Spain (McIlwaine, Cock and Linneker, 2011).
upwards or downwards. Additionally, a significant number of VietnamesePushed to the Margins: Gentrification in London in the 2010s 11
refugees (mostly of Chinese ancestral origin) were 2018b). By 2016, Southwark had fallen to second
housed in Southwark during the 1960s and 1970s, place, with Hackney surpassing it as the top provider
though they are more dispersed throughout the of rented accommodation outside of the private
borough (i.e. in Elephant and Castle, Camberwell, rental sector (43.7 per cent in Hackney versus 40.9
Peckham, Rotherhithe and Surrey Quays) than per cent in Southwark) (ONS, 2018b). The local
other ethnic minority working-class communities in authority housing stock decreased from 55,803 units
Southwark (Pharoah, Hale and Lee, 2010). in 1994 to 38,183 in 2020, representing a 31.6 per
cent decrease in council homes in a 26-year period
At the start of the decade, Southwark was the (MHCLG, 2021b). In 1994, there were more council
London borough with the highest proportion housing units in Southwark than in the entirety of
(45.5 per cent) of people living in housing provided Liverpool despite the London borough containing half
by the local authority or a housing association (ONS, the population (MHCLG, 2021b).
Figure 1: Gentrification in the Borough of Southwark, 2010–16
Gentrification Index
0.7
0.6
0.5
0.4
0.3
51.5 º N
51.48 º N
51.46 º N
51.44 º N
51.42 º N
0.12 º W 0.1 º W 0.08 º W 0.06 º W 0.04 º W12 Runnymede and CLASS report
Between 2010 and 2016, the mean gentrification The LSOA with the highest population churn was
score in Southwark was 0.526, above the average Southwark 014F, representing the area south of
London-wide score of 0.485. Gentrification Elephant and Castle station and along Walworth Road
occurred relatively evenly throughout the borough (across from the now demolished Heygate Estate),
and the average score across Southwark was not where 72 per cent of households changed residency
drastically changed by a few areas of intense or mild between 2010 and 2016. Southwark 009A (due south
gentrification. However, spatial patterns and clusters of Borough station, along Great Dover Street and
of heightened and lowered gentrification exist including Trinity Church Square and Merrick Square)
in Southwark. The southern end of the borough had the largest relative decrease in the proportion of
(encompassing the neighbourhood of Dulwich) BME residents of any LSOA in London, with a net loss
represents ‘moderate gentrification’, as do swathes of 45 per cent of all people of colour from the area
of central and south Bermondsey, north Peckham, between 2010 and 2016 (contracting from 27.5 per
areas north of Camberwell and east of Kennington, cent of the ethnic make-up of the neighbourhood to
15.0 per cent, respectively).
and the area between Walworth Road and Old Kent
Road. The difference between Dulwich and other
areas of moderate gentrification is that the former Waltham Forest
includes LSOAs with the least deprivation in London Between 2010 and 2016, Waltham Forest
while the latter represent some of the highest experienced the fourth-highest levels of
deprivation levels in the city, according to the 2010 gentrification among Outer London boroughs,
English IMD (MHCLG, 2011). The aforementioned and the 12th-highest gentrification levels across
areas (excluding Dulwich) typically have a high all London boroughs. Waltham Forest, which
density of council housing estates and are largely historically constituted the south-western corner
inaccessible by foot from transit terminuses, such of Essex, lies in north-east London and comprises
as Tube, Overground or railway stations. Though the districts of Chingford, Walthamstow and
the material realities in these areas are markedly Leyton. The character of Waltham Forest was
different (Dulwich as a wealthy area, the others defined by small villages and hamlets among
as poor areas), they did not drastically change, or farmland, marshes and forest until major residential
gentrify, in the 2010s and therefore are coloured the development occurred in the late 19th century as
same in Figure 1. a result of extending train networks (Powell, 1973).
Due to the particularly poor conditions in the East
As is clearly visible in Figure 1, the LSOA which End, an emphasis was placed by the London
County Council on building homes for working-class
gentrified most in the borough was Southwark
families in growing towns on the periphery of the
003E, covering the area along the river from London
city, resulting in a movement of ‘East Enders’ into
Bridge to Tower Bridge (north of London Bridge
the area (Young and Willmott, 2011). The Borough
station) as well as along Tooley Street and Jamaica
of Waltham Forest has been home to a number
Road into the west end of Bermondsey. Between
of ambitious social housing projects, such as the
2010 and 2016, 60 per cent of residents left the
creation of the renowned red-brick homes of the
neighbourhood, there was a relative decrease of
Warner Estate. Thomas Warner, the owner and
2.4 per cent in the proportion of BME residents developer, sought to create high-quality houses,
and deprivation levels relatively decreased by 25 fitted with recessed porches and painted neatly and
per cent. The average price of a house sold in uniformly, for working-class people (Harrison and
the area was £1.2 million at the end of 2016, up Green, 2016).
from £305,000 at the start of 2010. Following the
London Bridge-West Bermondsey area, other The emergence of migrant communities in
areas of severe gentrification (measured as scoring Waltham Forest has taken place since the post-
over 0.60 on the gentrification index) include: the war period, with significant settlement by people
Southwark-Borough area (from Blackfriars Bridge of Pakistani and Jamaican ethnic origin, as well
to the top of Elephant and Castle); Elephant and as other members of the ‘Windrush generation’,
Castle (southwards down Walworth Road and or those from Commonwealth nations (Open
Kennington Park Road); Camberwell (surrounding Society Foundations, 2012; Waltham Forest Echo,
the north and east of Denmark Hill station); part 2020). In the 2010s, Caribbean communities
of East Dulwich; parts of Peckham (around the were clustered in central and upper Walthamstow,
redeveloped Peckham Library and Queens Road Lea Bridge/Hatch Lane and central Leyton,
Peckham station); and pockets of Bermondsey, Old while Pakistani communities were more widely
Kent Road and Rotherhithe. distributed throughout Walthamstow, Leyton andPushed to the Margins: Gentrification in London in the 2010s 13
south Chingford (according to the e dataset; see Turkish residents, from Turkey and Cyprus, have
Appendix). Additionally, there has been significant also settled across North London since the 1990s,
settlement of eastern European residents in the with growing populations in Walthamstow and
borough since 2004, corresponding with the Chingford (Kartal, 2019). Waltham Forest is home
accession to the European Union of 10 new to the fourth-largest Muslim population in London,
member states located mostly in eastern Europe. accounting for 22 per cent of all residents (ONS,
As a result, large Polish, Romanian and Lithuanian 2019b).
communities have developed in Leyton and
Walthamstow and retain a visible presence in the At the start of the decade, 24 per cent of residents
shops of the high streets (Hanley, 2013). Many in Waltham Forest were living in housing provided
Figure 2: Gentrification in the Borough of Waltham Forest, 2010–16
Gentrification Index
0.7
0.6
0.5
51.64 º N 0.4
0.3
51.62 º N
51.6 º N
51.58 º N
51.56 º N
0.06 º W 0.04 º W 0.02 º W 0º 0.02 º E14 Runnymede and CLASS report
by the local authority or a housing association Valley line of the Overground to Pembroke Road.
(slightly lower than the borough-wide average This residential area is south-west of Walthamstow
across London of 24.5 per cent) (ONS, 2018b). Village, the oldest part of present-day Walthamstow,
By 2016, the proportion of the population living in and has garnered attention in recent years for its
local authority or housing association properties artisanal coffee shops, brunch spots and neon art
had decreased to 16.7 per cent, well below the (Frankel, 2016). Between 2010 and 2016, 60 per
borough-wide average across London of 22.9 per cent of residents left the neighbourhood, there
cent (ONS, 2018b). The local authority housing was a relative decrease of 12.8 per cent in the
stock decreased from 16,302 units in 1994 to 9,653 proportion of BME residents and deprivation levels
in 2020, representing a 40.8 per cent decrease in relatively decreased by 20 per cent. The average
the number of council homes in a 26-year period price of a house sold in the area was £445,000
(MHCLG, 2021b). By 2016, a majority of residents at the end of 2016, up from £165,000 at the start
in the borough were homeowners (either owning of 2010. Following this section of Walthamstow
their home outright or buying with a mortgage) Central, other areas of severe gentrification
(ONS, 2018b). This statistic sheds light on the (measured as scoring over 0.60 on the gentrification
quasi-suburban nature of Waltham Forest, where index) include Walthamstow Village; the areas
homeownership rates are typically higher than in north and east of Lloyd Park and the William Morris
inner-city neighbourhoods. Gallery; due east of Blackhorse Road station; east
of Leyton Marshes and Lea Bridge Station (along
Between 2010 and 2016, the mean gentrification Lea Bridge Road); the south-eastern tip of the
score of Waltham Forest was 0.507, above the borough, in Leytonstone near the Wanstead Flats;
average London-wide score of 0.485. Using the and clusters of areas near Leyton, Leyton High
gentrification index, the average score across Road and Leytonstone stations.
Waltham Forest was not drastically changed by few
areas of intense or mild gentrification. However, The LSOA with the highest population churn
spatial divisions of heightened and lowered was Waltham Forest 026D, constituting the area
gentrification exist in Waltham Forest. The North north-west of Leyton Tube station and east of
Circular Road separates the borough into two Leyton Mills shopping centre, where 65 per cent
distinct regions of gentrification: high gentrification of households changed residency between 2010
patterns across Walthamstow and Leyton, and low and 2016. Waltham Forest 011D (south of Lloyd
gentrification in Chingford (as seen in Figure 2). Park, from Pearl Road to Hoe Street and west of
There are at least two factors that may explain this Chingford Road) is the LSOA in the borough that
difference. The first is that transit terminuses are had the largest relative decrease in the proportion
concentrated in the southern half of the borough, of BME residents, with a net loss of 18 per cent of
with only two stations servicing Chingford, thereby people of colour from the area between 2010 and
limiting the effects of transit-induced gentrification 2016 (contracting from 38.0 per cent of the racial
(explored further in the ‘Discussion’ section). make-up of the neighbourhood to 31.0 per cent,
Interestingly, population churn was exceedingly high respectively).
near the Highams Park and Chingford Overground
stations in comparison with the remainder of Brent
Chingford, signalling that these two locations could Between 2010 and 2016, Brent experienced
be the next frontiers of gentrification in the borough. the fifth-highest levels of gentrification across
The second factor is that Chingford is home to Outer London boroughs and the 14th-highest
LSOAs in both the top and bottom quartiles of gentrification levels across all London boroughs.
deprivation in London. Very wealthy areas are not Brent was historically constituted as part of
likely to gentrify; nor are poor areas that are not Middlesex county and now occupies the north-
located near other amenities (e.g. widespread west of London. Much like in Waltham Forest and
availability of transit terminuses, proximity to nearby Southwark, development in Brent was spurred in
gentrified areas). the 19th century by the extension of train networks
and was heavily shelled during the London Blitz
According to the dataset, the LSOA which gentrified due to the numerous factories that populated the
most in the borough was Waltham Forest 016A, area (Brent Council, no date, a). The presence of
encompassing the area near Walthamstow Central these industries (primarily in the neighbourhoods
station, from Queens Rd/Orford Rd south along of Willesden and Harlesden) necessitated a strong
Hoe Street to Boundary Road and Granville Road, working-class identity in the southern end of the
and west to east from the train tracks of the Lea borough. During the early years of the post-warPushed to the Margins: Gentrification in London in the 2010s 15
period, the area was severely impacted by the train into nearby Paddington station (Young and
process of deindustrialisation as factories closed Willmott, 2011; Ryan et al., 2021). Harlesden, which
down and were relocated out of north-west London is due west of Kilburn, is home to the second-
and into other parts of the country where space largest concentration of Caribbeans in the UK,
to expand and cheaper commercial rents were following closely behind the neighbourhood of
available (Keeble, 1965). In contrast, the northern Chapeltown in Leeds (according to the e dataset;
end of the borough (encompassing Wembley, see Appendix). The influx of Caribbeans into London
Kingsbury and Harrow) retained a more conservative and other British towns and cities was part of the
and middle-class character, typical of the suburban migration pattern of the Windrush generation and
nature of the area (Brent Council, no date, a). reflects similar dynamics to those mentioned in the
previous section on Waltham Forest. In terms of
Brent is one of the most ethnically diverse boroughs more recent waves of migration, Brazilians started
in London, with the racial make-up nearly evenly to settle in the neighbourhoods of Willesden and
split: one-third Asian, one-third white, one-fifth Neasden in large numbers from the beginning of the
Black and one-tenth mixed/other (ONS, 2018a). 21st century and Britain is now home to the largest
Brent has the second-lowest proportion of white Brazilian diaspora in Europe (Finotelli et al., 2013).
residents of all London boroughs, at an estimated
36 per cent (ONS, 2018a). Beginning in the mid- At the start of the decade, 22 per cent of residents
20th century, Kilburn was established as the centre in Brent were living in housing provided by the
of the Irish diaspora in London as residents settled local authority or a housing association (slightly
in the area after travelling by boat to the Welsh cities below the average across London of 24.5 per
of Swansea, Cardiff and Newport and arriving by cent) (ONS, 2018b). The local authority housing
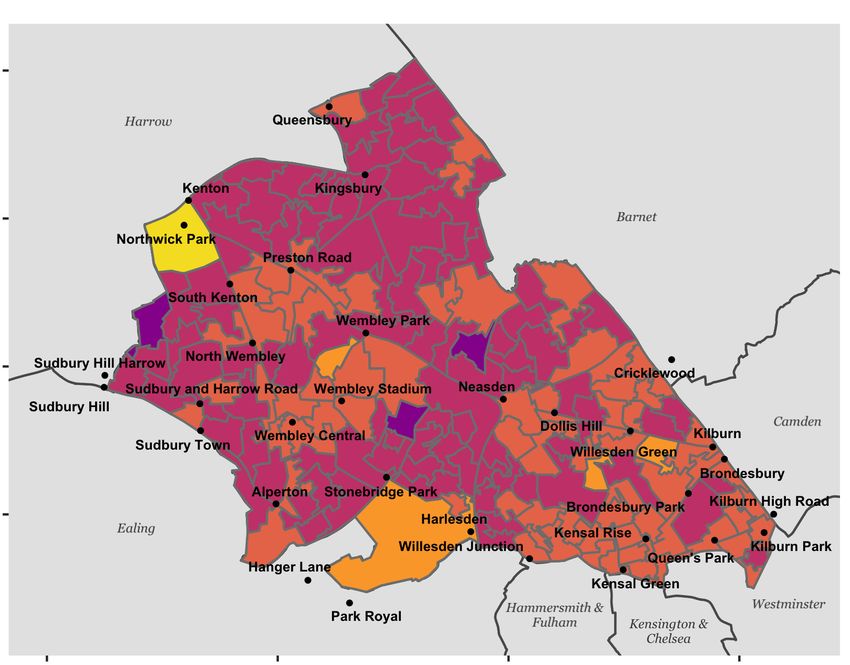
Figure 3: Gentrification in the Borough of Brent, 2010–16
Gentrification Index
51.6 º N
0.7
0.6
0.5
0.4
0.3
51.58 º N
51.56 º N
51.54 º N
0.35 º W 0.3 º W 0.25 º W 0.2 º W16 Runnymede and CLASS report
stock decreased from 16,843 units in 1994 to as well as the Park Royal Industrial Estate (between
8,231 units in 2020, representing a 51.1 per cent the four corners of Harlesden, Park Royal, Hanger
decrease in the number of council homes in a 26- Lane and Stonebridge Park stations, and including
year period (MHCLG, 2021b). By 2016, Brent had Central Middlesex Hospital) and a residential area
one of the highest proportions of residents living across from the Wembley Park development (west
in accommodation provided by the private rental of Empire Way until Wembley Park Drive).
sector (36 per cent) across London boroughs, falling
slightly behind Newham (39 per cent), Westminster The LSOA with the highest population churn was
(38 per cent) and Tower Hamlets (37 per cent) Brent 017F, covering the area surrounding Wembley
(ONS, 2018b). Stadium (between Wembley Park and Wembley
Stadium stations), where 76 per cent of households
Between 2010 and 2016, the mean gentrification changed residency between 2010 and 2016. The
score of 0.500 was skewed upwards in Brent by LSOA in the borough that had the largest relative
a few areas of intense gentrification. The mean decrease in the proportion of BME residents was
gentrification score decreased to 0.498 when the Brent 008D (Northwick Park), where the proportion
data were normalised by the removal of the two contracted from 52.5 per cent of the racial make-
highest outliers, Brent 008D and Brent 023B, up of the neighbourhood to 35.0 per cent between
corresponding to Northwick Park and the area 2010 and 2016, representing a net loss of 33 per
between Kilburn and Willesden Green Tube stations, cent. As previously noted, however, the reason
respectively. The average gentrification score across behind this substantial shift in the proportion of
Brent, at 0.498, was slightly above the London-wide BME residents is unclear and likely involved factors
average of 0.485. Northwick Park, which stands out unrelated to gentrification. The second-highest
as a representation of intense gentrification in Figure LSOA in terms of relative decrease in the proportion
3, had an exceptionally high population churn value of BME residents was Brent 032A, encompassing
of 74 per cent and saw a relative decrease in the the area east of Kensal Green station and north of
proportion of BME residents of 33 per cent. These Kensal Green Cemetery. The percentage of BME
inflated values are most likely a result of the large people in the area decreased from 20.5 per cent in
concentration of homes for healthcare workers at 2010 to 17.0 per cent in 2016, representing a 17
Northwick Park Hospital and accommodations for per cent net loss of non-white residents from the
students at the University of Westminster, Harrow neighbourhood.
Campus – two populations known to have high
turnover rates unrelated to gentrification pressures.2
Therefore, Northwick Park is likely not a true site of Opportunity Areas
gentrification in Brent and demonstrates a limitation Established in 2004 with the first iteration of the
of the capabilities of the gentrification index Mayor’s London Plan, 28 Opportunity Areas (OAs)
equation. were identified and plotted across the city as zones
‘capable of accommodating substantial new jobs
According to the dataset, the LSOA which gentrified or homes and their potential should be maximised’
most in the borough (excluding Brent 008D, (Mayor of London, 2004). A regeneration model was
Northwick Park) was Brent 023B, covering the area employed in OAs, covering major brownfield sites
between Willesden Green and Kilburn stations, and some of the most deprived quarters of London,
south of the train tracks of the Jubilee line towards with the goal of ensuring that ‘no-one [would] be
Brondesbury Park and between Lydford Road and seriously disadvantaged by where they live within
Coverdale Road. Between 2010 and 2016, 55 per 10–20 years’ (Mayor of London, 2004). OAs would
cent of residents left the neighbourhood, there was theoretically follow a public-private funding model,
a relative decrease of 7.1 per cent in the proportion where private investment would be sought to pay
of BME residents and deprivation levels relatively for the major infrastructural transformations required
decreased by 26 per cent. The average price of for developments of such a scale and some of the
a house sold in the area rose from £222,000 at substantial capital injection would be reallocated
the start of 2010 to £715,000 at the end of 2016. to provide high-quality social housing as a public
Following this section of Willesden, other areas of good (Wainwright, 2021). According to the original
severe gentrification (measured as scoring over 0.60 plans, a 50 per cent affordable housing quota was
on the gentrification index) include a nearby stretch mandated for developers seeking approval from
of Willesden Green (north of King Edward VII Park), the Mayor’s Office and they would be required to
2
Conversation with Northwick Park councillor Robert Johnson, 29 March 2021.Pushed to the Margins: Gentrification in London in the 2010s 17
undergo a ‘financial viability assessment’ if they Newham).3 The Upper Lea Valley and OLSPG
could not achieve the target. OAs overlap in Waltham Forest in the borough’s
south-western tip. In Brent, two OAs were in use
In practice, however, the 50 per cent threshold (Wembley, and Old Oak and Park Royal) and only
requirement has been regularly flouted, as covered 3 per cent of the borough. The Wembley
developments have been projected to not be OA is contained within the boundaries of Brent and
profitable enough to provide affordable housing the Old Oak and Park Royal OA is situated in the
and the quota has since been lowered to the boroughs of Brent, Ealing, and Hammersmith and
London-wide target of 35 per cent (a threshold Fulham.
which is also not strictly enforced, as Jerry Flynn of
the 35% Campaign has thoroughly documented; According to the quantitative analysis (Figures
35% Campaign, no date, b). The very definition of
4–6, Tables 3–5), gentrification rates were 9–13
‘affordable housing’ in London contains multiple
per cent higher in LSOAs located within OAs than
sub-definitions and comprises anyone from council
LSOAs outside of them, demonstrating statistical
tenants spending an average £120 per week to
significance between the mean scores. Furthermore,
those paying 80 per cent of market rents, a rate far
population churn was significantly higher across
exceeding feasible limits for working-class residents
(as explored further in the ‘Discussion’ section). all three boroughs within OAs and was 9–30 per
The provision of OAs allows for high-density mega- cent higher than non-OA regions. As population
developments to be built which would not gain churn is a proxy variable representing displacement
approval if they were located elsewhere in London (accurately yet imprecisely; see ‘Data considerations
and which have the potential to remarkably alter and limitations’ section in the Appendix), the
the character of a given neighbourhood. Though existence of OAs and their role in shaping housing
rejuvenation of brownfield sites and a greater in London has strong implications.
provision of homes are welcome interventions,
developments in OAs are often not reflective of the In Southwark and Waltham Forest, the relative
housing needs of the local community and typically change in house sale price (in relation to the
happen without consultation with local businesses borough-wide average) was significantly higher
and groups to inform development plans (Just within OAs than outside of them. Interestingly,
Space, no date). As grassroots housing consortium Brent had depressed house sale prices within OAs
Just Space has pointed out, nearby ‘shops, when compared with outside of OAs, though not
cafes and service providers that serve the local significantly. For the relative change in deprivation
community are priced out of the area by soaring levels, only Southwark had a significantly different
rents’ (Just Space, no date). mean score: deprivation levels decreased within
OAs by 4.9 per cent and increased outside of them
In 2010, the original 28 OAs were still in use and by 2.3 per cent. Waltham Forest and Brent each
10 others were to be added by 2016. There were experienced higher increases of deprivation levels
three OAs located in Southwark (Bankside, Borough
within OAs, though deprivation also increased
and London Bridge, Elephant and Castle, and
throughout the remainder of the borough and the
Canada Water), covering 16 per cent of LSOAs
results were not statistically significant. Of specific
across the borough. Old Kent Road has since been
note, each borough had a larger decrease in the
added in the most recent London Plan (2016). In
proportion of BME residents within OAs (−5.5 per
Waltham Forest, there were two OAs (Upper Lea
Valley and Olympic Legacy Supplementary Planning cent in Southwark OAs vs −5.0 per cent non-OAs;
Guidance/OLSPG), covering 31 per cent of LSOAs −6.4 per cent in Waltham Forest OAs vs +2.5
in the borough. The Upper Lea Valley OA is spread per cent non-OAs; −3.5 per cent in Brent OAs vs
across four London boroughs (Hackney, Waltham −2.7 per cent non-OAs), though these differences
Forest, Haringey and Enfield) and stretches from were not statistically significant in any of the case
Clapton, north through Tottenham to the borders study boroughs. One hypothesis explaining this
with Hertfordshire and Essex. The OLSPG OA phenomenon could be the influx of middle- and
was created in preparation for the 2012 London upper-class BME people into new developments,
Olympics and is also located across four boroughs which would represent a notable shift in terms of
(Hackney, Waltham Forest, Tower Hamlets and class rather than race.
3
The legacy of the 2012 Olympics Games in London and its impact on the gentrification of East London has been heavily reported in the
literature; see Watt (2013).You can also read