THE OVERHEATED ARC Part 2 - Sustainable alternatives - Smart Growth UK
←
→
Page content transcription
If your browser does not render page correctly, please read the page content below
THE OVERHEATED ARC
                              Part 2 -
                      Sustainable alternatives

A report by Smart Growth UK
September 2019                           http://www.smartgrowthuk.org

                                 1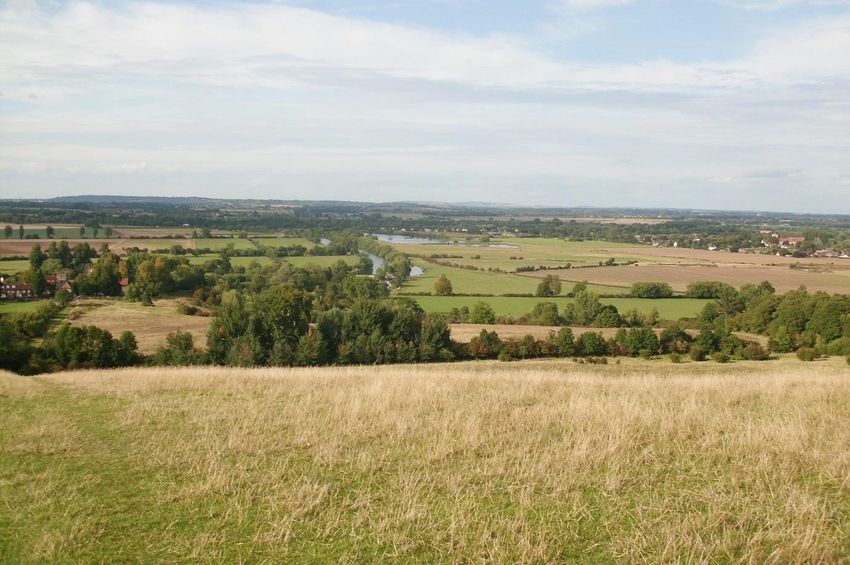
Contents
__________________________________________________________________________
Executive summary 4
1. Introduction 7
2. What qualities would a sustainable “arc” possess? 9
3. The Oxford-Cambridge Arc – A failure of strategic planning 10
4. Alternative arcs 19
5. Wolverhampton-Birmingham-Coventry 21
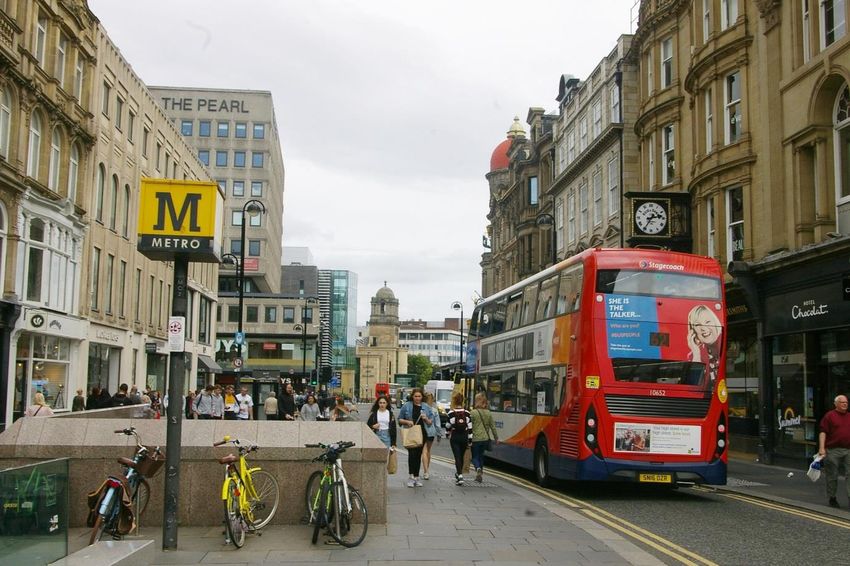
6. Newcastle-Sunderland-Teesside 27
7. Derby-Nottingham 34
8. Manchester-Salford-Bolton 39
9. Leeds-Bradford-Huddersfield 48
10. Arcs beyond England 53
11. Conclusions 54
2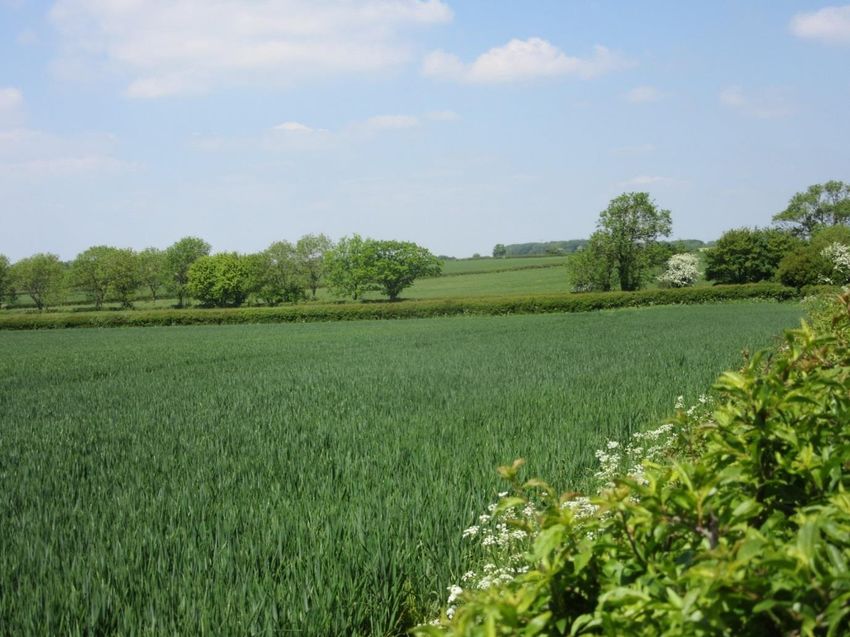
Smart Growth UK
__________________________________________________________________________
Smart Growth UK is an informal coalition of organisations and individuals who want to
promote the Smart Growth approach to planning, transportation and communities. Smart
Growth is an international movement dedicated to more sustainable approaches to these issues.
In the UK it is based around a set of principles agreed by the organisations that support the
Smart Growth UK coalition in 2013:-
Urban areas work best when they are compact, with densities appropriate to local
circumstances but generally significantly higher than low-density suburbia and avoiding
high-rise. In addition to higher density, layouts are needed that prioritize walking, cycling
and public transport so that they become the norm.
We need to reduce our dependence on private motor vehicles by improving public
transport, rail-based where possible, and concentrating development in urban areas.
We should protect the countryside, farmland, natural beauty, open space, soil and
biodiversity, avoiding urban sprawl and out-of-town development.
We should protect and promote local distinctiveness and character and our heritage,
respecting and making best use of historic buildings, street forms and settlement
patterns.
We should prioritize regeneration in urban areas and regions where it is needed,
emphasising brownfield-first and promoting town centres with a healthy mix of facilities.
Civic involvement and local economic activity improve the health of communities.
3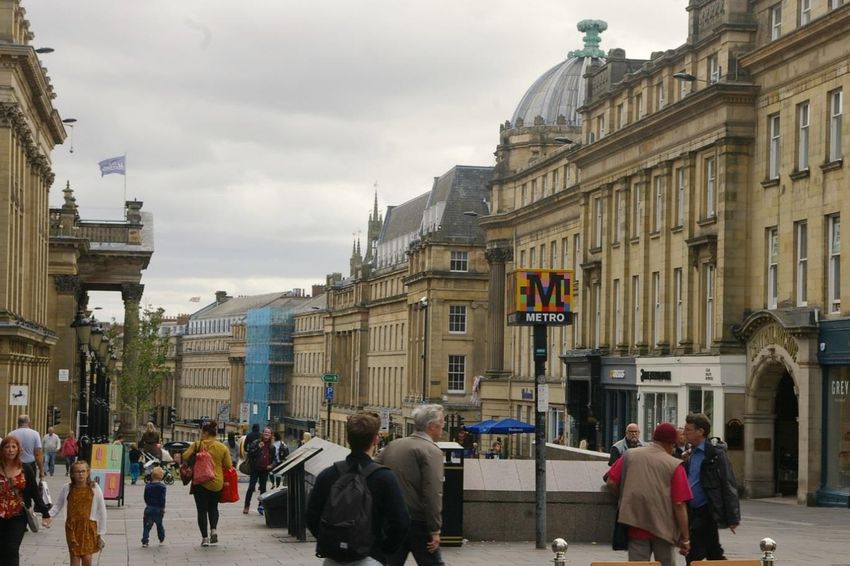
Executive Summary
__________________________________________________________________________
Chapter 1 We urgently need to rebalance our economy, yet regional divisions highlighted by
the UK2070 Commission are set to be exacerbated by the Oxford-Cambridge Arc project which
would increase Government support to a prosperous area of southern and eastern England.
Part 1 of this report looked at the Arc’s shaky foundations and the damage it would do; this
second part looks at possible sustainable alternatives. No-one promoting the Arc project appears
to have asked whether the arc concept is a good one and, if it is, what is the right place to apply
it. Least consulted of all were the communities involved. This report looks at the arc concept
through a Smart Growth lens and asks if there are areas of England where it might be
implemented beneficially, without all the damage.
Chapter 2 The original Arc proposal derived from the belief that the area has outstanding
universities and research institutions, knowledge-intensive businesses, a skilled workforce and
historic cities. We have identified four further important qualities areas would need if the arc
concept were to be applied sustainably:-
availability of brownfield development land,;
no acute housing shortage;
high-quality public transport;
a genuine need for economic regeneration.
Chapter 3 The Arc is a failure on all four of our new criteria. Nearly all the development
would be on farmland, including England’s most productive soils. It would fail to protect the
countryside, food production, natural beauty, open space, soil, biodiversity or natural capital in
general. It includes substantial parts of three AONBs and three green belts.
While parts of the Arc’s five counties are short of housing and infrastructure, especially around
Oxford and Cambridge, much of this overheating is thanks to dubious claims about the two
cities’ unique qualities. It represents a serious failure of strategic planning.
Most of the high-quality public transport in the Arc is radial mainlines from London. None of its
towns and cities have light rail and none is planned. The only substantial planned new local rail
link is the long mooted Oxford-Cambridge line revival, yet more than a dozen closed lines,
whose reopening might demonstrate some interest in sustainability, are ignored.
The big claim made for the Arc – that it has uniquely high productivity – is largely without
foundation. There are islands of significantly high productivity, but mostly it simply lies around,
or a little above, the national average. The same is true of its prosperity and household incomes
and it has little or none of the serious deprivation that would justify intervention.
Chapter 4 We have selected an initial list of five “arcs of sustainable development” in England
which demonstrate the four original Arc qualities and our four sustainability tests too.
4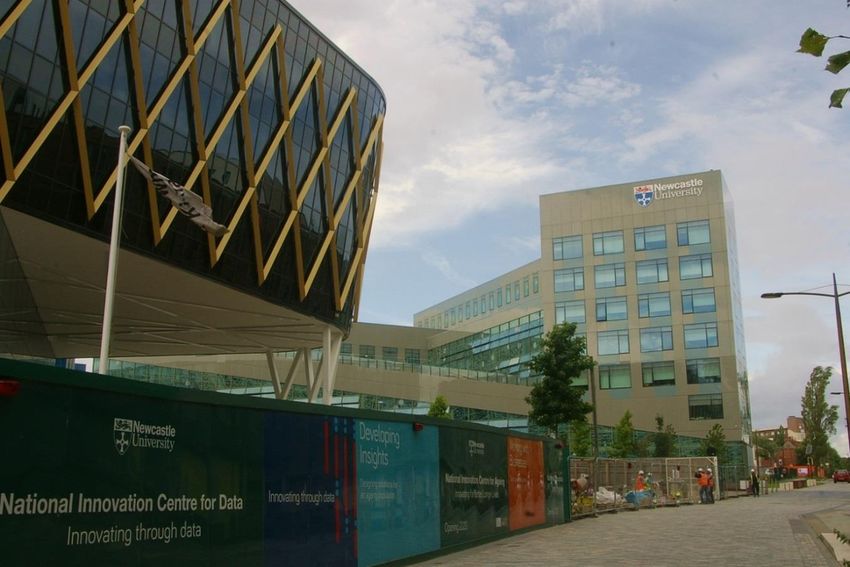
Alternatives could certainly be designated, perhaps covering larger areas of the country, like the
five-county Arc itself. They could also be designated in the UK beyond the borders of England.
If the stipulation that arcs should have multiple universities were dropped, a larger number of
areas could be chosen.

Chapter 5 A Wolverhampton-Coventry Arc is a far better candidate for “growth corridor”
status. A multi-university arc indicates a Wolverhampton-Birmingham-Coventry Arc, though
other parts of the West Midlands might be included. It would fulfil the Government’s criteria
and scores strongly on our four sustainability qualities. It would address economic need and
offers locations for sustainable development.

Chapter 6 An extensive potential arc lies in North East England. Anchoring it to universities
would necessitate a Newcastle-Sunderland-Middlesbrough Arc, though it would benefit from
the proximity of Durham University. It might usefully extend into south-east Northumberland
and the western parts of Teesside if the universities criterion were relaxed. This arc also scores
strongly on our four sustainability criteria.

Chapter 7 More tightly defined than the first two, the third arc we have identified lies between
Nottingham and Derby. It scores strongly on all four Arc criteria and all four of our
sustainability criteria.

Chapter 8 Greater Manchester, with its vibrant commercial, cultural and academic life, is an
obvious candidate for an arc. Strict adherence to the universities criterion dictates a
Manchester-Salford-Bolton Arc which scores extremely well on both the four Arc criteria and
our four criteria of sustainability.

Chapter 9 West Yorkshire’s geography complicates identifying an arc for the county but the
multiple universities criterion makes a Leeds-Bradford-Huddersfield Arc the obvious choice,
scoring well on all eight criteria. But adhering rigidly to the multiple universities criterion rigidly
could exclude other suitable areas.

Chapter 10 If the arc concept is a sound one, there is no reason at all why it should not be
applied in Northern Ireland, Scotland and Wales.

Chapter 11 Exaggerated claims about the Arc’s supposed high productivity and unique
suitability for accelerated development persist, despite the unsustainable nature of the proposals.
But we believe that, if the arc concept is a sound one, there are better places for its application.
There are many places through much of the UK where it could be applied; we chose five clear
candidates which meet the Arc’s own criteria and the (non-exhaustive list of) four sustainability
qualities. There are, assuredly, others. Those we have chosen are all more in need of investment
and resources, well placed to take advantage of them and well equipped to accommodate them.

We therefore recommend that planning for the Oxford-Cambridge Arc be terminated
and the resources devoted to examining the growth potential of areas that both need that
growth and which could accommodate it sustainably.

                                                   5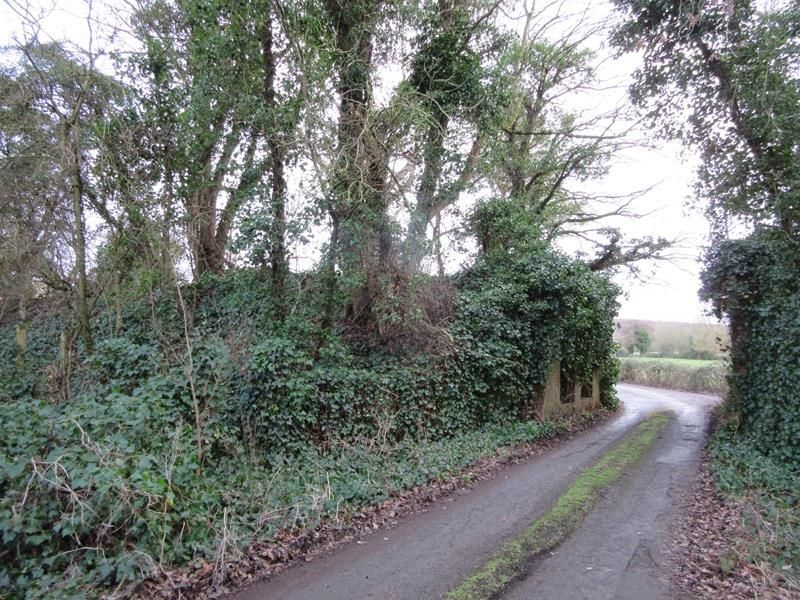
A place for sustainable growth                       [Smart Growth UK]

A place for sustainable growth of a different kind      [Stella Stafford]

                                             6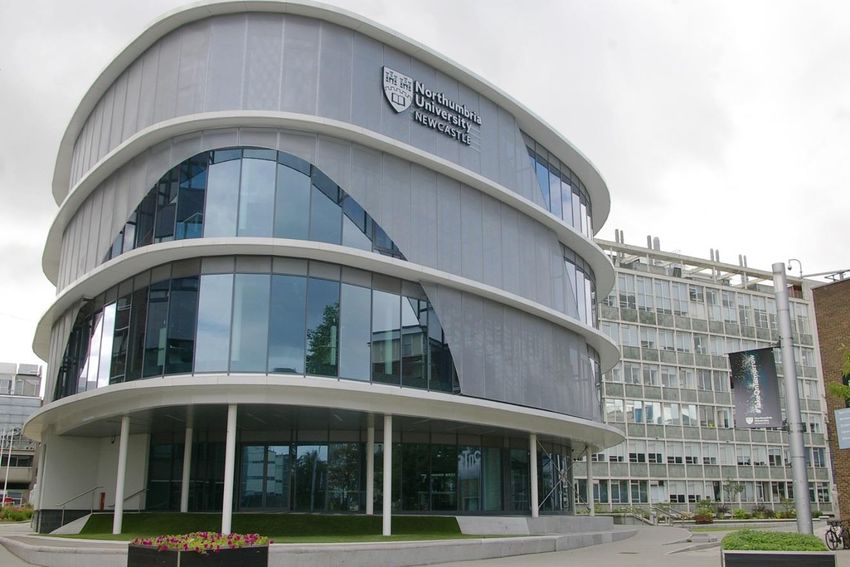
1. Introduction
__________________________________________________________________________

We urgently need to rebalance our economy. As a nation, we are badly divided geographically
into have-regions and have-not-regions. This uncomfortable truth was confirmed by the
UK2070 Commission, set up to examine these inequalities, in its recent first report1. It
concluded there are deep-rooted inequalities across the UK and there is none of the long-term
thinking and spatial economic planning that are needed to tackle them. The Commission said the
regional inequalities which blight economic performance and life chances may become
significantly worse unless drastic action is taken.

“Whilst London and the South East of England confront increasing pressures on living costs
and resources as they soak up most of the UK’s job growth and productivity, our report argues
that many people and businesses outside of these areas are likely to miss out on the benefits of
growth,” said the Commission.

This report is the second part of our examination of the so-called “Oxford-Cambridge Arc”. The
Arc proposals are a clear example of Government action likely to make regional inequalities
worse by accelerating concentration of investment and support in the wider south-eastern part of
England. In this second part we will examine the basis of the Arc concept and look at whether
there are other parts of England, and maybe beyond, where the concept might be beneficially
applied without doing the harm the Arc proposals would cause.

In Part 1 we looked at the weak foundations of the “Oxford-Cambridge Arc” (which we will
refer to simply as “the Arc”). That report examined the shaky foundations on which the Arc
(and its associated Cambridge-Newbury Expressway) was launched, how it was adopted by
Whitehall (the Treasury in particular, which ensured its progress) and how this support
essentially guaranteed the backing of the National Infrastructure Commission, Highways
England, other Government departments, local enterprise partnerships and most of the local
authorities involved.

The whole process has been remarkable for its lack of meaningful public consultation
throughout, even with those most at risk. Nor has there been any strategic environmental
assessment, despite the scale of the proposals.

Yet the Arc, now grown far beyond the original Oxford-Cambridge Corridor to five whole
counties plus Peterborough, lacks any real unifying economic or political feature. Its urban
centres are relatively small and separated by huge areas of open country.

For the most part it is relatively prosperous, unlike many other parts of the UK which are crying
out for attention and investment. Contrary to its PR spin, however, the Arc’s overall productivity
is only slightly above the national average and it is short of housing and infrastructure as a result
of continued government support for growth there.

It is spectacularly unsuitable in environmental terms; it is short of water, it has high-standard
countryside and it makes a huge contribution to the food supplies of a nation already unable to
feed itself.

                                                 7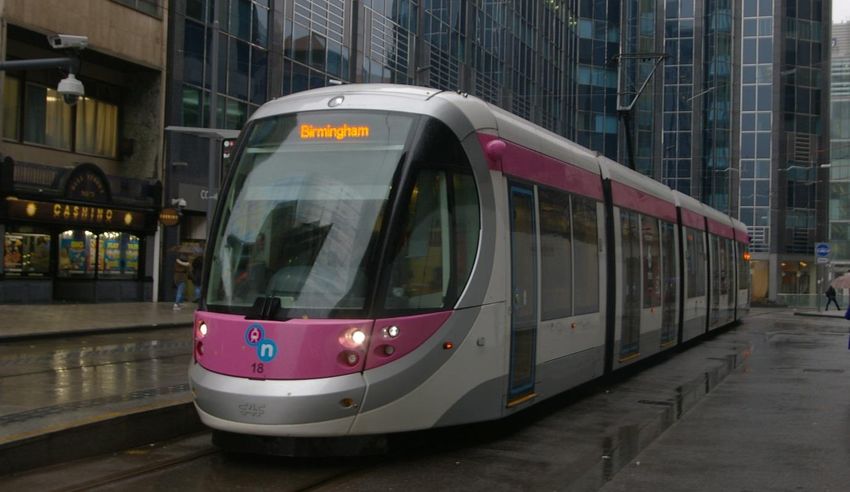
No-one, at any stage in this three-year process, seems to have stopped and asked:-

    1. if the Arc as formulated was a good idea; and
    2. if so, whether it was being developed in the right place.

We take no view here on whether the arc concept is worth pursuing but, if it is (and only if it is),
then this second part of the report asks whether, if the Arc concept is a sound one, it might be
beneficially located in other parts of England. We will examine the present Arc proposal through
the lens of the Smart Growth approach and we will try to identify possible candidates where the
concept might be beneficially applied without the harm the Arc would cause and so obtain some
benefit from the huge level of scarce public resources already poured in.

                                                 8
2. What qualities would a sustainable “arc”
possess?
__________________________________________________________________________

Part 1 of this report mostly examined the shortcomings of the Arc proposal and the
undemocratic way it was evolved. Smart Growth is, however, an essentially positive approach
which aims to promote more sustainable ways of developing and travelling. So this second part
of the report aims to see if the concept could be applied sustainably in other parts of the country.

The specific qualities which prompted identification of the Arc are apparently:-

       1.   outstanding universities and research institutions;
       2.   knowledge-intensive businesses;
       3.   a skilled workforce;
       4.   historic cities.

These can, of course, be important assets for rapid economic growth in any area or region. But
the overheated Arc is by no means the only part of the UK where such qualities are found and
there are additional local factors which, if present, could secure the Arc’s desired ends without
causing its massive damage to the environment. The four further factors we have concentrated
on are:-

       5.   availability of brownfield development land;
       6.   no acute shortage of housing;
       7.   high-quality public transport;
       8.   a need for economic regeneration.

This is not to say these are the only sustainability factors we need to test the Arc against, far
from it. Availability of water, quality of landscape and biodiversity are three vitally important
factors, but our resources are limited and we have done what we can within them (multi-million
pound research and public relations budgets being the preserve of the development industry and
its supporters in Whitehall). These other factors will need urgent examination, however,
especially given the growing water crisis in the eastern counties.

Before proceeding with the current Arc project, it is essential that we should ask whether such a
development should take place in the five counties proposed when there are so many other areas
which, while sharing its qualities, have other features that would facilitate large-scale
development in a sustainable fashion and which have a much greater need for the development.

                                                 9
3. The Oxford-Cambridge Arc – a failure of strategic
planning
__________________________________________________________________________

The obvious first “arc” to which we should apply all our eight criteria is the five-county Oxford-
Cambridge Arc itself. Unsurprisingly, given that it was criteria 1-4 that led to its designation,
some areas within it score well, though even on its own criteria, others score less well. But
judged against our sustainability criteria 5-8, it scores really badly.

For the most part the development would be highly dispersed low-density greenfield sprawl, the
antithesis of sustainable development. It would be seriously dependent on the motor car and the
Expressway which forms its spine would begin the process of creating an “Outer M25”, further
cranking up the country’s dependency on road transport. It would fail to respect the countryside,
farmland, natural beauty, open space, soil, biodiversity or natural capital. It would suck further
economic activity out of regions that desperately need it toward an area parts of which are
already severely overheated, thereby undermining regeneration, brownfield reclamation and town
centres nationally. It has been a spectacular failure in terms of community involvement.

Part of the Arc is called “England’s Economic Heartland”, though it is difficult to see why this
should be the case when compared with, say, the City of London or other major cities. But the
danger of designating anywhere as the economic heartland is that it simply downgrades
everywhere else. In the same way, basing it around the academic superiority of just two
universities downgrades the quality of all the rest of the UK’s academic institutions. All this is
spectacularly unwise at a time of economic uncertainty.

The Arc concept was developed around the idea that agglomeration of the knowledge economy
would improve its growth. But the “five counties plus” iteration of the Arc is far too large, low-
density and dispersed to achieve this even with the huge amount of development proposed. Its
main effect could be to create a lot more long-distance commuting into London. The
Expressway’s main function would be as the first stage of the “Outer M25”.

The Arc’s development under the auspices of the NIC was implicitly based around criteria 1-4.
We believe that applying these four alone has enabled the Government to pursue this destructive
plan, as explored in Part 1 of this report. But suppose we apply our sustainability criteria 5-8 to
the Arc?

5. Brownfield and Greenfield The vast majority of the Arc’s potential housing and
development sites are greenfield. One of the key criticisms levelled against it is that those who
created the Arc simply specified a boundary and never even bothered to consider whether the
land within it was suitable for development. Yet it includes large areas of three AONBs and the
green belts around Cambridge, Oxford and Luton. An overwhelming majority of it is
undeveloped farmland, most of it high quality, and there are significant areas of woodland and
other high quality natural environment.

                                                 10
Top-quality agricultural land is the Arc’s default development location [Stella Stafford]
6. Housing The Arc’s proponents are united in their assessment that the area is desperately
short of housing and this in borne out in some parts of it by very high house prices. The average
house price is £310,927 in Bedfordshire, £424,751 in Buckinghamshire, £309,705 in
Cambridgeshire, £257,631 in Northamptonshire and £416,940 in Oxfordshire (all figures from
Rightmove).
Few would disagree that parts of the Arc are significantly short of both market and social
housing. However, taking it as a whole, the problem is not especially more serious than in the
rest of southern England. The Government’s 2019 document on its ambitions for the Arc2
pointed out that nationally the ratio of median house price to median income (the standard
measure of housing affordability) has risen from five times in 2000 to around eight times in
2016. In the Arc as a whole, the document’s Chart 3 showed, that has risen to around ten times.
But it did concede that: “the affordability ratio is particularly high in Oxford (12.34) and
Cambridge (13.35)” which suggests that, in the rest of the Arc, the ratio is near, or at, the
national average. But more importantly, the accelerated employment growth in those two cities,
actively encouraged by central government, has been achieved only at the cost of very high
house prices and overloaded infrastructure. The Arc’s promoters, however, fail to recognise that
this is not an argument for unsustainable levels of house building, but a powerful argument
against pursuing further growth in those places. The economies of both Oxford and Cambridge
have been allowed to become seriously overheated for at least 20 years, running well ahead of the
11provision of housing and infrastructure such growth ought to necessitate if it is to happen
sustainably.
This is not a planning success; it is a very serious planning failure. Growth which is seriously
needed elsewhere has been allowed to concentrate in small areas totally unfit to accommodate it,
on the basis of dubious claims that Cambridge and Oxford have unique economic advantages
which could not be found elsewhere and a desire among well-placed alumni of the two ancient
universities to favour them.
7. Public Transport What high-quality public transport the Arc possesses is mostly radial
heavy-rail routes, supplemented by local bus routes heavily concentrated in towns. Although rail
commuter routes to London from its relatively small and well-separated towns are mostly of
good quality, local heavy rail services are few and there are many towns which lack such a service
altogether.
None of the Arc’s towns have current light rail and proposals for Cambridge and Oxford have
been repeatedly rejected. An imaginative and practical scheme for Cambridge was put forward by
Cambridge Connect and it received support from the Combined Authority to help it contribute
to the mass transit study completed early in 2018. Following the study, however, the
Cambridgeshire & Peterborough Combined Authority decided3 to go ahead with bus options.
The only major scheme to improve rail-based communications is the long-standing proposal to
reopen the closed sections of the Cambridge-Oxford line, including the demolished section
between Bedford and Cambridge, parts of which have been built on.
Arc promoters show little interest in reviving its many closed railways [Stella Stafford]
12Part 1 of the Smart Growth UK report4, published in February, showed there are at least 14
other closed railway alignments within the Arc which could, and should, be reopened if its
promoters are at all serious about sustainable transport. Yet there are only proposals for two very
short lengths. No interest is currently being shown in light rail, despite its very obvious energy
consumption advantage over buses.
8. Regeneration Most of the Arc lies in the more prosperous parts of the UK and it includes
no area of acute deprivation. The English Indices of Deprivation 20155 show that, of the districts in
the Arc, only Bedford, Luton, Milton Keynes and Northampton are even in the bottom 50
percentile of the Index of Multiple Deprivation for the most deprived neighbourhoods.
In its ranking of the most deprived LEP areas, the only Arc LEP just in the top half is
Northamptonshire, the 18th most deprived LEP area out of 39. South East Midlands is ranked
26th, Greater Cambridge and Greater Peterborough 29th, Oxfordshire 35th and Buckinghamshire
Thames Valley 38th out of 39.
The Arc in a Regional Context The Government’s ambition document for the “Oxford-
Cambridge Arc”, published as part of the 2019 Spring Statement6 with a joint declaration
extracted from its local partners, demonstrated quite clearly why the Arc would further distort
the country’s already hopelessly unbalanced national economy.
The report offered a diagram showing the productivity of the various local authority areas in the
Arc which merely served to demonstrate that it is not uniform across the area; in South and East
Northamptonshire it is little more than half what it is in Milton Keynes and Chiltern. But it said
that productivity in the Arc as a whole: “is around 2.55% higher than the UK average”. As
plainly no-one would be impressed by such a marginal figure, it went on: “More significantly, the
growth of GVA per head has been significantly greater in the Arc between 1997 and 2015 than for
England and Wales as a whole (by 28.2 percentage points)”.
Growth of 28.2% of 2.55% suggested that productivity across the Arc as a whole was unlikely to
reach the sort of claims made for it, including that it has the second highest productivity in the
UK after London, in the foreseeable future. And even if it were outstripping the rest of the UK,
that is surely a reason for investing in the rest of the country.
Productivity, of course, is only one aspect of prosperity, but the idea that the Arc has a stronger
economy and so should enjoy accelerated investment to increase its disparity with the rest of the
nation has been a feature of the literature about it since the start. The new document continues
the theme.
“The Arc’s economy also appears to be more resilient than the national average, with 2.5
percentage point growth in GVA per head between 2009 and 2010, compared to 1.3 percentage
points in London and 1.7 percentage points in England and Wales as a whole,” it says.
“However, GVA and productivity are not uniform across the Arc. Milton Keynes has the highest
productivity per worker, almost 45% higher than the national average outside of London, whilst
productivity in around half of the Arc’s constituent local authority areas is below the UK
average.”
13In other words, parts of the Arc have high productivity, and so have less need for the additional
investment, while other parts of the Arc have below-average productivity, like some less
prosperous parts of the UK which deserve additional support. This completely undermines the
argument that the Arc deserves additional support because of its uniquely high productivity;
overall its productivity is slightly above average. Its proponents are trying to have it both ways.
Changes in gross value added (GVA) per head by region were summarised last year in a Briefing
Paper7 by the House of Commons Library. Assessing the Arc’s need for economic help is
complicated by the fact it occupies parts of three standard regions. Two of these, the South East
and East of England have seen high growth; over the 2010-16 period, the East grew by 13% and
the South East by 12%, outstripped only by London (22%) and the West Midlands (15%). This
compares with 9% in the South West, 8% in Northern Ireland and the North West, 7% in
Yorkshire and Humberside and just 4% in the North East.
The picture is heavily distorted by London, which in 2016 enjoyed GVA per head at 177% of the
national average. The South East has the second highest at 109% of the national average, East
of England comes fourth at 91% and only the East Midlands (which includes Northamptonshire
and Peterborough) is in the bottom half at 80%.
But, of course, there can be substantial variation in GVA per head across a region. The paper
included a spreadsheet8 showing workplace-based GVA per head by local area in 2016. Most
local areas in the Arc score well.
Workplace Based Gross Value Added Per Head by Local Area 2016
Milton Keynes 46,780
Oxfordshire 33,337
Buckinghamshire 30,106
Cambridgeshire 28,077
Peterborough 27,595
West Northamptonshire 26,033
Luton 24,339
Bedford 23,895
North Northamptonshire 20,379
Central Bedfordshire 20,338
[Source: House of Commons Library]
Only Milton Keynes featured in the UK top 10, giving the lie to those who argue the Arc has
such high productivity it should be a centre for investment. On the other hand its economy is
mostly a bit above average, showing it needs no special economic assistance. Compare the top
and bottom 10 NUTS3 areas.
14Workplace Based Gross Value Added Per Head by Local Area 2016
Camden and City of London 318,673
Westminster 238,506
Tower Hamlets 91,378
Kensington & C/Hammersmith & Fulham 68,675
Haringey and Islington 46,880
Milton Keynes 46,780
Hounslow/Richmond upon Thames 43,463
Berkshire 41,685
City of Edinburgh 39,321
Belfast 35,791
Northumberland 16,140
Lancaster and Wyre 16,083
Sefton 15,730
Dudley 15,597
North of Northern Ireland 15,488
East Ayrshire and North Ayrshire mainland 15,376
Wirral 15,237
Torbay 14,888
Gwent valleys 14,759
Isle of Anglesey 13,655
[Source: House of Commons Library]
In productivity terms, in fact, there is nothing special about the Arc at all. It is mostly a bit above
average, and therefore less need of economic help, but its productivity is not so impressive that it
could form an exceptional basis for strongly accelerated growth. In fact the lack of uniformity
across the Arc shows once again that it is an entirely artificial construct with no basis in reality.
15GVA per Head, 2016
Productivity across the Arc varies, but overall is not particularly high
[Source: House of Commons Library]
16As noted above, however, productivity is only one aspect of economic health. The Gross
Disposable Household Income per head statistics, however, paint a similar picture.
Gross Disposable Household Income per Head, 2016
Buckinghamshire 24,270
Oxfordshire 23,675
Cambridgeshire 21,322
Central Bedfordshire 20,719
Bedford 20,136
West Northamptonshire 20,062
Milton Keynes 20,039
North Northamptonshire 18,315
Peterborough 16,563
Luton 14,889
[Source: Office for National Statistics]
Once again, comparing them with the top and bottom 10 shows there is neither strong economic
health nor intense deprivation in the Arc. Most income figures in the Arc’s NUTS3 areas are
clustered around, or a little above, the English national average of £19,878.
Gross Disposable Household Income per Head, 2016
Kensington & C/Hammersmith & Fulham 58,816
Westminster 50,910
Camden/City of London 45,225
Wandsworth 37,288
Hounslow/Richmond upon Thames 31,505
West Surrey 28,467
Haringey & Islington 28,188
Barnet 27,455
East Surrey 27,263
Bromley 27,169
Stoke-on-Trent 14,075
Derry City/Strabane 14,036
17Wolverhampton 13,926
Walsall 13,791
Kingston upon Hull 13,380
Manchester 13,184
Sandwell 13,164
Leicester 12,848
Blackburn with Darwen 12,450
Nottingham 12,232
[Source: Office for National Statistics]
So while the Arc has small areas of high productivity, around Cambridge, Milton Keynes and
Oxford and around the M4, overall it is nothing special. Equally, most of its prosperity is fairly
typical of South East England and the East of England outside London, though again there are
pockets which are less prosperous. But not only does it fail to demonstrate any particular
importance for investment in productivity terms, nor any particular reason for special help in
economic terms, neither does it demonstrate any particular reason for being regarded as separate
from the rest of the country.
There is nothing at all special about the Arc but, reflecting as it mostly does, the relative
prosperity of the south and east of England compared with the rest of the UK, there is plainly a
very strong case to reallocate the big investments planned for it to the parts of the UK that need
it. Constantly backing winners will just exacerbate regional differences, with all the ill-effects that
inevitably follow.
184. Alternative arcs
__________________________________________________________________________
In designating sustainable alternative arcs it will be necessary to specify that candidates meet our
four sustainability criteria, as well as the four Arc criteria. For instance, it would be necessary to
state quite explicitly that not all the areas within their boundaries are suitable for development
and to affirm very strongly that a range of Smart Growth considerations, including brownfield-
first and good access to rail-based public transport and services, must apply. There is no reason
defining them should be difficult; green belts have been carefully defined too.
Informal discussions among Smart Growth UK supporters have yielded a tentative list of areas
in England which have the four qualities the Arc is alleged to have, but which also have the four
sustainability criteria we identified in Section 2 above.
The list is certainly not exhaustive, nor are those chosen necessarily the most suitable. But all
those included do meet our extended criteria to a greater or lesser extent and, while they are not
necessarily the most appropriate places for an “arc of sustainable development”, they clearly
offer better alternatives to the Arc. The five are presented in this report as a basis for discussion,
in no order of preference, are:-
Wolverhampton-Birmingham-Coventry;
Newcastle-Sunderland-Teesside;
Derby-Nottingham;
Manchester-Salford-Bolton-Preston;
Leeds-Bradford-Huddersfield.
Indeed, now the Treasury has expanded the Arc to cover five whole counties plus add-ons, it
might be possible to consider even larger-scale alternative arcs. One which has been suggested is
Liverpool-Manchester and there are others but, because of their size and the resources available
to us, we have not been able to consider these in detail.
The “Oxford-Cambridge Arc” is a construct of the UK government, but involves planning and
transport policies which, in the parts of the UK outside England, are locally determined by the
devolved administrations. The possibility of arcs outside England is considered in Section 8
below. We have principally concentrated on alternative arcs in England, but there is no reason
why the concept should not be applied in the rest of the UK. Some possible arcs which have
been suggested are:-
Paisley-Glasgow;
Cardiff-Pontypridd;
Bridgend-Swansea.
19Were larger-scale arcs to be
considered beyond the
borders of England,
Edinburgh-Glasgow also
presents itself as a possibility.
Edinburgh [Allan Dare]
Meanwhile, if the NIC’s four basic criteria are relaxed slightly, a large number of potential arcs
with good public transport and brownfield land supplies, no significant shortage of housing and
a need for regeneration could be identified. The requirement for multiple universities is
particularly restrictive but we have stuck with it as a means of comparison with the Oxford-
Cambridge Arc, although it demonstrates once again the narrowness of thinking which led to the
designation of the Arc.
It would be unfair to say central government is unaware of the investment needs and economic
potential of the rest of the country and it has its Northern Powerhouse and Midlands Engine
initiatives, as well as a number of growth deals. All are receiving levels of investment, but the
problem is that attention and resources are being diverted to the wholly unsuitable Arc, at a time
when the needs of much of the rest of the country have seldom been so stark.
205. Wolverhampton-Birmingham-Coventry
__________________________________________________________________________
The Wolverhampton-Coventry Arc is a far better candidate for “growth corridor” status than
Cambridge-Newbury as it would fulfil the Government’s criteria and our additional ones, it
would address economic need and it offers suitable locations for sustainable development.
Applying all the eight criteria above:-
1. Universities and Research Institutions This Arc is home to Aston, Birmingham,
Birmingham City, Coventry, Newman, Warwick and Wolverhampton Universities and has as
many Russell Group universities (two) as the Arc. They “consistently rank highly in national and
international assessments of research quality, and… are amongst the country’s most successful
institutions in securing competitive research funding, with particular strengths in the broad areas
of engineering and physical science and the biosciences”9. One was rated in the Research
Excellence Framework (REF) in the top 20 for the power and/or quality of its research in no
less than 33 of the 36 REF Units of Assessment. The universities hold active research funding
from UK research councils of around £550m, about 6.5% of the English total.
Aston University had 78% of its research outputs rated world leading (4*) or internationally
recognised (3*) in the 2014 Research Excellence Framework. Warwick University also
strengthened its already strong position in the 2014 REF.
2. Knowledge-Intensive Industries The three West Midlands LEPs worked with the West
Midlands Combined Authority and Birmingham Science City to produce a supplementary
report10 to the Midlands Engine Science & Innovation Audit, itself part of the national science
and innovation audits. It covered the Wolverhampton-Coventry Arc we are considering here,
together with a wider West Midland area but, as it says, although science and technology
employment is distributed widely, “there are particular concentrations in Birmingham, Coventry
and Wolverhampton city centres, in Edgbaston (with a particular focus on life sciences), the area
surrounding Birmingham Airport…” It also references the automotive sector around Gaydon
and computer software in Warwick and Leamington which are outside our area of consideration.
“The research landscape across our area is multi-faceted, spanning the full ‘technology readiness
level’ spectrum, from basic and experimental research, through to applied and collaborative
R&D, and on to commercial implementation,” says the Innovation Audit. "Our area includes
world-class universities (with Birmingham and Warwick both ranked in the Top 100 globally),
innovative and nationally significant research and technology organisations and major private
sector R&D establishments that are internationally connected and globally significant.”
The significance of this corridor as a key area of knowledge-based economic growth is already
recognised in part by central government with the designation of the Black Country as an
enterprise zone in the local authority areas of Dudley, Sandwell, Walsall and Wolverhampton and
the Birmingham Enterprise Zone.
21“The Black Country Enterprise Zone is described as the most successful nationally, and has
already generated £1.5bn of investment,” says the Government’s Enterprise Zones website.
“The Black Country Enterprise Zone comprises a portfolio of sites in Wolverhampton, Dudley
and Walsall. There are a number of opportunities for investors at the helm of the region’s
industrial heartland.”
Like other enterprise zones, the Black Country’s is based around a series of development sites
offered tax breaks and Government support for business development. Five major sites are
already available for development and three further sites in Walsall are described as “longer term
opportunities”.
“The Black Country has seen a significant increase in foreign and domestic investment over the
last few years and was recognised as one of the top five cost-effective regions in the UK by the
fDi Magazine in 2016/17,” says the website. “From manufacturing to transport infrastructure,
education to culture, this area is rich with resources and is open to development. The Black
Country Enterprise Zone is described as the most successful nationally, and has already
generated £1.5bn of investment.”
The Birmingham EZ is based around 26 sites in the City and aims to create 40,000 jobs over its
lifespan, adding £2.8bn to the local economy.
“The Enterprise Zone is playing a leading role in the redevelopment of Birmingham city centre,
with work to begin shortly on the £450m redevelopment of Paradise Circus, as well as the
expansion of the Midland Metro to Broad Street, in addition to a host of business and skills
support packages,” says the Enterprise Zone website. “Activity is gathering pace, with eight sites
already under construction, transforming the cities centre with new spaces and offices. The Zone
will also be a gateway to the proposed HS2 rail terminal at Curzon Street.”
Coventry does not have an enterprise zone designated but is a major industrial city and also
home to two internationally famous universities – Warwick and Coventry. The city is separated
from the rest of the West Midlands conurbation by an area of green belt which it would be
important to protect, but there is no reason why the whole of the “Arc” from Wolverhampton
to Coventry should not be considered as a knowledge-based growth corridor.
The Black Country LEP has identified five priority areas with the potential for transformational
growth: advanced manufacturing including food and drink, transport technologies including
aerospace, construction including building technologies, environmental technologies and
business services. Greater Birmingham and Solihull LEP wants to build on the area’s strengths in
advanced manufacturing and transport technologies, digital and creative industries, the cultural
sector, medical and life sciences, and environmental technologies. Coventry and Warwickshire
LEP says its area is already recognised as a globally important hub in developing low-carbon
technologies and the advanced manufacturing and engineering sector.
“Our area has long been recognised as the heart of the UK’s manufacturing and engineering
sectors – a position we confidently retain, alongside an increasingly diversified economy,” said A
Science & Innovation Audit for the West Midlands11.
223. Workforce The three West Midlands LEP areas support around 350,000 employees in
science and technology, consistent with the national average, and with concentrations in
Birmingham, Coventry and Wolverhampton city centres and Edgbaston.
Despite the region’s strength in science and technology, however, it is recognised that 40 years of
deindustrialization have left productivity below the national average12. The West Midlands
Combined Authority has established a Productivity and Skills Commission to identify the causes
and address the issues which include skills deficits, too few people in employment and the
quantum and quality of the business base. That said, there is plainly a pool of potential
employees which the Oxford-Cambridge Arc is plainly chronically short of and likely to remain
so for the foreseeable future. The authorities in the West Midlands are focused on leveraging the
critical mass of world-class science and innovation assets the county enjoys.
4. Historic Cities Coventry has been one of the most important cities in England since the
early Middle Ages. Its history goes back to Saxon times and it grew rapidly in the Middle Ages on
the back of weaving and dyeing wool, becoming a city in 1345. Later, silk weaving and watch
making became important and later bicycle making. Extensive friaries were closed at the
Reformation but the large parish church became a cathedral in 1919. Since early in the 20th
century motor manufacturing became important. The city was heavily damaged by bombing in
1940 and 1941 and extensive rebuilding took place after World War II. The decline of the motor
industry has hit the city, but it remains an important manufacturing centre with two universities
and a population around 300,000.
Birmingham too has a long history and was at the centre of Britain’s industrial revolution in the
18th and 19th centuries. It was also founded in Saxon times and became known in the Middle
Ages for its wool industry, metal working and leather. From the 16th century it grew rapidly and
gradually metal working came to dominate thanks to local iron ore and coal. By the beginning of
the 19th century its population was 73,000 and it was one of the bigger towns in the country.
Metal working, together with jewellery and engineering, powered its massive growth in the 19th
century and it became a pioneer in addressing the social, health and environmental problems
caused by industrialization. It became an important communications centre and by the end of
the 19th century its population was 630,000. In the 20th century the city continued its industrial
growth and pioneered initiatives such as council housing. Like all industrial towns, it suffered
significant economic reverses in the late 20th century and service industries became more
important. Removal of the Inner Ring Road has allowed the city centre to expand and, as
England’s “Second City”, the population now exceeds one million.
Wolverhampton is an altogether newer city, being so designated in 2000. However, the town
itself has a long history dating back to Saxon times. It also grew in the Middle Ages as a market
town and a centre of the wool trade. Much of the town was destroyed by fire in 1590 and
another big fire damaged the town in 1696. During the industrial revolution it became a centre of
the coal and steel industries, lock making and, later, manufacture of cars and motorcycles. Today
there is still a significant presence of engineering, including aeronautics. The local higher
education facilities became the University of Wolverhampton in 1992. Today its population is
around a quarter of a million.
235. Brownfield and Greenfield The West Midlands has one of the biggest asset bases of
brownfield land in the country. An analysis of English local authorities’ brownfield registers by
the National Housing Federation in 201813 showed the whole West Midlands standard region
had 1,992 brownfield sites covering 2,691ha and the West Midlands Combined Authority 1,307
sites covering 1,373ha. In the local authority areas covering our proposed Wolverhampton-
Coventry Arc, Wolverhampton had 482 sites (249ha), Walsall 111 (65ha), Sandwell 251 (451ha),
Birmingham 384 (394ha), Solihull 51 (149ha) and no figures was given for Coventry. The
Federation estimates the four council areas of Birmingham, Sandwell, Solihull and Walsall could
accommodate 43,000 homes, though this does not include Coventry or Wolverhampton. The
figures also exclude the 28 sites totalling 66ha in Dudley, which, while not directly on a
Wolverhampton-Coventry Arc, could be included if we adopt the loose definition of the Arc
(towns like Aylesbury, Northampton and Banbury are nowhere near “the Oxford-Cambridge
corridor”, but have been included in the Arc).
With all our brownfield arcs, it will be important to specify densities for new housing that are
significantly higher than the “garden suburb” approach which all too often squanders our scarce
building land. Opportunities for densification of existing development should also be taken
where they secure local support.
The West Midlands county does, however, also have an extensive green belt and it would be
important to specify not only where Arc-type development policies should apply, but also where
they should not apply (a key failure of the Arc). A strong brownfield-first policy should be
imposed and greenfield land of any kind only released for development when absolutely
unavoidable.
6. Housing Virtually everywhere in the country has some kind of unmet housing need, most
acutely for social housing, and the West Midlands is no exception. That said, however, it is plain
there is far less pressure on market housing than in the south of England, and the areas around
Oxford and Cambridge in particular.
Prima facie evidence of this lies in the designation by the Government, in 2002, of Birmingham
and Sandwell as one of nine “Housing Market Renewal Pathfinders”. These were explicitly
intended to “renew failing housing markets and reconnect them to regional markets”,
“encourage people to live and work in these areas” and “improve neighbourhoods”. They were
areas where house prices had not risen in line with national trends (increasing the wealth of their
owners) and, in a few cases, were suffering from abandonment. Although some money was
spent on improvements, the programme began demolishing thousands of homes, mostly
sustainably built Victorian terraces, in an effort to force up local house prices. The programme
ran into huge opposition from both residents’ and conservation groups and was eventually
abandoned altogether in 2011.
The programme had Treasury support and ran at the same time as its early efforts to boost
house building in the mistaken belief this would even out the ups and downs of the UK
economy, as claimed in the Barker Reviews. Eventually the Treasury switched to simply building
huge numbers of houses in virtually all English local authorities, from 2012. But the fact that
Birmingham and Sandwell were ever included in Pathfinders shows that parts of the West
Midlands were, relatively at least, well supplied with housing.
24The Government agreed a bespoke housing package with the West Midlands Combined
Authority (WMCA) in March 2018 which commits the local authorities to ensuring 215,000
homes are built by 2030-31, a 25% increase in delivery rates. Local plans will be amended
accordingly. In return the Government has agreed to a Land Fund of up to £100m to acquire
and derisk land in priority areas including the Walsall-Wolverhampton corridor where 8,000
homes could be built. It also agreed to take forward a Housing Infrastructure Fund bid for areas
including the Commonwealth Games site at Perry Bar to the next phase of the bidding process.
The WMCA has set up a Land Commission to identify ways of delivering more developable land
for housing and employment.
Unlike the Oxford-Cambridge Arc, market housing in the West Midlands remains relatively low-
cost. The overall average house price in the West Midlands county is £207,118. The average
price in Wolverhampton is £185,060, in Bilston £136,738, in Wednesbury £142,053, in West
Bromwich £149,392, in Smethwick £176,792, in Birmingham £202,721 and in Coventry
£201,853.
7. Public Transport Here the Wolverhampton-Coventry Arc is particularly blessed, in a way
the Cambridge-Newbury Arc is cursed. The West Midlands has a good network of modern
heavy-rail suburban services, a fine, fast-growing, light rail system and a dense network of bus
services.
Public transport services in the West Midlands enjoy a high degree of integration. The West
Midlands Combined Authority set up Transport for the West Midlands to co-ordinate
investment and create an integrated, safe and secure network. Network West Midlands connects
all public transport and its logo appears at railway stations, Metro stops and bus stations and
stops. As well as the main line routes which include the West Coast routes, the North-East-
South-West route and cross-country routes, there is an extensive network of local heavy rail
services, much of it electrified. HS2 will provide high-speed services to the capital and the north
of England from the new station at Curzon Street.
Around £1.3bn is being invested in extensions to the existing West Midlands Metro light rail
system which currently links Wolverhampton with New Street Station via Bilston, Wednesbury
and West Bromwich.
The Westside extension will operate via Grand Central to Hagley Road in Edgbaston. The
Eastside Extension will run from Bull Street, via the new HS2 station at Curzon Street to a
terminus at Digbeth, serving the Eastside regeneration. It is intended to extend this for a further
17km to Solihull via the Airport and NEC.
A new line is planned in Wolverhampton linking to the station. There are also plans for an 11km
line from Wednesbury to Brierley Hill via Dudley.
25Almost 30km of extensions are underway on the Midland Metro [Smart Growth UK]
The conurbation also enjoys a dense network of bus services linking all parts.
8. Regeneration Like all of Britain’s traditional industrial areas, the West Midlands suffered
serious economic damage in the final quarter of the 20th century. Parts of the conurbation are
prosperous, others less so.
The English Indices of Deprivation 201514 rated Birmingham as sixth worst among the 20 local
authority districts with the highest proportion of their neighbourhoods in the most deprived 10%
of neighbourhoods nationally on the Index of Multiple Deprivation. Greater Birmingham and
Solihull also scored third worst, the Black country sixth worst and Coventry and Warwickshire the
16th worst in the proportion of neighbourhoods in each local enterprise partnership that are in the
most deprived 10% of areas nationally according to the same Index.
The Indices showed Birmingham is the district with the eighth highest proportion of the
population living in income deprived households nationally, Sandwell the tenth, Wolverhampton
the 12th and Walsall the 18th. Wolverhampton was 10th worst for employment deprivation and
Sandwell the 17th worst. Wolverhampton was 12th worst for income deprivation affecting
children, with Birmingham 15th and Sandwell 18th. Birmingham was 14th worst for income
deprivation affecting older people.
Conclusion The West Midlands is a suitable place for an “arc” in the ways the five counties
are not. It meets the four Arc criteria and also scores strongly on the four sustainability criteria
we have specified. If the multiple university criterion is deemed essential, then an arc from
Wolverhampton through Birmingham to Coventry would fit the bill, but other parts of the
county could beneficially be included.
266. Newcastle-Sunderland-Teesside
__________________________________________________________________________
An extensive potential arc lies in what was one of the cradles of the Industrial Revolution and
which remains central to the nation’s industrial base, stretching from Newcastle, via Gateshead,
Sunderland, a string of towns in County Durham and Hartlepool to Teesside. This arc could, if
the close tie to universities were slightly relaxed, also be potentially extended north-east of
Newcastle into the former coalfield which also has plenty of potential for brownfield growth.
Nearby is the ancient city of Durham with its famous university. As with all sustainable arcs, it
would need careful definition to avoid becoming yet another excuse for urban sprawl, but the
area is rich in brownfield land and knowledge-intensive education and industry.
1. Universities and Research Institutions The Newcastle-Teesside Arc is home to four
universities: Newcastle, Northumbria, Sunderland and Teesside, with the ancient and widely
respected University of Durham close by. Durham and Newcastle are members of the Russell
Group. Durham also has its Queen’s Campus in Stockton-on Tees.
North East England is home to one of only three genetics research centres in the UK aimed at
engendering fundamental improvements in human health. The Institute for Ageing and Health
plays host to the UK’s largest interdisciplinary research group in the field of ageing and age-
related illnesses. NEPAF (the North East Proteome Analysis Facility) is a commercially-based
analytical and research facility that supports academic researchers and professional companies
through the provision of regionally-based world-class expertise in protein analysis and
characterisation. The Institute for Cell and Molecular Biosciences at Newcastle University is a
world-leading centre of excellence in biosciences. The Institute forms the focus of basic cellular
and molecular biology at the University, integrating world-class research in prokaryotic and
eukaryotic biology.
Supporting offshore work, there is the National Offshore Renewable Energy Catapult Testing
Facility and the National Centre for Subsea and Offshore Engineering.
Newcastle University has had a long-standing partnership with Newcastle upon Tyne City
Council which aims to maximize the region’s scientific potential, raise awareness of its expertise
globally, and aid inward investment to scientific businesses. The University and Council joined
Legal and General in creating the new 10ha Newcastle Science Central development in the city
designed to attract scientific and technological organisations and built on the site of a former
brewery.
Rebranded as Newcastle Helix, Science Central will have 11 buildings and 450 homes. The major
buildings include the Biosphere (with commercial laboratory space, offices and support services),
the Core which will house knowledge-based, research-led businesses, the UK National
Innovation Centre for Ageing, the National Innovation Centre for Data, the Key dedicated to
structural and materials engineering research and Newcastle University’s Business School and
Urban Sciences Building.
27Newcastle University was ranked 16th in the UK for research power in the 2014 Research
Excellence Framework. Areas including dentistry, biological sciences, civil engineering and
mathematics were rated world leading (4*) or internationally excellent (3*). Northumbria
University achieved the biggest rise in research power from 2008 to 2014 in the UK and entered
the top 50, both quality and quantity having risen sharply.
Northumbria University [Smart Growth UK]
The 2014 REF results for Durham University (although slightly outside our area) showed that
almost 80% of its outputs were rated world leading (4*) or internationally excellent (3*). All 22 of
its units of assessment contained 4* research.
2. Knowledge-Intensive Industries North East England was one of the main cradles of
the industrial revolution and industry is still well represented today, specialising in advanced
manufacturing, life sciences, IT, energy and business services and most of this is concentrated
within the area we have identified as an arc.
Within manufacturing, there are more than 240 companies in the automotive sector, generating
over £1.1bn in sales and exporting more than £6.5bn annually. Companies include Nissan,
Komatsu, Caterpillar, Erwin Hymer and Cummins. Companies involved in electric vehicles
include Hyperdrive Innovation, Borg Warner and Avid Technology, backed by the Transport
Operations Research Group at Newcastle University. The rail sector is also well represented by
firms like Hitachi Rail, DB Schenker and Thermacore Europe.
Life sciences in the arc are represented by firms like Aesica and Piramal Healthcare and there are
sites for investors at Newcastle Helix, NETPark and the International Centre for Life. Newcastle
University ranks in the world top 100 for life science research and more than a quarter of the
28You can also read