Q2 Quarterly Market Review - Second Quarter 2021 - Pacifica Wealth Advisors
←
→
Page content transcription
If your browser does not render page correctly, please read the page content below
Q2
Quarterly Market Review
         Second Quarter 2021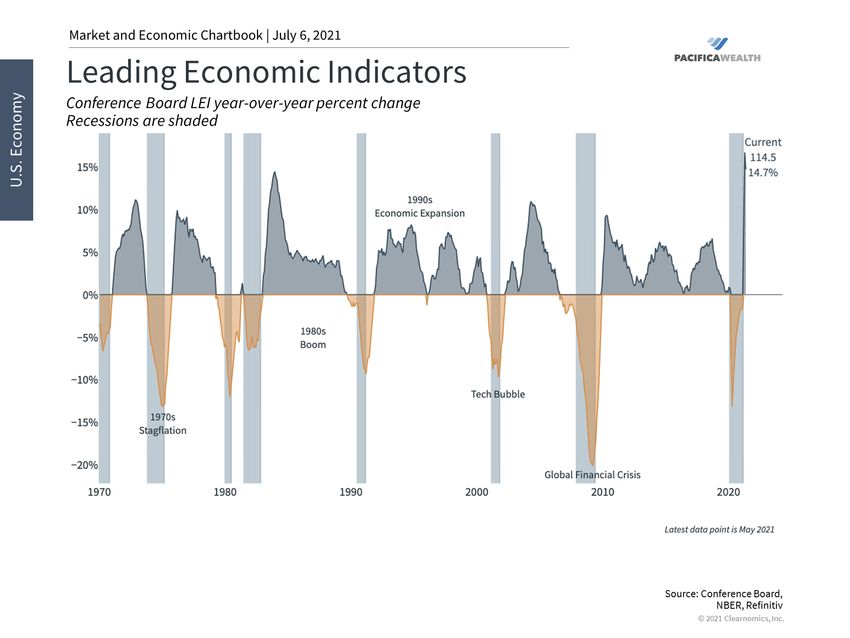
Quarterly Market Summary
Index Returns
                                                                                                                                                                                                             Global
                                                                             International                    Emerging                     Global                                                            Bond
                                                   US Stock                  Developed                        Markets                      Real                                 US Bond                      Market
                                                   Market                    Stocks                           Stocks                       Estate                               Market                       ex US

   2Q 2021                                                                                     STOCKS                                                                                          BONDS

                                                     8.24%                        5.65%                         5.05%                       10.17%                                1.83%                        0.35%

   Since Jan. 2001

   Avg. Quarterly Return                              2.4%                         1.7%                          3.1%                          2.6%                                1.2%                         1.1%

   Best                                              22.0%                        25.9%                         34.7%                         32.3%                                4.6%                         4.6%
   Quarter
                                                   2020 Q2                      2009 Q2                       2009 Q2                       2009 Q3                             2001 Q3                      2008 Q4

   Worst                                            -22.8%                        -23.3%                       -27.6%                        -36.1%                               -3.4%                         -2.7%
   Quarter
                                                   2008 Q4                      2020 Q1                       2008 Q4                       2008 Q4                             2021 Q1                      2015 Q2

Past performance is not a guarantee of future results. Indices are not available for direct investment. Index performance does not reflect the expenses associated with the management of an actual portfolio.
Market segment (index representation) as follows: US Stock Market (Russell 3000 Index), International Developed Stocks (MSCI World ex USA Index [net div.]), Emerging Markets (MSCI Emerging Markets Index [net div.]),
Global Real Estate (S&P Global REIT Index [net div.]), US Bond Market (Bloomberg Barclays US Aggregate Bond Index), and Global Bond Market ex US (Bloomberg Barclays Global Aggregate ex-USD Bond Index [hedged to
USD]). S&P data © 2021 S&P Dow Jones Indices LLC, a division of S&P Global. All rights reserved. Frank Russell Company is the source and owner of the trademarks, service marks, and copyrights related to the Russell
Indexes. MSCI data © MSCI 2021, all rights reserved. Bloomberg Barclays data provided by Bloomberg.                                                                                                                       2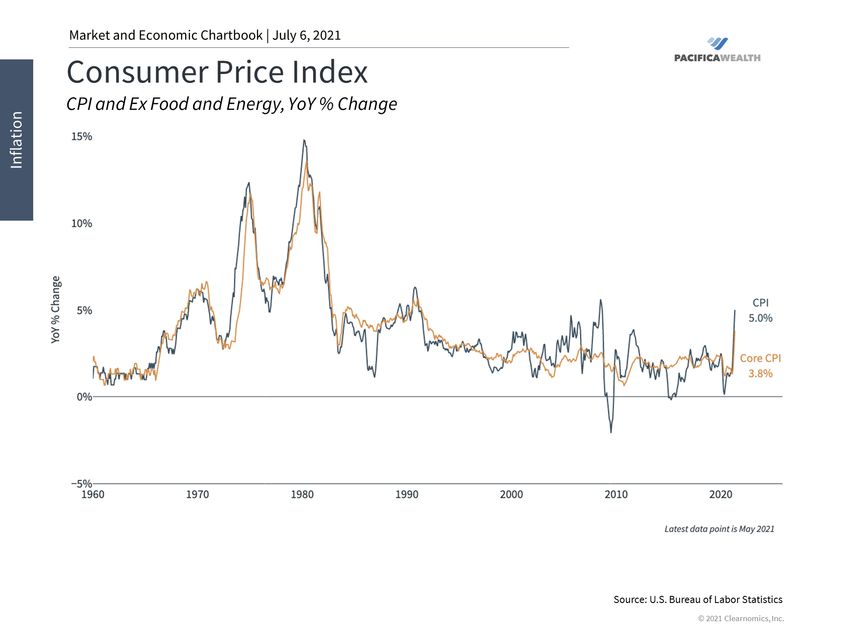
World Stock Market Performance
MSCI All Country World Index with selected headlines from Q2 2021

 400

 350

 300

 250

 200
   Mar 31                                                                      Apr 30                                                                       May 31                                                                  Jun 30

                                                                                                                                                      “Oil Price Hits               “US Inflation Is
                                                                                    “US Pipeline Cyberattack                                                                                                   “US Existing-Home
                                                                                                                                                       Two-Year High                 Highest in 13
                                                                                     Forces Closure”                                                                                                            Prices Hit Record
                “China Creates its Own                                                                                                                 as OPEC Sees                  Years as Prices
                                                                                                                                                                                                                High in May”
                 Digital Currency, a First                                                                                                             More Demand”                  Surge 5%”
                 for Major Economy”
                                                                    “Nasdaq Composite                                   “Bitcoin Falls as Much as                                                         “Supreme Court
                                                                     Sets First Record                                   30% as Investors Sour                                                             Leaves Affordable
                                                                     Since February”                                     on Cryptocurrencies”                                                              Care Act Intact”
                             “US Puts Fresh Sanctions                                                                                                                        “Japan’s Economy
“US Added 916,000             on Russia Over Hacking,                                                                                                                         Shrank an Annualized                         “Stock Markets
 Jobs in March as             Election Interference”                                                                                                                          3.9% in 1st Quarter”
                                                                                              “CDC: Fully Vaccinated People Can                                                                                             Cruise to
 Hiring Accelerated”                                                                           Stop Wearing Face Masks, End                                                                                                 Records in
                                                  “Corporate Bond Gauge                        Physical Distancing in Most Settings”                                                                                        First Half”
                                                   Signals Dwindling                                                                                      “G-7 Nations Agree on                    “Fed Pencils In
                                                   Economic Risk”                                                                                          New Rules for Taxing                     Earlier Interest-
                                                                                                                                                           Global Companies”                        Rate Increase”

These headlines are not offered to explain market returns. Instead, they serve as a reminder that investors should view daily events from a long-term perspective and avoid making
investment decisions based solely on the news.

Graph Source: MSCI ACWI Index [net div.]. MSCI data © MSCI 2021, all rights reserved.
It is not possible to invest directly in an index. Performance does not reflect the expenses associated with management of an actual portfolio. Past performance is not a guarantee of future results.                                       3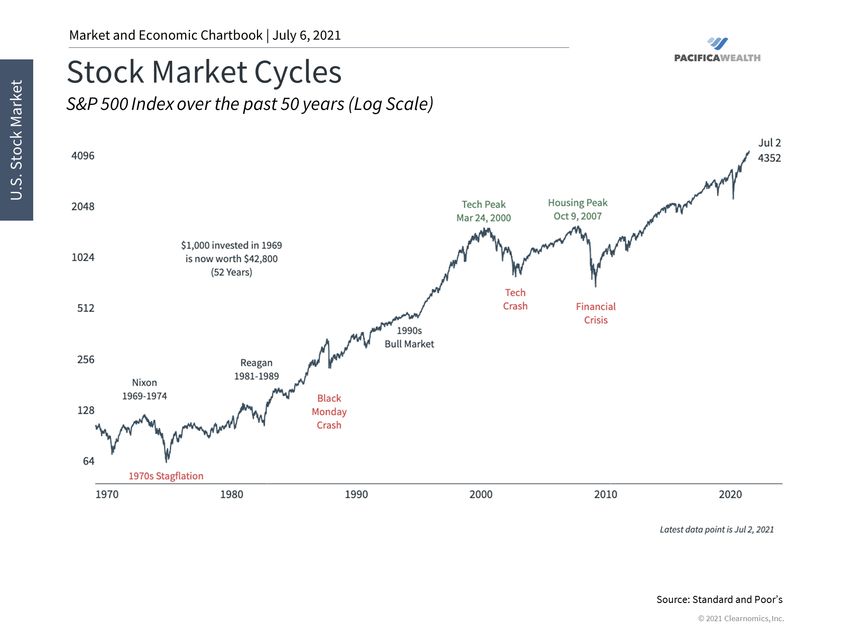
World Stock Market Performance
MSCI All Country World Index with selected headlines from past 12 months
LONG TERM (2000–Q2 2021)
400
300
SHORT TERM (Q2 2020–Q2 2021) 200
Last 12
100
months
400 0
2000 2005 2010 2015 2020
350
300
250
200
Jun 30 Sep 30 Dec 31 Mar 31 Jun 30
“Dow Closes “G-7 Nations
Above 33000 Agree on New
“Dow Eclipses “Stock
“Consumer “US Debt Hits “Biden Takes Office for First Time” “US Added Rules for
30000 for Markets
Spending Postwar Record” as 46th President” 916,000 Jobs in Taxing Global
First Time” Cruise to
Rose 5.6% March as Hiring Companies”
“Small Stocks Widen Records
in June” Accelerated”
“Fed Eases Inflation “US Stocks Notch Their Lead; Russell “US Inflation Is in First
Target in Landmark Records in Final 2000 Up 15% This Year” Highest in 13 Half”
Decision” Trading Day of 2020” Years as Prices
“Bitcoin Trades Above Surge 5%”
“UK GDP, Down 4-6% Year on Year, “Joe Biden’s Victory $50,000 for First Time” “US Existing-
“CDC: Fully Vaccinated People Can
Biggest Fall in Advanced Economies” Affirmed by Electoral Home Prices
“Yield on 30-year Treasury Hits 2% Stop Wearing Face Masks, End
College” Hit Record
for First Time Since Pandemic” Physical Distancing in Most Settings”
High in May”
These headlines are not offered to explain market returns. Instead, they serve as a reminder that investors should view daily events from a long-term perspective and avoid making
investment decisions based solely on the news.
Graph Source: MSCI ACWI Index [net div.]. MSCI data © MSCI 2021, all rights reserved.
It is not possible to invest directly in an index. Performance does not reflect the expenses associated with management of an actual portfolio. Past performance is not a guarantee of future results. 4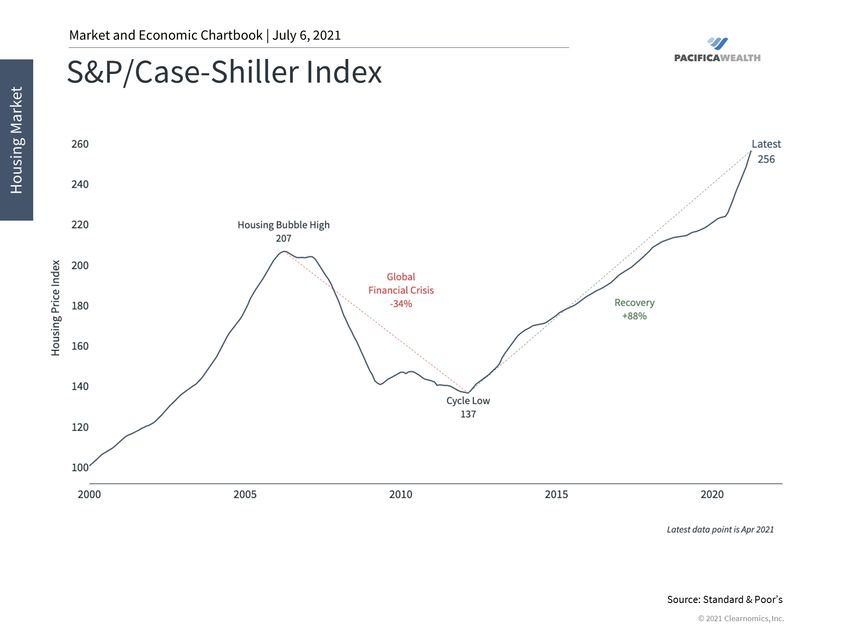
US Stocks
Second Quarter 2021 Index Returns

The US equity market posted positive returns for the quarter                                              Ranked Returns (%)
and outperformed non-US developed markets and emerging
markets.
                                                                                                               Large Growth                                                                                        11.93
Value underperformed growth in large cap stocks but
                                                                                                                   Large Cap                                                                 8.54
outperformed growth in small cap stocks.
                                                                                                                 Marketwide                                                                8.24
Small caps underperformed large caps.
                                                                                                                 Large Value                                            5.21
REIT indices outperformed equity market indices.
                                                                                                                 Small Value                                       4.56

                                                                                                                   Small Cap                                     4.29

                                                                                                               Small Growth                                   3.92

World Market Capitalization—US                                                                             Period Returns (%)                                                                                     * Annualized

                                                                                                              Asset Class                        YTD            1 Year           3 Years**          5 Years** 10 Years**
                                                                                                              Large Growth                     12.99             42.50              25.14             23.66              17.87
                                                                                                              Large Cap                        14.95             43.07              19.16             17.99              14.90
                                                                                                              Marketwide                       15.11             44.16              18.73             17.89              14.70

                                               58%
                                               US Market
                                                                                                              Large Value
                                                                                                              Small Value
                                                                                                                                               17.05
                                                                                                                                               26.69
                                                                                                                                                                 43.68
                                                                                                                                                                 73.28
                                                                                                                                                                                    12.42
                                                                                                                                                                                    10.27
                                                                                                                                                                                                      11.87
                                                                                                                                                                                                      13.62
                                                                                                                                                                                                                         11.61
                                                                                                                                                                                                                         10.85
                                               $44.2 trillion                                                 Small Cap                        17.54             62.03              13.52             16.47              12.34
                                                                                                              Small Growth                       8.98            51.36              15.94             18.76              13.52

Past performance is not a guarantee of future results. Indices are not available for direct investment. Index performance does not reflect the expenses associated with the management of an actual portfolio.
Market segment (index representation) as follows: Marketwide (Russell 3000 Index), Large Cap (Russell 1000 Index), Large Cap Value (Russell 1000 Value Index), Large Cap Growth (Russell 1000 Growth Index), Small Cap
(Russell 2000 Index), Small Cap Value (Russell 2000 Value Index), and Small Cap Growth (Russell 2000 Growth Index). World Market Cap represented by Russell 3000 Index, MSCI World ex USA IMI Index, and MSCI
Emerging Markets IMI Index. Russell 3000 Index is used as the proxy for the US market. Dow Jones US Select REIT Index used as proxy for the US REIT market. Frank Russell Company is the source and owner of the
trademarks, service marks, and copyrights related to the Russell Indexes. MSCI data © MSCI 2021, all rights reserved.                                                                                                            5
International Developed Stocks
Second Quarter 2021 Index Returns

Developed markets outside the US posted positive returns for                                                 Ranked Returns (%)                                                               Local currency           US currency
the quarter, underperforming US equities but outperforming
emerging markets.
                                                                                                                                                                                                          7.07
                                                                                                                   Growth
Value underperformed growth.                                                                                                                                                                                   7.65

Small caps underperformed large caps.                                                                                                                                                 5.15
                                                                                                               Large Cap
                                                                                                                                                                                           5.65

                                                                                                                                                                              4.41
                                                                                                               Small Cap
                                                                                                                                                                                   4.81

                                                                                                                                                                   3.29
                                                                                                                     Value
                                                                                                                                                                       3.71

World Market Capitalization—International Developed                                                           Period Returns (%)                                                                                     * Annualized

                                                                                                                 Asset Class                   YTD             1 Year              3 Years*            5 Years*          10 Years*
                                                                                                                 Value                       12.35               35.85                4.22                8.07                 3.87

     29%
     International
                                                                                                                 Large Cap
                                                                                                                 Small Cap
                                                                                                                                               9.92
                                                                                                                                               9.92
                                                                                                                                                                 33.60
                                                                                                                                                                 42.28
                                                                                                                                                                                      8.57
                                                                                                                                                                                      8.92
                                                                                                                                                                                                        10.36
                                                                                                                                                                                                        11.88
                                                                                                                                                                                                                               5.70
                                                                                                                                                                                                                               7.66
                                                                                                                 Growth                        7.26              31.08               12.56              12.35                  7.35
     Developed Market
     $22.3 trillion

Past performance is not a guarantee of future results. Indices are not available for direct investment. Index performance does not reflect the expenses associated with the management of an actual portfolio.
Market segment (index representation) as follows: Large Cap (MSCI World ex USA Index), Small Cap (MSCI World ex USA Small Cap Index), Value (MSCI World ex USA Value Index), and Growth (MSCI World ex USA
Growth Index). All index returns are net of withholding tax on dividends. World Market Cap represented by Russell 3000 Index, MSCI World ex USA IMI Index, and MSCI Emerging Markets IMI Index. MSCI World ex USA IMI
Index is used as the proxy for the International Developed market. MSCI data © MSCI 2021, all rights reserved. Frank Russell Company is the source and owner of the trademarks, service marks, and copyrights related to the
Russell Indexes.                                                                                                                                                                                                                      6
Real Estate Investment Trusts (REITs)
Second Quarter 2021 Index Returns
US real estate investment trusts outperformed non-US REITs Ranked Returns (%)
during the quarter.
US REITS 11.76
Global ex US REITS 7.29
Total Value of REIT Stocks Period Returns (%) * Annualized
Asset Class YTD 1 Year 3 Years** 5 Years** 10 Years**
US REITS 22.94 39.98 8.13 5.16 8.67
37% 63% Global ex US REITS 9.68 31.93 4.63 4.11 5.00
US
World ex US
$950 billion
$560 billion
115 REITs
278 REITs
(25 other
countries)
Past performance is not a guarantee of future results. Indices are not available for direct investment. Index performance does not reflect the expenses associated with the management of an actual portfolio.
Number of REIT stocks and total value based on the two indices. All index returns are net of withholding tax on dividends. Total value of REIT stocks represented by Dow Jones US Select REIT Index and the S&P Global ex US
REIT Index. Dow Jones US Select REIT Index used as proxy for the US market, and S&P Global ex US REIT Index used as proxy for the World ex US market. Dow Jones and S&P data © 2021 S&P Dow Jones Indices LLC, a
division of S&P Global. All rights reserved. 7• As this chart shows (log scale), the stock market has performed well over the past 50 years despite short-term ups
and downs.
• These periods of turbulence were due to economic, political and global turmoil during those decades.
• This emphasizes the importance of staying invested, rather than focusing on days or months, especially as
volatility rises.• The S&P/Case-Shiller index is an important measure of national housing prices. This chart uses the 20-city index. • Home prices continue to rise to record levels as many seek new homes. • Historically low interest rates and a strong economy should continue to support the housing market.
• CPI is a commonly cited measure of inflation. It uses a basket of goods and services to track price changes for
consumers.
• In order to measure the underlying trend in inflation, rather than temporary shocks to food and energy,
economists often focus on Core CPI.
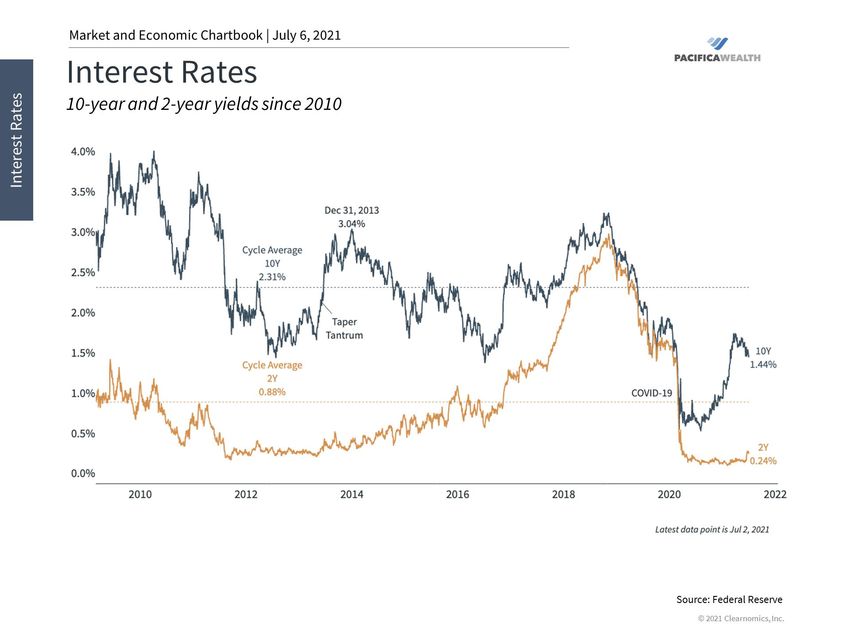
• Inflation has begun to heat up as the economy reaches new historic peaks.• Many interest rates have risen this year as the recovery continues and inflation fears grow. • The 10-year Treasury yield has jumped since the start of the year and many expect it could continue to increase. • Rising long-term interest rates are often a sign of the early phases of a business cycle.
•   This chart shows the year-over-year percent change in an index of leading economic indicators.
•   This indicator usually turns negative several months before a recession. This also happened prior to the current
    crisis.
•   This pattern is also evident over the prior seven recessions and is the result of the economic cycle.
• This chart shows total returns of the stock market (bars) and the largest intra-year decline (dots) each year.
• The average year sees a significant intra-year drop. However, most years still end in positive territory, especially
with dividends.
• Volatility in prices is a normal part of investing. It is important to not forget that investments also generate income.Important Information This presentation is solely for informational purposes. Past performance is no guarantee of future returns. Investing involves risk and possible loss of principal capital. No advice may be rendered by Pacifica Wealth Advisors, Inc. unless a client service agreement is in place. Please contact us at your earliest convenience with any questions regarding the content of this presentation and how it may be the right strategy for you. Pacifica Wealth Advisors, Inc. is a Registered Investment Adviser. Advisory services are only offered to clients or prospective clients where Pacifica Wealth Advisors, Inc. and its representatives are properly licensed or exempt from licensure. This report is solely for informational purposes. Past performance is no guarantee of future returns. Investing involves risk and possible loss of principal capital. No advice may be rendered by Pacifica Wealth Advisors, Inc. unless a client service agreement is in place. This report presents past performance, which does not guarantee future results. The investment return and principal value will fluctuate thus an investor's shares, when redeemed, may be worth more or less than their original cost. Current performance may be higher or lower than return data quoted herein. Different types of investments involve varying degrees of risk, and there can be no assurance that the future performance of any specific investment, investment strategy, or product made reference to directly or indirectly in this newsletter (article), will be profitable, equal any corresponding indicated historical performance level(s), or be suitable for your portfolio. Due to various factors, including changing market conditions, the content may no longer be reflective of current opinions or positions. Moreover, you should not assume that any discussion or information contained in this report serves as the receipt of, or as a substitute for, personalized investment advice from Pacifica Wealth Advisors, Inc. Neither asset allocation nor diversification guarantee a profit or protect against a loss in a declining market. They are methods used to help manage investment risk. Historical performance results for investment indices and/or categories have been provided for general comparison purposes only, and generally do not reflect the deduction of transaction and/or custodial charges, the deduction of an investment management fee, nor the impact of taxes, the incurrence of which would have the effect of decreasing historical performance results. It should not be assumed that your account holdings do or will correspond directly to any comparative indices. Please remember to contact Pacifica Wealth Advisors, Inc. if there are any changes in your personal/financial situation or investment objectives for the purpose of reviewing/evaluating/revising our previous recommendations and/or services. A copy of our current written disclosure statement discussing our advisory services and fees continues to remain available for your review upon request.
You can also read