Quantifying the non-linear dependence of energetic electron fluxes in the Earth's radiation belts with radial diffusion drivers
←
→
Page content transcription
If your browser does not render page correctly, please read the page content below
Ann. Geophys., 40, 37–53, 2022
https://doi.org/10.5194/angeo-40-37-2022
© Author(s) 2022. This work is distributed under
the Creative Commons Attribution 4.0 License.

Quantifying the non-linear dependence of energetic electron fluxes
in the Earth’s radiation belts with radial diffusion drivers
Adnane Osmane1 , Mikko Savola1 , Emilia Kilpua1 , Hannu Koskinen1 , Joseph E. Borovsky2 , and Milla Kalliokoski1
1 Department   of Physics, University of Helsinki, Helsinki, Finland
2 Space   Science Institute, Boulder, CO 80301, USA

Correspondence: Adnane Osmane (adnane.osmane@helsinki.fi)

Received: 2 August 2021 – Discussion started: 4 August 2021
Revised: 23 November 2021 – Accepted: 24 November 2021 – Published: 25 January 2022

Abstract. In this study, we use mutual information to charac-       1   Introduction
terise statistical dependencies of seed and relativistic electron
fluxes in the Earth’s radiation belts on ultra-low-frequency        The Earth’s radiation belts are non-linearly driven and
(ULF) wave power measured on the ground and at geosta-              weakly collisional plasma environments in which deposited
tionary orbit. The benefit of mutual information, in com-           energy and momentum leads to the energisation of electrons
parison to measures such as the Pearson correlation, lies in        to relativistic energies (Van Allen et al., 1958; Walt, 2005).
the capacity to distinguish non-linear dependencies from lin-       From a fundamental physics perspective, the acceleration of
ear ones. After reviewing the property of mutual information        charged particles to supra-thermal energies is ubiquitous to
and its relationship with the Pearson correlation for Gaus-         astrophysical plasma environments. As the closest astrophys-
sian bivariates, we present a methodology to quantify and           ical accelerator of particles to the Earth, the radiation belts
distinguish linear and non-linear statistical dependencies that     are amenable to detailed in situ measurements of electromag-
can be generalised to a wide range of solar wind drivers and        netic fields’ distribution functions. Their studies are therefore
magnetospheric responses. We present an application of the          relevant to other astrophysical environments with compara-
methodology by revisiting the case events studied by Ros-           ble thermodynamical properties in which particles are con-
toker et al. (1998). Our results corroborate the conclusions of     fined by large-scale inhomogeneous magnetic fields (Kul-
Rostoker et al. (1998) that ULF wave power and relativistic         srud, 2005). From an applied perspective, a wide range of
electron fluxes are statistically dependent upon one another.       satellites’ orbits overlap with the Earth’s radiation belts, with
We also estimate that the Pearson correlation is missing be-        the undesirable consequence that the energetic particles can
tween 20 % and 30 % of the statistical dependency between           damage the onboard electronics and shorten the lifespan of
ULF wave power and relativistic electron fluxes. Thus, the          communication systems (Baker et al., 2018). Thus, the main
Pearson correlation underestimates the impact of ULF waves          focus of Earth’s radiation belts’ studies is to quantify the pro-
on energetic electron fluxes. However, we find that observed        cesses scaling from electron kinetic scales to planetary scales
enhancements in relativistic electron fluxes correlate mod-         that enhance and deplete the plasma (Ukhorskiy and Sitnov,
estly, both linearly and non-linearly, with the ULF power           2012; Thorne et al., 2013; Lejosne and Kollmann, 2020).
spectrum when compared with values found in previous stud-             It has been known for several decades that the Earth’s ra-
ies (Simms et al., 2014) and with correlational values found        diation belts were driven far from thermodynamical equilib-
between seed electrons and ULF wave power for the same              rium as a result of variable solar wind conditions (McCor-
case events. Our results are indicative of the importance of        mac, 1965). This departure from thermodynamical equilib-
incorporating data analysis tools that can quantify linear and      rium results in kinetic distribution functions that are unsta-
non-linear interdependencies of various solar wind drivers.         ble and the production of fluctuations that can thermalise
                                                                    the plasma and accelerate particles. A growing number of
                                                                    in situ measurements and observational studies in the last 2
                                                                    decades have demonstrated that the Earth’s radiation belts’

Published by Copernicus Publications on behalf of the European Geosciences Union.
38                                                   A. Osmane et al.: ULF wave power and electron statistical dependence

response to solar wind driving and fluctuations can also be        theoretic measures to quantify the dependence of relativistic
non-linear and that non-linearity ought to be accounted for in     electron fluxes measured on geostationary orbits to a wide
order to improve prediction capabilities (Wing et al., 2016;       range of solar wind drivers. In their study, Wing et al. (2016)
Simms et al., 2018). From a theoretical perspective, every         demonstrate that the solar wind speed is the main driver and
self-consistent set of equations describing fluid- and kinetic-    that the effect of the solar wind density, sometimes sug-
scale plasma physics is inherently non-linear. The depar-          gested as a dominant driver for relativistic electron fluxes
ture of linearity in a dynamically evolving plasma trans-          (Balikhin et al., 2011), holds 30 % lesser information con-
lates into the appearance, and therefore measurements, of          tent and operates on a different timescale. The main depar-
non-Gaussian fluctuations (Papoulis and Pillai, 2002). Even        ture between the work presented hereafter and the study of
if a non-linear system is initialised with Gaussian fluctua-       Wing et al. (2016) lies in our introduction of a quantity called
tions, non-Gaussian fluctuations would eventually emerge.          information-adjusted correlation and the use of a dataset that
It is therefore not surprising that non-Gaussian fluctuations      has a 1 h resolution of geostationary-measured seed and rela-
are commonly found across a wide range of astrophysical            tivistic electron fluxes. The information-adjusted correlation
plasma environments (Dudok de Wit and Krasnosel’skikh,             is defined as the correlation value that would be obtained
1996; Marsch and Tu, 1997; Stepanova et al., 2003; Osman           from the mutual information under the assumption that the
et al., 2014; Osmane et al., 2015b). Taking into account the       dependence between the two variables can be represented
above theoretical constraints and observational results, one       as a Gaussian bivariate. The choice of a Gaussian bivariate
quickly recognises that in order to quantify non-linearity in      to distinguish linear and non-linear dependences as hinted
the Earth’s radiation belts, one has to use measures that can      above stems from the fact that non-linear equations produce
be sensitive to non-linear dependencies and are capable of         non-Gaussian statistics, even in the instance where a system
distinguishing them from linear ones.                              is initialised with Gaussian-distributed random variables (Pa-
   In this study, we present an application of information the-    poulis and Pillai, 2002). We therefore present a methodology
ory to the search of dependencies between energetic electron       that allows us to provide clear answers to the following two
fluxes measured in the Earth’s radiation belts and ultra-low-      questions:
frequency (ULF) wave power measured both at geostation-
ary orbit and on the ground. Unlike more commonly used                 1. Are the events studied by Rostoker et al. (1998) ev-
measures like the Pearson correlation, information-theoretic              idence of statistical dependence between ULF wave
tools, such as mutual information, have the benefit to dis-               power and electron fluxes?
tinguish non-linear dependencies from linear ones. In order
                                                                       2. Are non-linearities present in the instance where the de-
to demonstrate the value in the use of information-theoretic
                                                                          pendence between ULF wave power and electron fluxes
methods, we revisit the highly cited case studies of Rostoker
                                                                          is statistically significant?
et al. (1998). In their study, it was suggested that ULF pul-
sations can provide energy for acceleration of electrons to           Our report is presented as follows. Section 2 presents a
relativistic energies based on visual inspection of relativistic   brief summary of the tools of information theory used for
electron fluxes at geostationary orbit and ground ULF wave         the analysis. We put a particular emphasis on the application
power. It should be stressed that Rostoker et al. (1998) con-      of mutual information to the case of Gaussian random vari-
clusions are cautiously stated and that a value for a corre-       ables of arbitrary correlation, which serves as a benchmark
lation or any other measure is not provided. Nonetheless, it       for linear dependencies. In Sect. 3 we describe the dataset
is not too uncommon to find citing authors describing their        used and the associated instruments’ specificities relevant to
results as compelling and evidence of strong correlation be-       our study. In Sect. 4, we present our results for geostationary-
tween ULF wave power and relativistic electron fluxes. The         measured seed and relativistic electron fluxes measured dur-
impact of ULF fluctuations in the enhancement and loss of          ing the events presented by Rostoker et al. (1998). In Sect. 5,
energetic electron fluxes also forms the basis of radial dif-      we interpret and compare our results in light of previous stud-
fusion formalisms and is, as of today, understood as one of        ies and then conclude with suggestions for future studies and
the two dominant transport mechanisms in planetary radia-          improvement of our methodologies for instances where sta-
tion belts (see Lejosne and Kollmann, 2020, and references         tistical dependencies are difficult to extract.
therein).
   The application of information-theoretic measures to
space plasma problems is not new, but it has recently shown        2    Methodology
its utility for a wide range of methodologies and problems
(see De Michelis et al., 2011; Wing et al., 2016; Runge            In this section we present a definition of mutual information
et al., 2018; Johnson et al., 2018; Wing et al., 2018; Osmane      in terms of the Shannon entropy and the specific mutual in-
et al., 2019; Wing and Johnson, 2019; Cameron et al., 2019,        formation of Gaussian bivariate random variables. The Gaus-
and references therein). Of particular relevance to our study,     sian bivariate case with arbitrary Pearson correlation ρ is
Wing et al. (2016) presented an application of information-        used as a toy model to benchmark the numerical estimate of

Ann. Geophys., 40, 37–53, 2022                                                        https://doi.org/10.5194/angeo-40-37-2022
A. Osmane et al.: ULF wave power and electron statistical dependence                                                               39

mutual information and to distinguish linear from non-linear             The mutual information is symmetric in X and Y and is a
statistical dependencies. A detailed description and deriva-          measure of the dependence between two random variables.
tion of mutual information for Gaussian bivariates is pro-            It is always non-negative and only equal to zero if X and
vided in the Appendix for the interested reader.                      Y are independent or equivalently if the joint distribution is
                                                                      the product of the marginals; i.e. p(x, y) = p(x)p(y). In our
2.1   Mutual information                                              analysis the variable we use (i.e. electron fluxes and ULF
                                                                      wave power) are continuous; however, the use of Eq. (2) re-
It is preferable to introduce mutual information by first defin-      quires binning and therefore discretisation. Thus, Eq. (2) has
ing the Shannon entropy H (X) for a discrete random variable          been used to compute an estimator of mutual information for
X (Cover, 1999). The Shannon entropy is a measure of the              the dataset described in Sect. 3.
uncertainty contained in a random variable. In communica-                Even though probability distribution functions of electro-
tion theory it is the number of bits on average required to           magnetic fields and particle velocity distributions in space
describe a message X ∈ X , in which X denotes the alphabet,           plasmas often depart from Gaussianity, it is useful to refer
or equivalently the discrete states that can be assigned for the      to the Gaussian bivariate case to develop an appreciation of
random variable X. Practically speaking, if Nadia wants to            mutual information for linear systems and as a benchmark
send a message to Jorge, the Shannon entropy is the average           to test numerical estimates. Conveniently, there is an exact
number of binary questions (e.g. yes or no) one ought to ask          analytical relationship between the Pearson correlation and
in order to accurately decode a message X written in terms            mutual information of a Gaussian bivariate in terms of the
of a given alphabet X . Mathematically, it is written in terms        Pearson correlation ρ:
of the probability mass function p(x) as
                                                                                  1
                                                                      I (x, y) = − log 1 − ρ 2 .                                  (3)
             X
H (X) = −        p(x) log p(x).                              (1)                  2
            x∈X
                                                                         The interested reader can find a definition of mutual in-
   The Shannon entropy is a positive definite quantity                formation for continuous random variables and the deriva-
H (X) ≥ 0 and is bounded by H (X) ≤ log(|X |) with equality           tion of Eq. (3) for Gaussian bivariates in the Appendix. Since
if and only if the random variable X is distributed uniformly         the mutual information is a measure of how much we know
over X . Since the entropy is a measure of uncertainty (or            from X given Y and vice versa, the non-linear relationship
equivalently knowledge), it is convenient to ask what hap-            between mutual information and the correlation is an indi-
pens to the amount of uncertainty if we are given additional          cation that the Pearson correlation should not be interpreted
information encoded in terms of Y ∈ Y. In other words, do             linearly. Indeed, the difference in information between ran-
we gain or lose information about the likelihood of event X           dom variables of 0.75 and 0.5 correlation is not of order
given Y ? Intuitively, one can assume that if X and Y are             50 % (0.75/0.5 − 1 = 0.5) but rather 187 %. Thus, two ran-
entirely independent, knowing one says nothing about the              dom variables with Pearson correlation of 0.75 carry a much
other1 . On the other hand, if X and Y are contingent to one          larger amount of information upon one another than one with
another, or share a causal relationship, it can then be shown         correlation of 0.5. An additional constraint with the Pear-
that conditioning effectively reduces entropy and therefore           son correlation resides with fat-tailed random variables. For
uncertainty. In the instance where X and Y are independent,           Gaussian bivariates, independence is synonymous with be-
the conditional entropy H (X|Y ), which should be read as the         ing uncorrelated. However, for fat-tailed random variables,
entropy of X given Y , reduces to H (X). On the other hand,           as commonly measured in space and astrophysical plasmas,
if X and Y are statistically dependent, the entropy will be           strongly dependent random variables can have zero correla-
reduced, with H (X|Y ) < H (X). For two random variables              tion (Taleb, 2020). Unlike the Pearson correlation, mutual
X and Y , this reduction in uncertainty is quantified by the          information is able to quantify the dependence of random
mutual information:                                                   variables in the absence of correlation. As a simple example
                                                                      the reader can test for themself, consider two random vari-
I (X, Y ) = H (X) − H (X|Y )                                          ables X and Z. X ∼ N (0, 1) is a Gaussian random variable

            XX                     p(x, y)                            with zero mean and a standard deviation of 1. Z is the square
          =         p(x, y) log              .                 (2)
                                  p(x)p(y)                            of X; i.e. Z = X 2 . Thus the relationship between Z and X is
            x∈X y∈Y
                                                                      non-linear, and there is no doubt that Z and X are statistically
    1 If X and Y are not dependent on one another, we have not        dependent on one another. However, computing the Pearson
lost information. But if a variable X (e.g. ULF wave power) and       correlation is inconclusive as it gives a value of zero, whereas
Y (MeV electron fluxes) are dependent on one another under some       mutual information computed with the code described below
conditions (e.g. large solar wind speed), the removal of the condi-   indicates a large statistical dependence with a value of 1.42.
tions upon which the dependence is strong can result in a loss of
information (reduction of mutual information) and thus a loss of
knowledge.

https://doi.org/10.5194/angeo-40-37-2022                                                          Ann. Geophys., 40, 37–53, 2022
40                                                        A. Osmane et al.: ULF wave power and electron statistical dependence

                                                                        apply a shuffle test to the two time series and compute the
                                                                        average value of mutual information and its standard devia-
                                                                        tion for 100 shuffles. We find that the error computed with
                                                                        the shuffling procedure is Gaussian-distributed, and we in-
                                                                        terpret the average mutual information obtained from shuf-
                                                                        fling as the zero baseline level. This baseline for each events
                                                                        is plotted as a bold orange line in Figs. 4–11 for panels (a)
                                                                        and (c). The shaded orange area represents the 3 standard
                                                                        deviation range from the mean. Estimates of mutual infor-
                                                                        mation for electron fluxes and ULF wave power above the
                                                                        shaded area are therefore interpreted as significant with ± 3
                                                                        standard deviation. More sophisticated methods to compute
                                                                        mutual information through non-parametric methodologies
                                                                        are possible (Kraskov et al., 2004), but for our dataset, the
                                                                        statistical dependence between variables and the number of
                                                                        points is sufficient for us to answer the questions stated in the
Figure 1. Mutual information estimator for bivariate Gaussian ran-      Introduction.
dom variables with σx = σy = 1 and zero mean as a function of the
correlation ρ ∈ [−1, 1]. The numerical value is traced in red and the
analytical in blue. The estimator is computed for N = 105 points        3     Dataset
and 46 (' N 1/3 ) bins according to the Freedman–Diaconis rule.
                                                                        The data used in this study correspond to the two events anal-
                                                                        ysed by Rostoker et al. (1998). The first period extends from
2.2   Numerical computation of mutual information                       2 to 31 May 1994 (91 d in total), and the second one spans
                                                                        from 1 to 26 November 1993. During the first period a big ge-
The procedure we follow to compute the mutual informa-                  omagnetic storm occurred on 17 April with minimum Dst of
tion for two time series consists in binning the data accord-           −201 nT, and the period featured also several moderate and
ing to the Freedman–Diaconis rule (Freedman and Diaconis,               intense storms. During the second period an intense storm
1981). Thus, even though the electron fluxes and ULF wave               peaked on 4 November with minimum Dst −119 nT. Another
power are continuous, our procedure has the consequence to              significant storm during this latter period was a moderate
discretise the variables. This discretisation leads to biases in        storm on 18 November with minimum Dst −82 nT. Both pe-
the estimation of mutual information that are dependent on              riods were thus geomagnetically active. Our choice to revisit
the number of measurement points N and statistical depen-               the work of Rostoker et al. (1998) through mutual informa-
dence of the two variables. For instance, two Gaussian ran-             tion stems from the fact that such methodology has not been
dom variables with a high correlation would require fewer               used before and that their study, highly cited in the litera-
measurement points to estimate the mutual information than              ture as evidence that radial diffusion is a leading mechanism
two Gaussian random variables with a low correlation or                 for the energisation of relativistic electrons, can serve as a
two fat-tailed random variables with some arbitrary corre-              benchmark for more involved methodologies. Additionally,
lation. Using numerically produced Gaussian bivariates with             we have access to a comparable dataset with better resolu-
N points and the analytical relationship between mutual in-             tion (1 h resolution instead of 1 d), so we cannot only re-
formation and correlation in Eq. (3), one can therefore test            visit the results of Rostoker et al. (1998) with information
mutual information estimators and quantify the error due to             theory but find a more accurate time lag for the electron’s
binning.                                                                response to ULF wave power. In Rostoker et al. (1998) the
   In Fig. 1 we plotted the numerical estimate and analyti-             Pc5 ULF measurements were from the Gillam measurement
cal solution for 106 points extracted from Gaussian bivari-             station of the Canadian Auroral Network for the OPEN Pro-
ates with correlations ranging between −1 and 1. Figure 1               gram Unified Study Project (CANOPUS), and the electron
is provided to show the correspondence between the Pearson              fluxes (> 2 MeV) were from Geostationary Operational En-
correlation and mutual information and give an estimate of              vironmental Satellite 7 (GOES 7). The GOES data are the
what values of mutual information are considered large. Fig-            daily average flux, and the ULF data are the average over a
ure 1 shows that values greater than 0.5 are considered large.          6 h period from dawn to noon.
   Comparing the theoretical and numerical value of mutual
information in Fig. 1, we note that our estimator does well for         3.1    ULF power spectrum
low correlation values, though it gains a discrepancy as large
as 10 % for correlation absolute values greater than 0.5. In            The ULF data used in this analysis were from National Aero-
order to estimate the error introduced by discretisation, we            nautics and Space Administration’s (NASA) Virtual Radia-

Ann. Geophys., 40, 37–53, 2022                                                            https://doi.org/10.5194/angeo-40-37-2022
A. Osmane et al.: ULF wave power and electron statistical dependence                                                                   41

Figure 2. (a) The 24 h average of relativistic electron flux index Fe1.2 and geosynchronous ULF index Sgeo for the 1994 event from the
Rostoker et al. (1998) study. (b) Same as for panel (a) but with ground ULF index Sgr for the 1994 event. We note that visually the ground
index Sgr follows the relativistic electron flux index more closely for the duration of the event.

Figure 3. (a) The 24 h average of relativistic electron flux index Fe1.2 and geosynchronous ULF index Sgeo for the 1993 event from the
Rostoker et al. (1998) study. (b) Same as for panel (a) but with ground ULF index Sgr for the 1993 event.

tion Belt Observatory (ViRBO) and the ULF indices used,                stations in the Northern Hemisphere. The ULF measure-
Sgr and Sgeo, both describing ULF spectral power from                  ments from ground stations for any hour of universal time
which noise has been removed, are derived in Kozyreva et al.           have been done in the magnetic local time (MLT) sector from
(2007) The ULF data are for a Pc5 frequency range of 2–                3 to 18 h and between the CGM (corrected geomagnetic) lat-
10 mHz. The ULF indices used in this work are the logarithm            itudes 60 and 70◦ . For the ground index, omitting the stations
in base 10 of the signal spectral power. The signal spectral           outside the MLT sector from 5 to 15 h has little effect on the
power is the integral over the power spectral density above            measurement results, since the cross-correlation between the
the noise level (Kozyreva et al., 2007). The index values of           ULF measurements in the MLT interval of 3 to 1 h and those
signal spectral power are 1 h averages from measurements               that span the MLT interval 0 to 24 h is about 0.95 (Kozyreva
done in 1 min resolution by a global network of measuring              et al., 2007). It is interesting to compare both ground and
stations. The measurements of each station are averaged sep-           geostationary ULF activity since toroidal ULF waves with
arately, and the index value is the maximum of those hourly            small azimuthal mode number m waves can transmit to the
averages. The in situ geosynchronous index Sgeo has been               ground, whereas poloidal ULF waves with high azimuthal
calculated from the measurements of GOES spacecraft, and               mode number m are confined to the inner magnetosphere.
the ground ULF index Sgr is based on measurements from                 Azimuthal mode number affects the electron energies that

https://doi.org/10.5194/angeo-40-37-2022                                                             Ann. Geophys., 40, 37–53, 2022
42 A. Osmane et al.: ULF wave power and electron statistical dependence
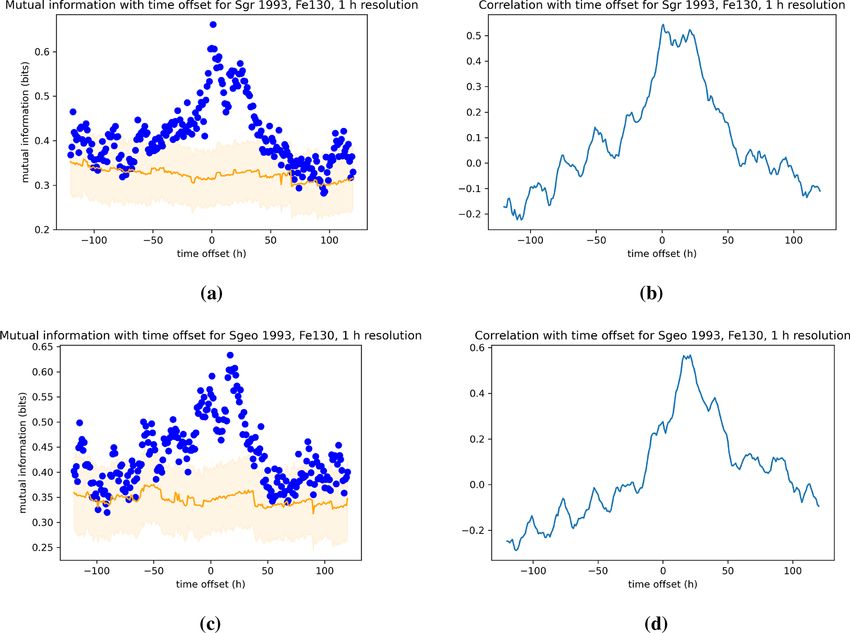
Figure 4. Dependence of the mutual information and Pearson correlation for ground (a, b) and geosynchronous (c, d) ULF power with the
relativistic electron index Fe1.2 for the 1994 event. The data for both indices are processed with 1 h resolution. See Sect. 4.1 for a description
of the figures.
can resonate with these waves, and a discrepancy in correla- ments done at a 10 s sampling rate2 . Fe130 is a measure of the
tional measures for ground and geostationary ULF measure- intensity of substorm-injected electrons in the dipolar mag-
ments can be indicative of certain wave mode dominance. netosphere: Fe130 rises rapidly at the onset of a magneto-
spheric substorm and subsequently decays over the timescale
of a few hours. Fe1.2 is a measure of the intensity of the outer
3.2 Seed and relativistic electron fluxes indices electron radiation belt: Fe1.2 grows slowly during very ac-
tive times and decays over the timescale of a few days during
In order to quantify the electron fluxes we use the in- quiet times. Fe1.2 can also exhibit sudden dropouts at the on-
dices Fe1.2 and Fe130 described in Borovsky and Yakymenko sets of geomagnetic storms.
(2017) for electrons with energies near 1.2 and 130 keV, re-
spectively. The indices are computed as the base 10 logarithm 2 The fluxes have been derived in Cayton and Belian (2007) by
of the maximum geostationary-measured electron fluxes by
converting them from count rates. The electron counts also con-
any of the SOPA instruments on board the Los Alamos tain incident protons, alpha particles, and gamma rays, which have
National Laboratory (LANL) spacecraft for a given energy been treated as additional electrons instead of being removed from
channel at the outer radiation belts. For every hour of uni- the raw data. Changes in processing the measurement data over the
versal time, the maximum of 6 min median values over all years may also have caused systematic errors in the measurement
satellites is recorded as the flux value during that hour. The data, but maybe only a few percent of the data records are contami-
median values for each satellite are calculated from measure- nated (Cayton and Belian, 2007).
Ann. Geophys., 40, 37–53, 2022 https://doi.org/10.5194/angeo-40-37-2022
A. Osmane et al.: ULF wave power and electron statistical dependence 43
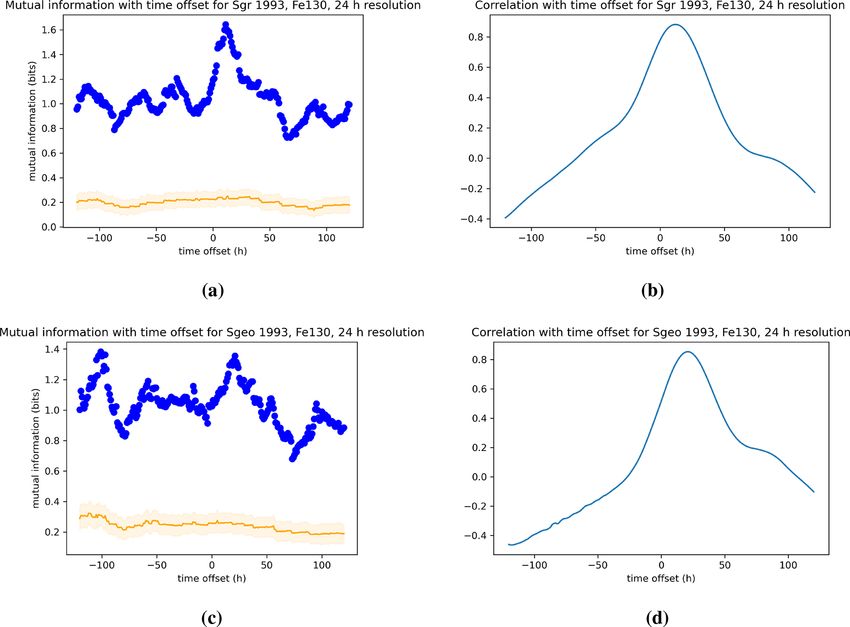
Figure 5. Same as in Fig. 4 but with a 24 h moving average of each indices.
4 Results consult Table 1 which contains a summary of our results. Ta-
ble 1 is extracted from the information found in Figs. 4–11,
Figures (2) and (3) show the 24 h average of relativistic elec- and while the shape of the statistical dependencies shown in
tron flux indices and ULF power indices as a function of Figs. 4–11 is similar, differences between the events are sig-
time for the two events studied by Rostoker et al. (1998). nificant.
In each figure the panel on the left has the geosynchronous
ULF index plotted, whereas the panel on the right has the 4.1 Event 1 for the electron index Fe1.2
ground ULF index plotted. We remind the reader that our
datasets have different time resolutions from those used by
Figure 4 shows the mutual information and correlation of the
Rostoker et al. (1998) with 24 h resolution, whereas we use
relativistic electron flux index Fe1.2 with ULF wave power
1 h resolution and 24 h moving averages. However, the vi-
as a function of time lag for Event 1 from 1 March to
sual comparison of Figs. 2 and 3 to Figs. 1 and 2 in Rostoker
31 May 1994 of Rostoker et al. (1998). The increment in
et al. (1998) shows that they are very similar 3 . In the fol-
time lag is of 1 h. A positive time lag indicates that changes
lowing we will look at each event separately and compare
in ULF wave power precede those in the electron flux, and
the values obtained for the mutual information and the Pear-
the opposite is true for a negative time lag. Panels (a) and
son correlation. The reader can also skip Sect. 4.1 to 4.4 and
(b) in each figure show the dependence on ULF ground in-
3 Reducing our resolution to 24 h for a strict comparison with dex Sgr , whereas panels (c) and (d) are for the dependence on
(Rostoker et al., 1998) is not useful because the values of mutual ULF geostationary index Sgeo . The orange line in the panels
information and correlation are low, and reducing the number of with mutual information represents the zero value on the ba-
points would bring both measures to the noise level. sis of the shuffling procedure described in the Methodology
https://doi.org/10.5194/angeo-40-37-2022 Ann. Geophys., 40, 37–53, 2022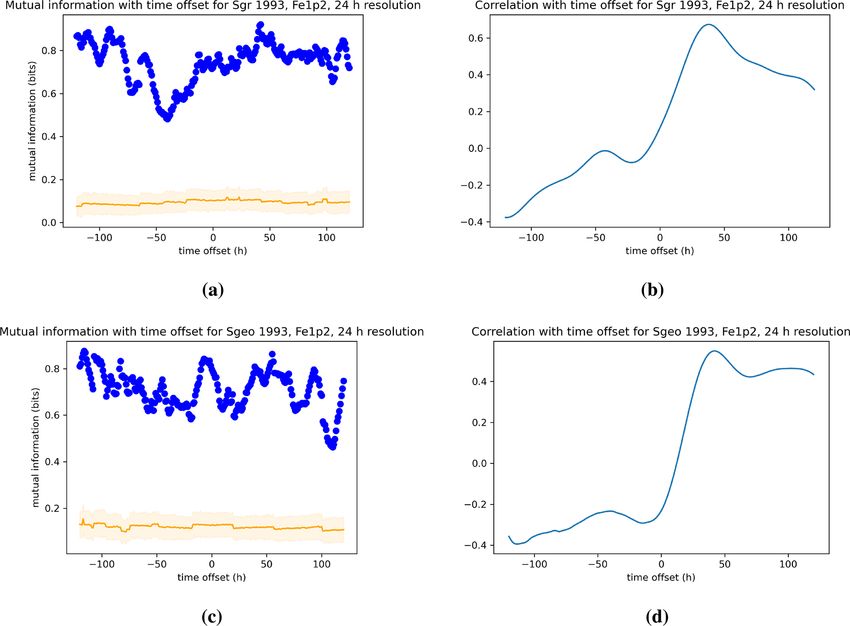
44 A. Osmane et al.: ULF wave power and electron statistical dependence
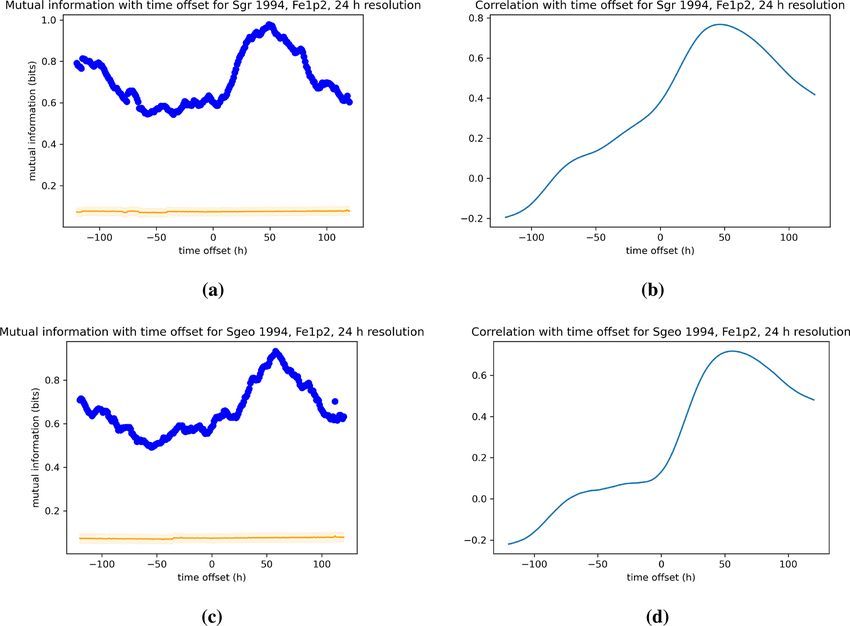
Table 1. Maximum values in correlation and mutual information for positive lags and associated adjusted correlation.
Event Flux index ULF index Pearson correlation Mutual information Adjusted correlation Lag (h)
1993 Fe130 Geo 0.57 ± 0.03 0.63 ± 0.04 0.76 ± 0.02 17
1993 Fe130 Ground 0.54 ± 0.03 0.66 ± 0.04 0.77 ± 0.01 1
1994 Fe130 Geo 0.55 ± 0.01 0.44 ± 0.02 0.68 ± 0.02 0
1994 Fe130 Ground 0.68 ± 0.01 0.67 ± 0.01 0.78 ± 0.01 0
1993 Fe1p2 Geo 0.41 ± 0.03 0.42 ± 0.04 0.66 ± 0.03 42
1993 Fe1p2 Ground 0.43 ± 0.03 0.36 ± 0.04 0.63 ± 0.04 50
1994 Fe1p2 Geo 0.52 ± 0.02 0.40 ± 0.02 0.65 ± 0.01 67
1994 Fe1p2 Ground 0.59 ± 0.02 0.49 ± 0.02 0.70 ± 0.01 48
Figure 6. Same as in Fig. 4 but for the 1993 event of Rostoker et al. (1998).
section. The shaded area overlapping the zero curve for mu- mutual information and correlation of electron fluxes with
tual information represents the 3 standard deviation spread. geostationary ULF power Sgeo show a prominent 24 h mod-
Thus a value above the shaded area represents a measurement ulation. As is typical for an index that measures magneto-
of mutual information that has at least 6σ significance. spheric quantities, Fe1.2 , Fe130 , Sgr , and Sgeo have 24 h pe-
We note that the peaks in mutual information and Pear- riodicities in them caused by dipole wobble and longitudi-
son correlation occur between 48 and 50 h time lag and have nal station coverage, etc. These 24 h periodicities show up
maximum values of Imax ' 0.5 and ρmax ' 0.55–0.6. The as 24 h peaks in their autocorrelation functions (see Fig. 2a
Ann. Geophys., 40, 37–53, 2022 https://doi.org/10.5194/angeo-40-37-2022
A. Osmane et al.: ULF wave power and electron statistical dependence                                                                   45

Figure 7. Same as in Fig. 5 but for the 1993 event of Rostoker et al. (1998).

of Borovsky and Yakymenko, 2017, for Fe1.2 and Fe130 ,                   term trends. The mutual information and correlation in Fig. 5
and see Fig. 4a and b of Borovsky and Denton, 2014, for                  have the same peaks and shape as in Fig. 4 for the 1 h resolu-
Sgr and Sgeo ). These 24 h periodicities will also show up               tion, but because of the averaging the modulation present in
in the cross-correlations between magnetospheric variables.              the high-resolution data is lost.
Another main difference between mutual information and
correlation in Figs. 4 and 5 is that mutual information con-             4.2    Event 2 for the electron index Fe1.2
sistently has very pronounced secondary peaks at time offset
around −100 h, whereas the secondary peaks in the Pearson                Figure 6 shows the mutual information and correlation of the
correlations appear to be less pronounced or less significant.           relativistic electron flux index with ULF wave power as a
In the Discussion section we show that the Pearson correla-              function of time lag for Event 2 from 2 to 26 November 1993
tion is missing out about 20 %–30 % of the statistical depen-            of Rostoker et al. (1998). Similarly to Fig. 4, indices are plot-
dence due to its inability to capture non-linearities and that           ted with a 1 h time lag increment. The panels (a) and (b)
differences in peaks between mutual information and Pear-                in each figure show the dependence on ULF ground index
son correlation might be at least partially explained by the             Sgr , whereas panels (c) and (d) are for the dependence on
inability of the latter to measure non-linear statistical depen-         ULF geostationary index Sgeo . We note that for Event 2 local
dencies.                                                                 peaks occurs for 24–48 h lag time, but both the mutual infor-
   Figure 5 looks at the same dependence as in Fig. 4 but                mation and Pearson correlation, for comparable resolution,
for a 24 h time moving average of the indices. Using a time              are significantly weaker than for Event 1 with Imax < 0.4
moving average introduces statistical dependence between                 ρmax < 0.5. Unlike for Event 1, Event 2 shows different de-
points less than 12 h lag apart but is useful to denote long-            pendence on the time lag between the mutual information

https://doi.org/10.5194/angeo-40-37-2022                                                              Ann. Geophys., 40, 37–53, 2022
46                                                  A. Osmane et al.: ULF wave power and electron statistical dependence

Figure 8. Dependence of the mutual information and Pearson correlation for ground (a, b) and geosynchronous (c, d) ULF power on the
130 keV electron index Fe130 for the 1994 event. The data for both indices are processed with 1 h resolution.

and correlation. This discrepancy between the two measures          function of time lag for Event 1 of Rostoker et al. (1998). The
could be indicative of time-dependent non-linearity of rela-        indices are once more plotted with a 1 h resolution and time
tivistic electron fluxes with ULF wave power.                       lag increment. The panels (a) and (b) in each figure show the
   Figure 7 looks at the same dependence as in Fig. 6 but           dependence on ULF ground index Sgr , whereas panels (c)
for a 24 h time moving average of the indices. A 24 h run-          and (d) are for the dependence on ULF geostationary index
ning average removes the 24 h periodicity in the indices and        Sgeo . We note that the time lag dependence of mutual infor-
hence removes the 24 h peaks in the cross-correlations. We          mation and correlation is comparable and that the peak in
note that the value of the mutual information is once again         both occurs for a lag of τ = 0. The peak in the mutual infor-
significantly enhanced since the averaging introduces statis-       mation between Sgr and Fe130 is Imax ' 0.68, which is signif-
tical dependencies between two points less than 12 h apart,         icantly greater than the mutual information between Sgr and
but we also notice that there is a different dependence than        Fe1.2 . On the other hand, the peak in the mutual information
for the Pearson correlation. These differences between the          between Sgeo and Fe130 is Imax ' 0.4, which is comparable to
two measures and their potential origin in non-linear phe-          the peak value we found for the mutual information between
nomena are discussed in the Discussion section.                     Sgeo and Fe1.2 . As observed in Fig. 4 we also note a modu-
                                                                    lation in the mutual information and correlation of electron
4.3   Event 1 for the electron index Fe130                          fluxes with geostationary ULF power Sgeo not present in the
                                                                    dependence on the ground power index Sgr . Figure 9 shows
Figure 8 shows the mutual information and correlation of
130 keV electron flux index Fe130 with ULF wave power as a

Ann. Geophys., 40, 37–53, 2022                                                       https://doi.org/10.5194/angeo-40-37-2022
A. Osmane et al.: ULF wave power and electron statistical dependence 47
Figure 9. Same as in Fig. 8 but with a 24 h moving average of each indices.
the same dependence as in Fig. 8 but for a 24 h time moving 5 Discussion
average of the indices.
We are now ready to answer the two questions stated in the
4.4 Event 2 for the electron index Fe130 Introduction. (1) Are the events studied by Rostoker et al.
(1998) examples of strong ULF wave power and energetic
Figure 10 has the same description as Fig. 8, but the mu- electron dependence? (2) Is the statistical dependence be-
tual information and Pearson correlation are computed for tween ULF wave power and electron fluxes non-linear? In
Event 2 of Rostoker et al. (1998). Similarly to Event 1, order to answer these two questions, we have tabulated the
Event 2 shows that the time lag dependence of mutual in- values of the maximum Pearson correlation and maximum
formation and correlation is comparable and that the peak in mutual information for all events in Table 1. The columns
both occurs around a lag of τ = 0 and values of Imax ' 0.6– denote, from the left to the right, the event year, the flux in-
0.68. Figure 11 looks at the same dependence as in Fig. 10 dex, the ULF index, the maximum Pearson correlation, the
but for a 24 h time moving average of the indices. A compar- maximum mutual information, the information-adjusted cor-
ison of Event 1 and Event 2 shows a similar time response relation, and the lag for the maximum mutual information,
and dependence of 130 keV electron flux index Fe130 with respectively. The information-adjusted correlation is defined
ULF wave power. as the correlation value that would be obtained from the mu-
tual information under the assumption that the dependence
between the two variables can be represented as a Gaussian
bivariate (cf. Eq. 3). The choice of a Gaussian bivariate to
distinguish linear and non-linear dependences stems from the
https://doi.org/10.5194/angeo-40-37-2022 Ann. Geophys., 40, 37–53, 202248 A. Osmane et al.: ULF wave power and electron statistical dependence
Figure 10. Same as in Fig. 8 but for the 1993 event of Rostoker et al. (1998).
fact that non-linear equations produce non-Gaussian statis- Are the events evidence of strong ULF wave power and
tics, even in the instance where a system is initialised with energetic electron dependence? For the two events studied,
Gaussian-distributed random variables (Papoulis and Pillai, the Pearson correlation and the mutual information are both
2002). Mathematically, the information-adjusted correlation statistically significant and well above the noise level. How-
can be defined by applying the inverse of Eq. (3): ever, the maximum correlation values for relativistic elec-
p trons range between 0.41 and 0.59, and the maximum mu-
ρadj = sign(ρ) 1 − 2−2I . (4) tual information values range between 0.36 and 0.49. For
comparisons, the analyses by Simms et al. (2014) from 219
The information-adjusted correlation ρadj allows us to deter- storms show values of correlation of 0.65 for ground ULF
mine whether the Pearson correlation has underestimated the and 0.50 for GOES ULF with relativistic electron fluxes.
dependence between the random variables due to the pres- Thus, the values for correlation of the 1993 event are showing
ence of non-linearity. The instance in which the adjusted cor- weaker linear and non-linear statistical dependence, whereas
relation is statistically comparable to the Pearson correlation the 1994 event has correlation values on par with events
denotes that a linear dependence between the fluxes and ULF found over 11 years of data (Simms et al., 2014). The
power dominates and that non-linear dependencies are either methodology of Simms et al. (2014) separates variables in
too weak or non-existent. In the opposite case, an adjusted terms of storm phases and defines a predictor variable, for
correlation larger than the Pearson correlation indicates that example, ULF wave power, as an average over an appropri-
non-linear dependencies between fluxes and ULF power are ate time period for a given storm phase. Since we are study-
statistically significant. ing case events, the statistical methodology of Simms et al.
Ann. Geophys., 40, 37–53, 2022 https://doi.org/10.5194/angeo-40-37-2022A. Osmane et al.: ULF wave power and electron statistical dependence 49 Figure 11. Same as in Fig. 9 but with a 24 h moving average. (2014) cannot be explicitly reproduced, but we find com- show strong correlation between ULF waves and relativistic parisons with our results useful in that it gives us a point electron fluxes, quantitatively the dependence is comparable of reference to judge the strength of the correlation values to other values found in the literature but nonetheless mod- we found. For another comparison, for all times during the est when compared with the correlation between ULF waves years 1995–2006, Borovsky (2017) found a Pearson correla- and seed electrons. tion coefficient of 0.34 between Fe1.2 and Sgr , whereas they Comparing between seed and relativistic electrons, the sta- found a higher correlation coefficient of 0.54 between Fe1.2 tistical dependence on ULF wave power of the 130 keV flux and the 123 h time integral of Sgr . Similarly, it was found is significantly larger than for relativistic fluxes and ranges that the correlation coefficient between Fe1.2 and Sgeo was between 0.54 and 0.68 for the maximum Pearson correla- 0.21, whereas the correlation coefficient was 0.25 between tion and 0.44 and 0.67 for the maximum mutual informa- Fe1.2 and the 138 h time integral of Sgeo . For all times during tion. We also note that the time lag for the maximum val- the years 1995–2004 Borovsky and Denton (2014) explored ues is comparable whether one uses the mutual information correlation coefficients between Sgr and Sgeo and a relativis- or the Pearson correlation. The 130 keV fluxes have a maxi- tic electron flux F that was calculated differently from Fe1.2 . mum dependence with time lags of less than a day, whereas They found correlations between F and Sgr of 0.36 (with a the relativistic electrons see a maximum for time lags con- time lag of 56 h) and between F and the 126 h time integral siderably longer between 42 and 67 h. Moreover, the ground of Sgr of 0.55. Likewise they found correlations between F ULF wave power gives a larger dependence than geostation- and Sgeo of 0.28 (with a time lag of 71 h) and between F ary measured ULF wave power for the 1994 event. For the and the 156 h time integral of Sgr of 0.32. Our results demon- 1993 event the statistical dependence is the same whether strate that even though the events appear, at least visually, to one uses ground or geostationary indices. The ground ULF https://doi.org/10.5194/angeo-40-37-2022 Ann. Geophys., 40, 37–53, 2022
50                                                    A. Osmane et al.: ULF wave power and electron statistical dependence

index spans local daylight hours between 05:00 and 15:00,           ones. In order to test our methodology, we revisited the case
whereas the GOES ULF covers the full 24 h period. This lo-          study of Rostoker et al. (1998), in which two events were
cal time difference between ground and geostationary sam-           shown, from a visual perspective, to indicate strong correla-
pling of wave power makes the latter more susceptible to be         tion between the rise of relativistic electron fluxes and ULF
influenced by substorm activity and the former by viscous           wave power. Our application of mutual information to the
processes and pressure pulses on the dayside magnetosphere          events presented by Rostoker et al. (1998) indicates that rel-
during moderate geomagnetic activity (Borovsky and Fun-             ativistic electron fluxes are linearly and non-linearly depen-
sten, 2003; Osmane et al., 2015a). However, and as pointed          dent on ULF wave power. However, the values that we found
out by Simms et al. (2014), the most notable difference be-         for both the Pearson correlation and mutual information of
tween ground and GOES data is that the ground magnetome-            relativistic electron fluxes and ULF wave power are modest
ters are better positioned to catch ULF wave activity that          when compared to previous statistical results (Simms et al.,
would result in radial diffusion transport (Lejosne and Koll-       2014) and consistently smaller than the correlational mea-
mann, 2020).                                                        sures found between seed electrons and ULF wave power.
   To address the second question, we compare the values of         This result is counter-intuitive since seed electrons with long
the information-adjusted correlation with the Pearson corre-        azimuthal periods cannot experience drift–orbit resonance
lation. We note that the adjusted correlation is significantly      with ULF wave fluctuations and should therefore not be cor-
larger than the Pearson correlation for all instances. In other     related with radial diffusion drivers more strongly than rela-
words, though constrained to two case studies, our results          tivistic electron fluxes. However, our results do not indicate
demonstrate the presence of non-linear statistical dependen-        a necessary causal physical relationship between seed elec-
cies between energetic electron fluxes and ULF wave power.          trons and ULF wave power, but they do point out the neces-
By using information theory we make no assumptions about            sity of not over-interpreting correlational measures, whether
the functional form of the non-linear dependence between            linear or non-linear. The modest dependence of energetic
the variables, but we can nonetheless state that non-linearities    electron fluxes with ULF wave power could also originate in
have to be accounted for. Our results are consistent with the       a shared dependence on solar wind drivers, such as the solar
study of Simms et al. (2018), in which they built regres-           wind speed for relativistic electrons and solar wind density
sion models that assumed a quadratic dependence in the ULF          for seed electrons. Our results are therefore indicative of the
wave power with a 1 d lag. Their results indicate that the re-      need to incorporate data analysis tools that can distinguish
sponse of relativistic electron fluxes can be a combination         between interdependencies of various solar wind drivers. In
of linear and non-linear dependence and that incorporating          the framework of information theory, conditional mutual in-
a quadratic term might provide better predictions. Based on         formation is specifically built for that purpose and has been
the values for the information-adjusted correlation, the Pear-      successfully used to resolve a long-standing question about
son correlation might be missing between 20 % and 30 % of           the relative role of solar wind speed and density in driving
the statistical dependencies between ULF wave power and             relativistic electron fluxes (Wing et al., 2016). In future stud-
relativistic electron fluxes.                                       ies, we will also apply a comparable methodology presented
                                                                    in Simms et al. (2014) to seek dependencies of relativistic
                                                                    electron fluxes on solar wind drivers for given storm phases
6    Conclusions                                                    and build non-parametric estimators for the probability den-
                                                                    sity of random variables that do not require binning (Kraskov
The Earth’s inner magnetosphere is a non-linearly driven            et al., 2004).
plasma environment in which electrons can be collec-
tively energised to relativistic energies by ULF fluctuations
(Lejosne and Kollmann, 2020). The emergence of non-linear           Appendix A: Mutual information for continuous
processes translates into non-Gaussian fluctuations in the          variables
electromagnetic fields and particle distribution functions.
                                                                    For a random variable X, if the cumulative distribution func-
Thus, in order to quantify the processes at play to model
                                                                    tion F (x) is continuous, then X is said to be continuous
the Earth’s radiation belts accurately, one needs to determine
                                                                    as well. Let us denote the probability distribution function
whether non-linear statistical dependencies between drivers,
                                                                    f (x) = dF (x)/dx. The differential entropy of a continuous
such as the solar wind speed and the ULF wave power, and
                                                                    random variable X is defined as
quantities in which energy and momentum is deposited, such                     Z
as electron fluxes, have to be accounted for.                       h(X) = − f (x) log f (x)dx,                              (A1)
   In this study, we described the use of mutual information
                                                                               S∈R
to characterise statistical dependencies of relativistic electron
fluxes on ULF wave power. The benefit of mutual informa-            where S is the support set where f (x) > 0. Differential en-
tion, in comparison to the Pearson correlation, lies in the         tropy h(X), as in the discrete case with the Shannon entropy
capacity to distinguish non-linear dependencies from linear         H , is also a measure of the uncertainty for a random variable

Ann. Geophys., 40, 37–53, 2022                                                        https://doi.org/10.5194/angeo-40-37-2022
A. Osmane et al.: ULF wave power and electron statistical dependence 51
X. However, unlike in the discrete case, the differential en- For the sake of simplicity we focus on the case where µx =
tropy can be negative. Consider, for instance, a random vari- µy = 0 and σx = σy = σ , in which case the joint bivariate
able distributed uniformly from 0 to L, so that its density is distribution takes the form
f (X) = 1/L. Then its differential entropy is
(1 − ρ 2 )−1/2
2
x + y 2 − 2ρxy
ZL f (x, y) = exp − (B4)
1 1 2π σ 2 2(1 − ρ 2 )σ 2
h(X) = − log dx
L L and the marginals f (xi ) = (2π σ 2 )−1/2 exp(−xi2 /2σ 2 ) for
0
xi = (x, y). Using Eq. (A3), we can compute the mutual in-
= log(L). (A2) formation between X and Y . For h(xi ) we find
Thus, for L < 1, log L < 0, and the differential entropy is Z
negative. The mutual information I (X; Y ) can be extended h(xi ) = − f (xi ) log f (xi )dxi
to continuous variables as Z
1
f (xi ) log 2π σ 2 dxi
Z
f (x, y) =
I (x; y) = f (x, y) log dxdy 2
f (x)f (y) 1
Z
+ 2 f (xi )xi2 dxi
Z
= − f (x, y) log f (x)dxdy 2σ
1 1
= log 2π σ 2 +
Z
− f (x, y) log f (y)dxdy 2 2
1 2
Z = log 4π σ , (B5)
+ f (x, y) log f (x, y)dxdy 2
in which the logarithm is in base 2. And now for the joint
= h(x) + h(y) − h(x, y). (A3) differential entropy of a Gaussian bivariate,
Z
Appendix B: Derivation of mutual information for h(x, y) = − f (x, y) log f (x, y)dxdy
Gaussian bivariates
(1 − ρ 2 )−1/2
Z
= − log f (x, y)dxdy
We consider a bivariate X = (X, Y )T with a mean vector 2π σ 2
Z 2
x + y 2 − 2ρxy
µx − f (x, y)dxdy
µ= (B1)
µy 2(1 − ρ 2 )σ 2
and a covariance matrix given by 1
= log(1 − ρ 2 ) + log 4π σ 2 . (B6)
2
σx2 σx σy ρ
C= Therefore, the mutual information of a Gaussian bivariate is
σx σy ρ σy2
a non-linear function of the correlation ρ:
for means E[X] = µx , E[Y ] = µy , variances σx2 = E[X 2 ] −
µ2x , σy2 = E[Y 2 ] − µ2y , and correlation coefficient ρ defined I (x, y) = h(x) + h(y) − h(x, y)
as 1
= − log(1 − ρ 2 ). (B7)
E[XY ] − µx µy 2
ρ= . (B2)
σx σy
The probability density function of the X–Y bivariate is Data availability. Data for the relativistic electron fluxes can be
requested from Joe Borovsky. Data for ULF wave power can be
1 1 T −1 found on the Augsburg website http://virbo.org/Augsburg/ULF, last
f (x, y) = exp − X C X
2π |C|1/2 2 access: 21 January 2022. The permanently updating database is
1 freely available via anonymous FTP at the following site for test-
= p ing and validation: http://space.augsburg.edu; see the folder labelled
2π σx σy 1 − ρ 2 /MACCS/ULF_Index/. The code to compute the mutual informa-
(x − µx )2 tion is publicly available on a GitHub repository (Savola, 2021).
1
exp −
2 1 − ρ2 σx2
2
1 y − µy Author contributions. AO designed the study, wrote most of the ar-
× exp − ticle, and participated in the interpretation of results. MS wrote the
2 1 − ρ2 σy2
code and the Methodology section, performed the data analysis, and
2ρ (x − µx ) y − µy participated in the interpretation of results. EK, HK, JEB, and MK
− . (B3)
σx σy participated in the interpretation of results and literature review.
https://doi.org/10.5194/angeo-40-37-2022 Ann. Geophys., 40, 37–53, 202252 A. Osmane et al.: ULF wave power and electron statistical dependence
Competing interests. The contact author has declared that neither Earth’s magnetosphere, J. Geophys. Res.-Space, 108, 1246,
they nor their co-authors have any competing interests. https://doi.org/10.1029/2002JA009601, 2003.
Borovsky, J. E. and Yakymenko, K.: Systems science of the magne-
tosphere: Creating indices of substorm activity, of the substorm-
Disclaimer. Publisher’s note: Copernicus Publications remains injected electron population, and of the electron radiation belt, J.
neutral with regard to jurisdictional claims in published maps and Geophys. Res.-Space, 122, 10012–10035, 2017.
institutional affiliations. Cameron, T. G., Jackel, B., and Oliveira, D. M.: Using Mutual In-
formation to Determine Geoeffectiveness of Solar Wind Phase
Fronts With Different Front Orientations, J. Geophys. Res.-
Acknowledgements. The results presented herein have been Space, 124, 1582–1592, https://doi.org/10.1029/2018JA026080,
achieved under the framework of the Finnish Centre of Excellence 2019.
in Research of Sustainable Space, which we gratefully acknowl- Cayton, T. E. and Belian, R.: Numerical modeling of the syn-
edge. Adnane Osmane is grateful for the enlightening conversations chronous orbit particle analyzer (SOPA, Version 2) that flew
with Simon Wing, Jay Johnson, and Solene Lejosne on the topics of on S/C 1990-095, Los Alamos Report, Los Alamos, N.M., LA-
information theory and radial diffusion transport of radiation belts. 14335, 2007.
Cover, T. M.: Elements of information theory, John Wiley & Sons,
ISBN 0-471-06259-6, online ISBN 0-471-20061-1, New York,
542 pp., 1999.
Financial support. Adnane Osmane and Mikko Savola acknowl-
De Michelis, P., Consolini, G., Materassi, M., and Tozzi, R.:
edge funding from the Academy of Finland by the profiling
An information theory approach to the storm-substorm
action on Matter and Materials (grant no. 318913). Emilia Kilpua
relationship, J. Geophys. Res.-Space, 116, A08225,
and Milla Kalliokoski acknowledge funding from FORESAIL
https://doi.org/10.1029/2011JA016535, 2011.
at the Academy of Finland (grant nos. 312390 and 336809).
Dudok de Wit, T. and Krasnosel’skikh, V. V.: Non-Gaussian
Joseph E. Borovsky has been supported at the Space Science Insti-
statistics in space plasma turbulence: fractal proper-
tute as part of the NSF GEM Program (grant no. AGS-2027569)
ties and pitfalls, Nonlinear Proc. Geoph., 3, 262–273,
and by the NASA HERMES Interdisciplinary Science Program
https://doi.org/10.5194/npg-3-262-1996, 1996.
(grant no. 80NSSC21K1406).
Freedman, D. and Diaconis, P.: On the Histogram as a Density Es-
timator: L 2 Theory, Probab. Theory Rel., 57, 453–476, 1981.
Open-access funding was provided by the
Johnson, J. R., Wing, S., and Camporeale, E.: Transfer entropy and
Helsinki University Library.
cumulant-based cost as measures of nonlinear causal relation-
ships in space plasmas: applications to Dst, Ann. Geophys., 36,
945–952, https://doi.org/10.5194/angeo-36-945-2018, 2018.
Review statement. This paper was edited by Yoshizumi Miyoshi Kozyreva, O., Pilipenko, V., Engebretson, M., Yumoto, K., Water-
and reviewed by two anonymous referees. mann, J., and Romanova, N.: In search of a new ULF wave index:
Comparison of Pc5 power with dynamics of geostationary rela-
tivistic electrons, Planet. Space Sci., 55, 755–769, 2007.
Kraskov, A., Stögbauer, H., and Grassberger, P.: Estimat-
ing mutual information, Phys. Rev. E, 69, 066138,
References https://doi.org/10.1103/PhysRevE.69.066138, 2004.
Kulsrud, R.: Plasma physics for astrophysics, Princeton University
Baker, D., Erickson, P., Fennell, J., Foster, J., Jaynes, A., and Verro- Press, New Jersey, ISBN 978-0-691-12073-7, 496 pp., 2005.
nen, P.: Space weather effects in the Earth’s radiation belts, Space Lejosne, S. and Kollmann, P.: Radiation belt radial diffusion at
Sci. Rev., 214, 1–60, 2018. Earth and beyond, Space Sci. Rev., 216, 1–78, 2020.
Balikhin, M. A., Boynton, R. J., Walker, S. N., Borovsky, Marsch, E. and Tu, C.-Y.: Intermittency, non-Gaussian statistics and
J. E., Billings, S. A., and Wei, H. L.: Using the NAR- fractal scaling of MHD fluctuations in the solar wind, Nonlinear
MAX approach to model the evolution of energetic electrons Proc. Geoph., 4, 101–124, 1997.
fluxes at geostationary orbit, Geophys. Res. Lett., 38, L18105, McCormac, B. M.: Radiation Trapped in Earth’s
https://doi.org/10.1029/2011GL048980, 2011. Magnetic Field, Science, 150, 785–786,
Borovsky, J. E.: Time-Integral Correlations of Multiple Variables https://doi.org/10.1126/science.150.3697.785, 1965.
With the Relativistic-Electron Flux at Geosynchronous Orbit: Osman, K., Matthaeus, W., Gosling, J., Greco, A., Servidio, S.,
The Strong Roles of Substorm-Injected Electrons and the Ion Hnat, B., Chapman, S. C., and Phan, T.: Magnetic reconnection
Plasma Sheet, J. Geophysical Res.-Space, 122, 11961–11990, and intermittent turbulence in the solar wind, Phys. Rev. Lett.,
https://doi.org/10.1002/2017JA024476, 2017. 112, 215002, https://doi.org/10.1103/PhysRevLett.112.215002,
Borovsky, J. E. and Denton, M. H.: Exploring the cross correla- 2014.
tions and autocorrelations of the ULF indices and incorporat- Osmane, A., Dimmock, A., Naderpour, R., Pulkkinen, T., and
ing the ULF indices into the systems science of the solar wind- Nykyri, K.: The impact of solar wind ULF Bz fluctuations on ge-
driven magnetosphere, J. Geophys. Res.-Space, 119, 4307–4334, omagnetic activity for viscous timescales during strongly north-
https://doi.org/10.1002/2014JA019876, 2014. ward and southward IMF, J. Geophys. Res.-Space, 120, 9307–
Borovsky, J. E. and Funsten, H. O.: Role of solar wind 9322, 2015a.
turbulence in the coupling of the solar wind to the
Ann. Geophys., 40, 37–53, 2022 https://doi.org/10.5194/angeo-40-37-2022A. Osmane et al.: ULF wave power and electron statistical dependence 53 Osmane, A., Dimmock, A., and Pulkkinen, T. I.: Universal prop- Taleb, N. N.: Statistical consequences of fat tails: Real world erties of mirror mode turbulence in the Earth’s magnetosheath, preasymptotics, epistemology, and applications, arXiv preprint, Geophys. Res. Lett., 42, 3085–3092, 2015b. arXiv:2001.10488, RESEARCHERS.ONE, available at: https: Osmane, A., Dimmock, A. P., and Pulkkinen, T. I.: Jensen-Shannon //www.researchers.one/article/2020-01-21 (last access: 21 Jan- Complexity and Permutation Entropy Analysis of Geomagnetic uary 2022), 2020. Auroral Currents, J. Geophys. Res.-Space, 124, 2541–2551, Thorne, R. E., Li, W., Ni, B., Ma, Q., Bortnik, J., Chen, L., Baker, 2019. D. N., Spence, H. E., Reeves, G. D., Henderson, M. G., and Papoulis, A. and Pillai, S. U.: Probability, Random Variables, and Kletzing, C. A.: Rapid local acceleration of relativistic radiation- Stochastic Processes, 4th Edn., McGraw-Hill Higher Education, belt electrons by magnetospheric chorus, Nature, 504, 411–414, McGraw-Hill, New York, ISBN 9780070486584, 852 pp., 2002. 2013. Rostoker, G., Skone, S., and Baker, D. N.: On the origin of rela- Ukhorskiy, A. and Sitnov, M.: Dynamics of radiation belt parti- tivistic electrons in the magnetosphere associated with some ge- cles, Springer, Boston, MA, 34 pp., https://doi.org/10.1007/978- omagnetic storms, Geophys. Res. Lett., 25, 3701–3704, 1998. 1-4899-7433-4_17, 2012. Runge, J., Balasis, G., Daglis, I. A., Papadimitriou, C., and Don- Van Allen, J. A., Ludwig, G. H., Ray, E. C., and McIlwain, C. E.: ner, R. V.: Common solar wind drivers behind magnetic storm– Observation of high intensity radiation by satellites 1958 Alpha magnetospheric substorm dependency, Sci. Rep., 8, 1–10, 2018. and Gamma, J. Jet Propul., 28, 588–592, 1958. Savola, M.: Mutual Information, GitHub [data set], available Walt, M.: Introduction to geomagnetically trapped radiation, Cam- at: https://github.com/msavola/Mutual_information (last access: bridge University Press, Cambridge, 168 pp., ISBN 0-521- 21 January 2022), 2021. 43143-3, 2005. Simms, L. E., Pilipenko, V., Engebretson, M. J., Reeves, G. D., Wing, S. and Johnson, J. R.: Applications of information Smith, A., and Clilverd, M.: Prediction of relativistic electron theory in solar and space physics, Entropy, 21, 140, flux at geostationary orbit following storms: Multiple regression https://doi.org/10.3390/e21020140, 2019. analysis, J. Geophys. Res.-Space, 119, 7297–7318, 2014. Wing, S., Johnson, J. R., Camporeale, E., and Reeves, G. D.: In- Simms, L. E., Engebretson, M. J., Clilverd, M. A., Rodger, C. J., formation theoretical approach to discovering solar wind drivers and Reeves, G. D.: Nonlinear and synergistic effects of ULF of the outer radiation belt, J. Geophys. Res.-Space, 121, 9378– Pc5, VLF chorus, and EMIC waves on relativistic electron flux at 9399, 2016. geosynchronous orbit, J. Geophys. Res.-Space, 123, 4755–4766, Wing, S., Johnson, J. R., and Vourlidas, A.: Information theoretic 2018. approach to discovering causalities in the solar cycle, Astrophys. Stepanova, M., Antonova, E., and Troshichev, O.: Intermittency J., 854, 13 pp., https://doi.org/10.3847/1538-4357/aaa8e7, 2018. of magnetospheric dynamics through non-Gaussian distribution function of PC-index fluctuations, Geophys. Res. Lett., 30, 1127, https://doi.org/10.1029/2002GL016070, 2003. https://doi.org/10.5194/angeo-40-37-2022 Ann. Geophys., 40, 37–53, 2022
You can also read