Real World Strategies for Kubernetes & Docker Integrations with Splunk - Ahmed Kira Parjinder Pannu
←
→
Page content transcription
If your browser does not render page correctly, please read the page content below

© 2019 SPLUNK INC.

Real World Strategies for Kubernetes &
Docker Integrations with Splunk

        Ahmed Kira                          Parjinder Pannu
    Splunk, Staff Sales Engineer   Cisco, IT Engineer, Splunk, Redhat OpenShift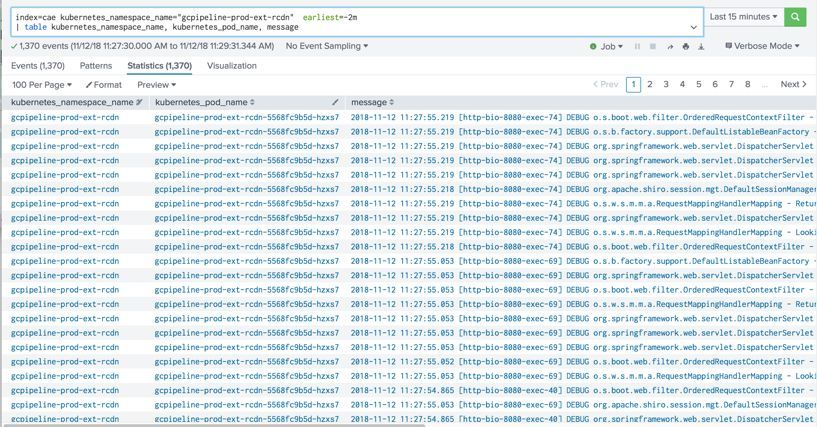
© 2019 SPLUNK INC.

AHMED KIRA
Staff Sales Engineer @ Splunk
4 ½ years at Splunk
Creator of AWS for Splunk
YouTube videos
http://bit.ly/AhmedAWSVideos
Coolest thing done with Splunk:
Stream on Raspberry Pi at home!
#whoami
© 2019 SPLUNK INC.

PARJINDER PANNU
Software Engineer @ Cisco
Kubernetes Logging Strategy @ Cisco
Splunk Administrator
10 years in IT
#whoami

© 2019 SPLUNK INC.

Forward-     During the course of this presentation, we may make forward‐looking statements
             regarding future events or plans of the company. We caution you that such statements

Looking      reflect our current expectations and estimates based on factors currently known to us
             and that actual events or results may differ materially. The forward-looking statements

Statements   made in the this presentation are being made as of the time and date of its live
             presentation. If reviewed after its live presentation, it may not contain current or
             accurate information. We do not assume any obligation to update
             any forward‐looking statements made herein.

             In addition, any information about our roadmap outlines our general product direction
             and is subject to change at any time without notice. It is for informational purposes only,
             and shall not be incorporated into any contract or other commitment. Splunk undertakes
             no obligation either to develop the features or functionalities described or to include any
             such feature or functionality in a future release.

             Splunk, Splunk>, Turn Data Into Doing, The Engine for Machine Data, Splunk Cloud,
             Splunk Light and SPL are trademarks and registered trademarks of Splunk Inc. in the
             United States and other countries. All other brand names, product names, or
             trademarks belong to their respective owners. © 2019 Splunk Inc. All rights reserved.
© 2019 SPLUNK INC.

                      1. Challenges of capturing logs from
                         containerized applications

                      2. Docker & K8s integrations to Splunk
Agenda
What will we cover?
                      3. Cisco IT’s migration journey & lessons
                         learned

                      4. Key Takeaways
© 2019 SPLUNK INC.
“ Gartner predicts that by 2020, more than
50% of global organizations will be running
containerized applications in production,
up from less than 20% in 2017”
Gartner Market Guide for Public Cloud Container Services ID: G00317096
“IDC predicts by 2021, more than
95% of new microservices
will be deployed in containers”
© 2019 SPLUNK INC.

Containerized Monitoring
Challenges
© 2019 SPLUNK INC.

Don’t Be That Guy!
© 2019 SPLUNK INC.

Challenges with Capturing Logs in a
Containerized World

• Do logs look the same as from VMs? NO
– Containerized logs are generally passed to stdout (standard out)
– Containerized logs are processed as JSON by the docker system with added metadata like originating container,
  timestamp, and more
© 2019 SPLUNK INC.

Challenges with Capturing Logs in a
Containerized World
Multi-line logs are a big problem in a containerized world

                                                             Different log lines
                                                             appearing as different
                                                             events
© 2019 SPLUNK INC. Challenges With Capturing Logs in a Containerized World • Timestamping: Is log timestamp the same as docker timestamp? • Event ordering: Destination (i.e. Splunk, Kafka must be able to address events being out of sync)
© 2019 SPLUNK INC.

One Pod/Container = One Log File
             Distributed Applications               Containerized Applications

                    /var/log/access.log          Pod 1
 Apache             /var/log/access-error.log

                                                Apache
                                                                     stdout
                    /var/log/log4j.log
  Java
                                                 Java
               inputs.conf                                           Kublet
               [access.log]
               sourcetype=access-combined        Pod 2

  Splunk       [access-error.log]                Java               stdout
 Universal     sourcetype=access-error
 Forwarder
               [log4j]                                   /var/log/docker/…/pod1.lo
               Sourcetype=app-log4j                      g
                                                         /var/log/docker/…/pod2.lo
                                                         g
© 2019 SPLUNK INC.
What About Container Performance Monitoring?
Logs and metrics strategies are often pursued independently
Application Application Infrastructure Infrastructure
Performance Logs Performance Logs
Wouldn’t it be nice to
consolidate all of this?© 2019 SPLUNK INC. PLANNING IS KEY!!! Ready for an adventure???
© 2019 SPLUNK INC.

Addressing the Challenges
© 2019 SPLUNK INC.

Capturing Logs in Containerized
Environments
                   Kubernetes
                   Node
                                             Containerized App

2 main methods              Stdout                                 Shared Volume

                                         Kubernetes
                      Docker Subsystem   metadata
Most published                                                   Sidecar w/collection
                                                                      software
integrations are
                    Daemonset-based plugin
Daemonset-based

                                               Destination
© 2019 SPLUNK INC.
Daemonset Collection Methods from Splunk
Method Description Pros Cons
Splunk Connect Docker Daemonset running on • Simple • Can cause excess load in some
for Docker each node, process data sent to • Available since 2015 environments
stdout • Critical bug fixes in August 2019 • Not compatible with multi-line events
Docker Fluentd Fluentd Daemonset running on • Fluentd is a proven platform • Multi-line and per-event processing can
Plugin(s) each node • Fluentd plugins can shape the data add load to container environment &
• Log collection • Fluentd plugins make multi-line requires testing.
• Metrics collection processing more attainable
Splunk Connect Comprehensive Splunk • Captures Logs, Metrics, and Objects • Multi-line and per-event processing can
for Kubernetes Daemonset solution; includes • Leverages Docker Fluentd plugin(s) add load to container environment.
(SCK) Fluentd, JQ Transformer, • Shapes data before going to Splunk; Requires testing.
Captures logs metrics, K8S metadata added as index-time fields
objects in Splunk
Splunk App for Guided walk-through for setting • Simplifies Splunk Connect for • Guided walk-through might not suit all
Infrastructure up Kubernetes Connect with Kubernetes Deployment use cases, but is extensible
additional steps for OpenShift© 2019 SPLUNK INC.
What Provides the Best Mileage?
Method Description Pros Cons
Splunk Connect Docker Daemonset running on • Simple • Can cause excess load in some
for Docker each node, process data sent to • Available since 2015 environments
stdout • Critical bug fixes in August 2019 • Not compatible with multi-line events
Docker Fluentd Fluentd Daemonset running on • Fluentd is a proven platform • Multi-line and per-event processing can
Plugin(s) each node • Fluentd plugins can shape the data add load to container environment &
• Log collection • Fluentd plugins make multi-line requires testing.
• Metrics collection processing more attainable
Splunk Connect Comprehensive Splunk • Captures Logs, Metrics, and Objects • Multi-line and per-event processing can
for Kubernetes Daemonset solution; includes • Leverages Docker Fluentd plugin(s) add load to container environment.
(SCK) Fluentd, JQ Transformer, • Shapes data before going to Splunk; Requires testing.
Captures logs metrics, K8S metadata added as index-time fields
objects in Splunk
Splunk App for Guided walk-through for setting • Simplifies Splunk Connect for • Guided walk-through might not suit all
Infrastructure up Kubernetes Connect with Kubernetes Deployment use cases, but is extensible
additional steps for OpenShift© 2019 SPLUNK INC.
What is Splunk Connect for Kubernetes
(SCK)?
https://github.com/splunk/splunk-connect-for-kubernetes
Includes 4 Daemonsets
• Fluentd (aka ‘logging’ daemonset)
– Custom Fluentd configs
– Fluentd plugins including:
– JQtransformer
– Concat
• Metrics, Metrics Aggregation, Objects Daemonsets
Deployed on each Kubernetes/OpenShift node
• Capture container and node level logs going to standard out
• Kubernetes metadata capture
• Kubernetes node and container level performance metrics
Splunk App for Infrastructure (SAI) simplifies deployment© 2019 SPLUNK INC.
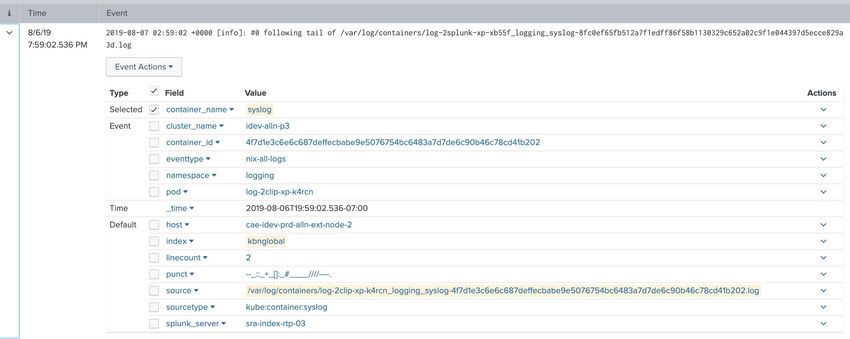
Splunk Connect for Kubernetes (SCK)
Preserving the Raw Event
Before After
• Lots of metadata • Raw event preserved
• Actual log in field named ‘log’ or ‘message’ • Metadata preserved as index-time fields
• No auto-extractions of ‘log’ field contents • Automatic extractions
(when correct sourcetype assigned)
• Smaller event size=smaller license© 2019 SPLUNK INC.
Splunk Connect for Kubernetes (SCK)
Default Timestamping
Fluentd
processing
time
(user time zone applied)
milliseconds
difference from
event time
No event ordering
issues
Designed for scale© 2019 SPLUNK INC.
Splunk Connect for Kubernetes (SCK)
Custom Timestamping
Update values.yaml file
• Possible to overwrite default my-container1:
from:
timestamping behavior file:
path: /var/log/my-app.log
timestampExtraction:
regexp:
(?\d{4}-\d{2}-\d{2}T\d{2}\d{2}\d{
2}Z)
format: "%Y-%m-%dT%H:%M:%SZ"
multiline:
firstline: \d{4}-\d{2}-\d{2}
sourcetype: ”access_combined"
More examples
https://github.com/splunk/splunk-connect-for-kubernetes/blob/develop/helm-chart/splunk-kubernetes-logging/examples/
use_logs.yaml© 2019 SPLUNK INC.
Splunk Connect for Kubernetes (SCK)
Multi-line Logging
Update values.yaml file
• Concat Fluentd plugin enables my-log-file:
manageable multi-line processing from:
file:
– Per container new line breaking
path: /var/log/my-app.log
– Test your regex at www.rubular.com timestampExtraction:
– Baseline performance impact before promoting to regexp:
production
(?^\d{4}-\d{2}-\d{2}T\d{2}\d{2}\
d{2}Z)
format: "%Y-%m-%dT%H:%M:%SZ"
multiline:
firstline: ^\d{4}-\d{2}-\d{2}
sourcetype: "log4j"
More examples
https://github.com/splunk/splunk-connect-for-kubernetes/blob/develop/helm-chart/splunk-kubernetes-logging/examples/
use_logs.yaml© 2019 SPLUNK INC.
Alternative Solutions: Multi-line Logging
•Update application code
– Update applications to write new lines differently*
(e.g. replace \\r to \\u2028 in log4j config)
– Logs appear as single line to Fluentd, appear as multi-line in Splunk
•Leverage a sidecar
1. Write logs to a shared volume
2. Splunk Universal Forwarder
(new line processing moved to Heavy Forwarder or Indexer tier)
OR
Fluentd on sidecar with global configuration
* https://fabianlee.org/2018/03/09/java-collapsing-multiline-stack-traces-into-a-single-log-event-
using-spring-backed-by-logback-or-log4j2/© 2019 SPLUNK INC.
Splunk Connect for Kubernetes (SCK)
Default Sourcetype Assignment
Update values.yaml file
•SCK dynamically assigns sourcetype my-log-file:
from:
to kube:container: file:
path: /var/log/my-app.log
•Since most containers have single timestampExtraction:
applications, generally ok regexp:
(?\d{4}-\d{2}-\d{2}T\d{2}\d{2}\d
•Sourcetype name can be overwritten {2}Z)
format: "%Y-%m-%dT%H:%M:%SZ"
multiline:
firstline: \d{4}-\d{2}-\d{2}
sourcetype: "access_combined"
https://github.com/splunk/splunk-connect-for-kubernetes/blob/develop/helm-chart/splunk-kubernetes-
logging/values.yaml© 2019 SPLUNK INC.
Per Event Sourcetype Assignment
• Alternative: Leverage a Splunk Heavy Forwarder (or indexers)
• Per event sourcetype reassignment leveraging props and transforms
props.conf: transforms.conf
[(?:::){0}kube.container.apache…] [apache_access_reassign_sourcetype]
TRANSFORMS-reassign=apache_error_reassign_sourcetype, REGEX = GET|POST|PUT
apache_access_reassign_sourcetype FORMAT =
sourcetype::access_combined_wkcookie
References: DEST_KEY = MetaData:Sourcetype
Sourcetype overrides
https://docs.splunk.com/Documentation/Splunk/7.3.1/Data/Advancedsou [apache_error_reassign_sourcetype]
rcetypeoverrides REGEX = error
FORMAT = sourcetype::apache_error
Pretrained sourcetypes: DEST_KEY = MetaData:Sourcetype
https://docs.splunk.com/Documentation/Splunk/7.3.1/Data/Listofpretrain
edsourcetypes
Splunk apps/add-ons:
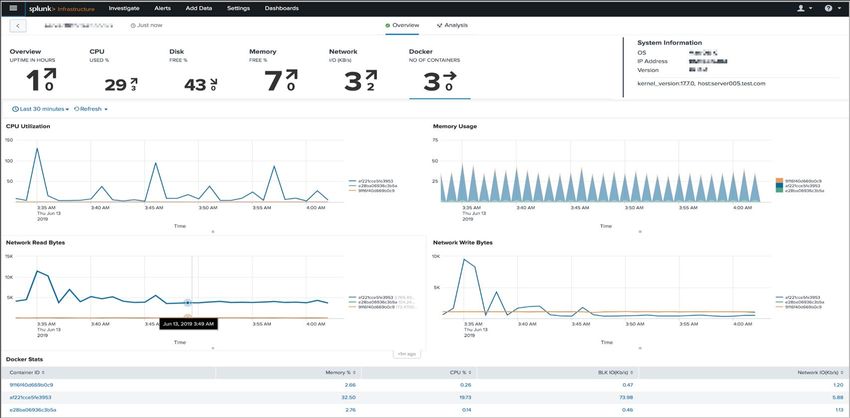
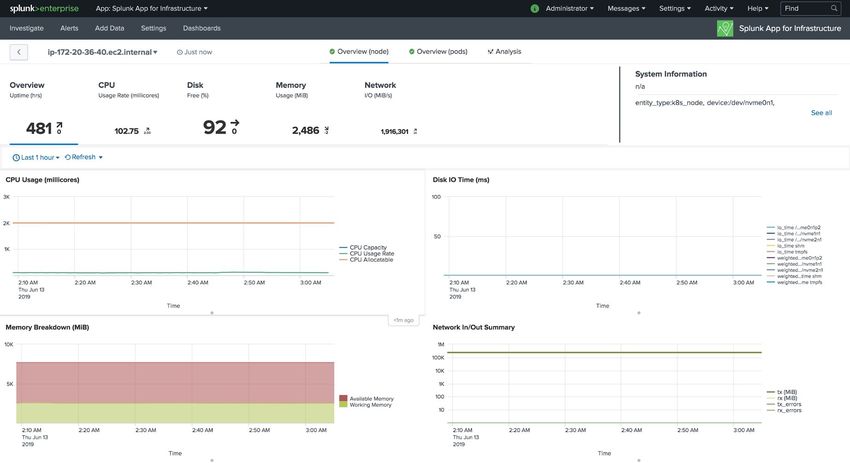
https://splunkbase.com© 2019 SPLUNK INC. Splunk App for Infrastructure Logs + Performance Splunk Connect for Kubernetes collects: • container logs, • Kubernetes logs, • Container metrics, and • Kubernetes metadata Visualize centrally in Splunk App for Infrastructure
© 2019 SPLUNK INC.

Splunk App for Infrastructure
Easily Rollout SCK
NEW:
• Guided onboarding
  – Kubernetes
  – OpenShift
• Deploy in minutes
• Include additional
 metadata
• Tune data collection within
 the UI
© 2019 SPLUNK INC.

Splunk App for Infrastructure
Metrics That Matter
• Metrics written to a
  Splunk metrics index

• Up to 1000X faster

• Captures all cluster
  metrics from Kubelet
  API
© 2019 SPLUNK INC.

              1. Events make sense! De-JSONized
                  Addressed
Splunk
Connect for   2. Addressed Timestamping
Kubernetes
              3. Addressed Sourcetype assignment

              4. Addressed Multi-line logging

              5. Logs & Performance in one central place
                  Addressed
© 2019 SPLUNK INC. FTW Drum rolls please!
© 2019 SPLUNK INC.

Cisco IT’s Journey
© 2019 SPLUNK INC.
Mission:
Empower developers to release new
capabilities faster, identify problems
faster and solve problems faster© 2019 SPLUNK INC.
Desired Business Outcomes
5 sec. 99.9% 1
Time for logs Searchability Self-service
to be SLA portal to
searchable provision
containers &
logging© 2019 SPLUNK INC.
Self-service
Multi-cloud 1. Users select various
Portal options
2. Environment
auto-provisioned
3. ‘Log to Splunk’
auto-enabled© 2019 SPLUNK INC.
Delivering on Technical Requirements
Custom &
Self-service Container Role-based Performance
Multi-line Log
Portal Logging Access Monitoring
Support
Cisco Splunk Index Customer Phase 2
Cloud Connect for selection managed w/ Splunk
Portal Kubernetes in portal sidecar Kubernetes
(SCK) Connect© 2019 SPLUNK INC.
Overall Architecture
40+ indexers w/HEC enabled
OpenShift Kubernetes Nodes w/SCK© 2019 SPLUNK INC.
Provisioning & Log Delivery Workflow
Provisioning Log Delivery
Redhat OpenShift Splunk Connect for
3 Kubernetes
1 Namespace (aka project)
- Annotate with index
Fluentd ‘Logging’
Daemonset
Customizations:
Splunk - Leveraged ‘Fluentd Kubernetes metadata plugin’
2 - Capture annotations and pass in events to HEC
Cluster Master
- Check & create indexes
- Check &/or create HEC
tokens 4
HEC enabled Indexers© 2019 SPLUNK INC.
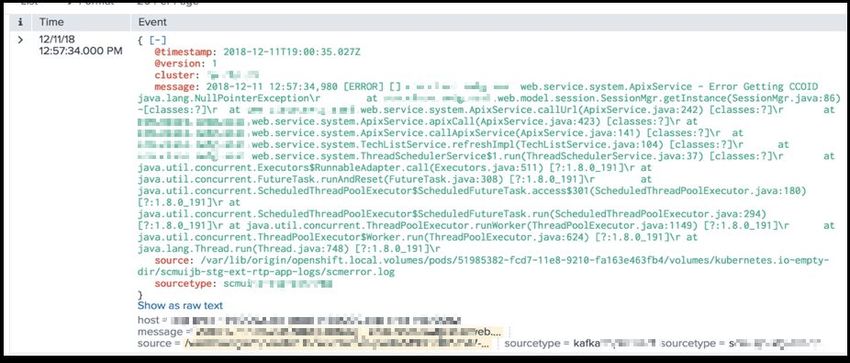
Events Going {
"host":”somehost.someorg",
"time":"1564735330.3250196",
to Splunk "index":"kbntest2",
"source":"/var/log/containers/ovs-m87tp_open
shift-sdn_openvswitch-2350644836d16f5bdbf124
61b006577ac5e37a31f04e331a2f7d2a19757a4f5a.l
og",
"sourcetype":"kube:container:openvswitch",
"fields":{ "pod":"ovs-m87tp",
"namespace":"openshift-sdn",
"container_name":"openvswitch",
"container_id":"2350644836d16f5bdbf12461b0
Extra metadata 06577ac5e37a31f04e331a2f7d2a19757a4f5a",
become "cluster_name":"cluster_name"},
index-time fields "event":"2019-08-02T08:42:10.318Z|00226|conn
mgr|INFO|br0unix: 2 flow_mods in the last
0 s (2 deletes)\n”
}
Event displayed
when searched in
Splunk© 2019 SPLUNK INC.
Remember this Diagram?
Kubernetes
Node
Containerized App
Stdout Shared Volume
How did Cisco
Kubernetes
achieve this? Docker Subsystem metadata
Sidecar w/collection
software
Daemonset-based plugin
DestinationCustom Logs (ones written to disk, NOT © 2019 SPLUNK INC.
stdout)
Cisco developed solution
Kubernetes API
Splunk Connect for
OpenShift / 1. Update SCK/Fluentd to read volume directory
Kubernetes
Kubernetes Node 2. Extract pod_uuid from file name location
3. Lookup pod info from stdout directory name
Namespace A 4. Get index name from Kubernetes API
5. Send event to Splunk
Volume
Pod Pod Pod /var/lib/origin/openshift.local.volume/pods//…
1 2 3
…openshift-monitoring_alertmanager-.log ->
Stdout /var/log/containers/_
_-.log
SCK Logging DaemonsetCustom Logs (written to volume, NOT © 2019 SPLUNK INC.
stdout)
Cisco developed solution
Kubernetes API
Splunk Connect for
OpenShift / 1. Update SCK/Fluentd to read volume directory
Kubernetes
Kubernetes Node 4 2. Extract pod_uuid from file name location
3. Lookup pod info from stdout directory name
Namespace A 4. Get index name from Kubernetes API
5. Send event to Splunk
Pod Pod Pod
Volume 2
/var/lib/origin/openshift.local.volume/pods//…
1 2 3
…openshift-monitoring_alertmanager-.log ->3
Stdout /var/log/containers/_
_-.log
1
SCK Logging Daemonset
5 Send to Splunk© 2019 SPLUNK INC.
What about For those people, Cisco IT offers a sidecar
option:
Multi-line • Developers to manage and maintain the sidecar
Logs? –
–
Customized Fluentd provided
Based on SCK
– Developers control the line breaker for their logs
– Universal Forwarder is an option but we wanted to standardize
on one method
• Testing native SCK capability from Concat plugin.
Is this your
developer?© 2019 SPLUNK INC. Managing a Sidecar???
© 2019 SPLUNK INC.

Load
Balancer
Configuratio
n              Important capabilities enabled:
               • Active Health Checks to each HEC
                   - https://hecurls:8088/services/collector/health/1.0
               • Keepalive: 32 seconds initially
               • Sticky sessions not required
                   - Didn’t pursue indexer acknowledgment
© 2019 SPLUNK INC.
HEC Token strategy:
HEC
Settings© 2019 SPLUNK INC.
•Planning for 20 TB/day, 100+ concurrent users
Scaling (total user count in the thousands)
Splunk •40 initial indexers for up to 10TB
•Add indexers as we need
•Opted for HEC on Indexers
- Extra load from per-event sourcetype re-assignment© 2019 SPLUNK INC.
1. Application self-service
Benefits to 2. Reduce tickets by 70% over prior architecture
Cisco 3. Increase in developer productivity
4. Reduced Splunk & OpenShift Administration
5. Cost savings (less infrastructure and fewer
resources)© 2019 SPLUNK INC.
Key Takeaways
Reduced
Logs, Metadata Complexity, Guided Plan
Lower TCO
& Metrics Improved Workflows Ahead!
Service
Splunk Splunk Cisco IT was Splunk App for Don’t be that
Connect for Connect for able to provide Infrastructure guy!
Kubernetes Kubernetes better service offers guided
requires by planning & workflows for
smaller license collects more leveraging Kubernetes &
and enables than just logs Kubernetes OpenShift
more efficient Connect
search© 2019 SPLUNK INC.
1. IT1753 - How Kronos Consolidated Logging and
Infrastructure Monitoring with the Splunk App for
Infrastructure
Wednesday, October 23, 01:45 PM - 02:30 PM
Other Useful 2. IT1729 - Kubernetes Observability with Splunk Connect
sessions for Kubernetes (SCK)
Tuesday, October 22, 01:45 PM - 02:30 PM
3. IT2240 - Red Hat OpenShift and Splunk Better Together
Wednesday, October 23, 03:00 PM - 03:45 PM
4. BA1529 - Splunk Business Flow + Splunk Connect for
Kubernetes = Happy Containers
Tuesday, October 22, 12:30 PM - 01:15 PM© 2019 SPLUNK INC. Appendix
© 2019 SPLUNK INC.

Cisco Modified Configmap.yaml
kind: ConfigMap
metadata:
 annotations:
 name: logging
apiVersion: v1
data:
 fluent.conf: |

    @type tail
    tag tail.containers.*
    path /var/log/containers/*.log
    pos_file /var/log/splunk-fluentd-hec-containers.log.pos
    path_key source
    read_from_head true
    # docker logs are in JSON format, with date attached to each log

     @type json
     time_key time
     time_type string
     time_format %Y-%m-%dT%H:%M:%S.%NZ
     localtime false

   @type tail
   tag tail.customlog.*
   path /var/lib/origin/openshift.local.volumes/pods/*/volumes/kubernetes.io~empty-dir/*/*.log
   pos_file /var/log/splunk-fluentd-hec-customlog.log.pos
   path_key source
   read_from_head true
   # custom logs are in flat format, no date infomation is associated
   format none

   # This filter enriches the logs with kubernetes metadata, the filter
   # uses the tag information to find the kubernetes information
   # (namespace, pod, container)
   @type kubernetes_metadata
   kubernetes_url "#{ENV['K8S_HOST_URL']}"
   bearer_token_file /var/run/secrets/kubernetes.io/serviceaccount/token
   ca_file /var/run/secrets/kubernetes.io/serviceaccount/ca.crt
   annotation_match [ "." ]

   # Customlogs use the none formatter, so logs are in the field 'message',
   # copy that field to 'log' to match the JSON log formatting, also
© 2019 SPLUNK INC.
Cisco Modified Configmap.yaml
apiVersion: extensions/v1beta1
kind: DaemonSet
metadata:
labels:
app: logging
name: logging
spec:
revisionHistoryLimit: 10
selector:
matchLabels:
app: logging
template:
metadata:
creationTimestamp: null
labels:
app: logging
spec:
containers:
# - command: ["sleep", "150000"]
- args:
- -c
- /fluentd/etc/fluent.conf
env:
- name: SPLUNK_HEC_TOKEN
value: b1d98e0e-c919-4d3b-a028-3cccf5dcc40b
- name: SPLUNK_HEC_PROTOCOL
value: http
- name: SPLUNK_HEC_HOST
value: sra-index-rtp-01.cisco.com
- name: SPLUNK_HEC_PORT
value: "8088"
- name: K8S_HOST_URL
value: https://kubernetes.default.svc.cluster.local
- name: SPLUNK_HEC_MYHOST
valueFrom:
fieldRef:
apiVersion: v1
fieldPath: spec.nodeName
- name: LOCATION_NAME
value: idev-prd-rtp-felix-p3
- name: FLUENT_UID
value: "0"
image: containers.cisco.com/stevpier/udt-openshift-splunk-connect:latest
imagePullPolicy: Always
name: fluentd
resources:
limits:
memory: 500Mi
requests:Cisco Built Plugin to Process ‘Custom © 2019 SPLUNK INC. Logs’ (logs not sent to stdout) Contents: • Dockerimage file (1 slide) – entry.sh – 3 patch files referenced within the dockerimage file (3 slides) – Fluentd-plugin-splunk-hec-1.1.1.gem (included with Splunk Connect for Kubernetes)
© 2019 SPLUNK INC.

  Dockerimage
FROM ruby:2.5.5-slim-buster

# skip runtime bundler installation
ENV FLUENTD_DISABLE_BUNDLER_INJECTION 1
COPY *.patch *.gem /tmp/

RUN set -e \
&& apt-get update \
&& apt-get upgrade -y \
&& apt-get install -y --no-install-recommends libjemalloc-dev jq \
&& buildDeps="make gcc wget g++ patch" \
&& apt-get install -y --no-install-recommends $buildDeps \
&& gem install -N fluentd -v "1.4.0" \
&& gem install -N fluent-plugin-systemd -v "1.0.2" \
&& gem install -N fluent-plugin-concat -v "2.2.2" \
&& gem install -N fluent-plugin-prometheus -v "1.3.0" \
&& gem install -N fluent-plugin-jq -v "0.5.1" \
&& gem install -N oj -v "3.5.1" \
&& gem install -N /tmp/*.gem \
&& gem install -N fluent-plugin-kubernetes_metadata_filter -v 2.2.0\
&& patch /usr/local/bundle/gems/fluent-plugin-kubernetes_metadata_filter-2.2.0/lib/fluent/plugin/filter_kubernetes_metadata.rb /tmp/filter_kubernetes_metadata.rb.patch \
&& patch /usr/local/bundle/gems/fluent-plugin-kubernetes_metadata_filter-2.2.0/lib/fluent/plugin/kubernetes_metadata_watch_pods.rb /tmp/kubernetes_metadata_watch_pods.rb.patch \
&& patch /usr/local/bundle/gems/fluent-plugin-kubernetes_metadata_filter-2.2.0/lib/fluent/plugin/kubernetes_metadata_watch_namespaces.rb /tmp/kubernetes_metadata_watch_namespaces.rb.patch \
&& dpkgArch="$(dpkg --print-architecture | awk -F- '{ print $NF }')" \
&& wget -O /usr/bin/dumb-init https://github.com/Yelp/dumb-init/releases/download/v1.2.1/dumb-init_1.2.1_$dpkgArch \
&& chmod +x /usr/bin/dumb-init \
&& apt-get purge -y --auto-remove \
            -o APT::AutoRemove::RecommendsImportant=false \
            $buildDeps \
&& rm -rf /var/lib/apt/lists/* \
&& rm -rf /tmp/* /var/tmp/* $GEM_HOME/cache/*.gem \
&& mkdir -p /fluentd/etc

# See https://packages.debian.org/stretch/amd64/libjemalloc1/filelist
ENV LD_PRELOAD "/usr/lib/x86_64-linux-gnu/libjemalloc.so.2"
COPY entrypoint.sh /fluentd/entrypoint.sh

ENTRYPOINT ["/fluentd/entrypoint.sh"]
© 2019 SPLUNK INC. entry.sh #!/usr/bin/dumb-init /bin/sh set -e exec fluentd "$@"
© 2019 SPLUNK INC.

kubernetes_metadata.rb
--- filter_kubernetes_metadata.rb.O         2019-08-21 15:05:49.394701046 -0400
+++ filter_kubernetes_metadata.rb 2019-08-21 15:18:24.637370506 -0400
@@ -27,6 +27,7 @@

module Fluent::Plugin
 class KubernetesMetadataFilter < Fluent::Plugin::Filter
+ @pod_mapping
  K8_POD_CA_CERT = 'ca.crt'
  K8_POD_TOKEN = 'token'

@@ -187,6 +188,10 @@
  @namespace_cache = LruRedux::TTL::ThreadSafeCache.new(@cache_size, @cache_ttl)

     @tag_to_kubernetes_name_regexp_compiled = Regexp.compile(@tag_to_kubernetes_name_regexp)
+    @tag_to_customlog_kubernetes_name_regexp_compiled = Regexp.compile('^tail\.(?[^\.]+)\.var\.lib\.origin\.openshift\.local\.volumes\.pods\.(?[-a-z0-9]+)\.volumes\.kubernetes.io~empty-dir\.(?[^\.]+)\.(?.*)\.log$')
+    @customlog_string_to_kubernetes_compiled = Regexp.compile('^(?[^[:space:]]+)[[:space:]]+(?[^[:space:]]+)[[:space:]]+(?[^[:space:]]+)[[:space:]]+(?[^[:space:]]+)$')
+    @pod_log_filename_to_uuid_regexp_compiled = Regexp.compile('^\/var\/log\/pods\/(?[-a-z0-9]*)\/.*\/.*\.log$')
+    @container_filename_to_uuid_regexp_compiled = Regexp.compile('^\/var\/log\/containers\/(?[a-z0-9]([-a-z0-9]*[a-z0-9])?(\.[a-z0-9]([-a-z0-9]*[a-z0-9])?)*)_(?[^_]+)_(?.+)-(?[a-z0-9]{64})\.log$')
     @container_name_to_kubernetes_regexp_compiled = Regexp.compile(@container_name_to_kubernetes_regexp)

  # Use Kubernetes default service account if we're in a pod.
@@ -281,6 +286,7 @@
    end
  end

+     @pod_mapping = self.generate_map()
    end

  def get_metadata_for_record(namespace_name, pod_name, container_name, container_id, create_time, batch_miss_cache)
@@ -326,6 +332,9 @@
   tag_match_data = tag.match(@tag_to_kubernetes_name_regexp_compiled) unless @use_journal
   tag_metadata = nil
   batch_miss_cache = {}
+   unless tag_match_data
+    customlog_vol, customlog_file, tag_match_data = filter_customlog(tag)
+   end
   es.each do |time, record|
    if tag_match_data && tag_metadata.nil?
      tag_metadata = get_metadata_for_record(tag_match_data['namespace'], tag_match_data['pod_name'], tag_match_data['container_name'],
@@ -348,6 +357,8 @@
        metadata = k_metadata
    end

+      record['customlog_vol'] = customlog_vol if defined?(customlog_vol)
+      record['customlog_file'] = customlog_file if defined?(customlog_file)
      record = record.merge(metadata) if metadata
      new_es.add(time, record)
     end
© 2019 SPLUNK INC.
kubernetes_metadata_watch_namespaces
.rb
--- kubernetes_metadata_watch_namespaces.rb.O 2019-09-06 22:29:29.710620383 -0400
+++ kubernetes_metadata_watch_namespaces.rb 2019-09-07 19:31:39.233698644 -0400
@@ -24,35 +24,40 @@
include ::KubernetesMetadata::Common
def start_namespace_watch
- begin
- resource_version = @client.get_namespaces.resourceVersion
- watcher = @client.watch_namespaces(resource_version)
- rescue Exception=>e
- message = "start_namespace_watch: Exception encountered setting up namespace watch from Kubernetes API #{@apiVersion} endpoint #{@kubernetes_url}: #{e.message}"
- message += " (#{e.response})" if e.respond_to?(:response)
- log.debug(message)
- raise Fluent::ConfigError, message
- end
- watcher.each do |notice|
- case notice.type
- when 'MODIFIED'
- cache_key = notice.object['metadata']['uid']
- cached = @namespace_cache[cache_key]
- if cached
- @namespace_cache[cache_key] = parse_namespace_metadata(notice.object)
- @stats.bump(:namespace_cache_watch_updates)
+ loop do
+ log.error "watchthread: Starting kubernetes namespace"
+ begin
+ resource_version = @client.get_namespaces.resourceVersion
+ watcher = @client.watch_namespaces(resource_version)
+ rescue Exception=>e
+ message = "start_namespace_watch: Exception encountered setting up namespace watch from Kubernetes API #{@apiVersion} endpoint #{@kubernetes_url}: #{e.message}"
+ message += " (#{e.response})" if e.respond_to?(:response)
+ log.debug(message)
+ raise Fluent::ConfigError, message
+ end
+ watcher.each do |notice|
+ log.error "watchthread: Received namespace update #{notice.object['metadata']['namespace']}"
+ case notice.type
+ when 'MODIFIED'
+ cache_key = notice.object['metadata']['uid']
+ cached = @namespace_cache[cache_key]
+ if cached
+ @namespace_cache[cache_key] = parse_namespace_metadata(notice.object)
+ @stats.bump(:namespace_cache_watch_updates)
+ else
+ @stats.bump(:namespace_cache_watch_misses)
+ end
+ when 'DELETED'
+ # ignore and let age out for cases where
+ # deleted but still processing logs© 2019 SPLUNK INC.
kubernetes_metadata_watch_pods.rb
--- kubernetes_metadata_watch_pods.rb.O 2019-09-07 00:19:17.903418786 -0400
+++ kubernetes_metadata_watch_pods.rb 2019-09-07 19:12:09.468063600 -0400
@@ -24,39 +24,44 @@
include ::KubernetesMetadata::Common
def start_pod_watch
- begin
- resource_version = @client.get_pods.resourceVersion
- watcher = @client.watch_pods(resource_version)
- rescue Exception => e
- message = "Exception encountered fetching metadata from Kubernetes API endpoint: #{e.message}"
- message += " (#{e.response})" if e.respond_to?(:response)
+ loop do
+ log.error "watchthread: Starting kubernetes pod"
+ begin
+ resource_version = @client.get_pods.resourceVersion
+ watcher = @client.watch_pods(resource_version)
+ rescue Exception => e
+ message = "Exception encountered fetching metadata from Kubernetes API endpoint: #{e.message}"
+ message += " (#{e.response})" if e.respond_to?(:response)
- raise Fluent::ConfigError, message
- end
+ raise Fluent::ConfigError, message
+ end
- watcher.each do |notice|
- case notice.type
- when 'MODIFIED'
- cache_key = notice.object['metadata']['uid']
- cached = @cache[cache_key]
- if cached
- @cache[cache_key] = parse_pod_metadata(notice.object)
- @stats.bump(:pod_cache_watch_updates)
- elsif ENV['K8S_NODE_NAME'] == notice.object['spec']['nodeName'] then
- @cache[cache_key] = parse_pod_metadata(notice.object)
- @stats.bump(:pod_cache_host_updates)
+ watcher.each do |notice|© 2019 SPLUNK INC.
Thank
You
!Go to the .conf19 mobile app to
RATE THIS SESSIONYou can also read