Redflow 1H19 Results 26th February 2019 - sustainable energy storage
←
→
Page content transcription
If your browser does not render page correctly, please read the page content below
Redflow
1H19 Results
26th February 2019

redflow              sustainable energy storage
Disclaimer

This presentation has been prepared by Redflow            not constitute investment advice, nor shall it or any       Redflow that the forward-looking statements
Limited (“Redflow”). It contains general information      part of it or the fact of its distribution form the basis   contained in this presentation are accurate,
about Redflow as at the date of this presentation.        of, or be relied on in connection with, any contract or     complete, reliable or adequate or that they will be
The information in this presentation should not be        investment decision.                                        achieved or prove to be correct.
considered to be comprehensive or to comprise all of
the material which a shareholder or potential             Certain statements in this presentation are forward-
investor in Redflow may require in order to               looking statements. You can identify these                  Subject to any continuing obligation under applicable
determine whether to deal in shares. The                  statements by the fact that they use words such as          law or relevant listing rules of the ASX, Redflow
information in this presentation is of a general nature   “anticipate”, “estimate”, “expect”, “project”,              disclaims any obligation or undertaking to
only and does not purport to be complete.                 “intend”, “plan”, “believe”, “target”, “may”,               disseminate any updates or revisions to any forward-
                                                          “assume” and words of similar import. Indications of,       looking statements in this presentation to reflect any
This presentation does not take into account the          and guidance on, future earnings and financial              change in expectations in relation to any forward-
financial situation, investment objectives, tax           position and performance are also forward-looking           looking statements or any change in events,
situation or particular needs of any person and           statements.                                                 conditions or circumstances on which any such
nothing contained in this presentation constitutes                                                                    statements are based. Nothing in this presentation
investment, legal, tax or other advice, nor does it       Forward-looking statements, opinions and estimates          shall under any circumstances create an implication
contain all the information which would be required       provided in this presentation are based on                  that there has been no change in the affairs of
in a disclosure document or prospectus prepared in        assumptions and contingencies which are subject to          Redflow since the date of the presentation.
accordance with the requirements of the                   change without notice, as are statements about              Except for any statutory liability which cannot be
Corporations Act 2001 (Cth).                              market and industry trends, which are based on              excluded, Redflow and its respective officers,
                                                          interpretations of current market conditions.               employees and advisers expressly disclaim all liability
Readers or recipients of this presentation should,        Forward-looking statements, including projections,          (including negligence) for any direct or indirect loss
before making any decisions in relation to their          guidance on future earnings and estimates, are              or damage which may be suffered by any person in
investment or potential investment in Redflow,            provided in this presentation as a general guide only       relation to, and take no responsibility for, any
consider the appropriateness of the information           and should not be relied on as an indication or             information in this presentation or any error or
having regard to their own objectives and financial       guarantee of future performance. Forward-looking            omission therefrom, and make no representation or
situation and seek their own professional legal and       statements are based on current expectations and            warranty, express or implied, as to the currency,
taxation advice appropriate to their particular           beliefs and, by their nature, are subject to a number       accuracy, reliability or completeness of this
circumstances.                                            of known and unknown risks and uncertainties that           presentation.
                                                          could cause the actual results, performances and
This presentation is for information purposes only        achievements to differ materially from any expected         By attending an investor presentation or briefing, or
and does not constitute or form part of any offer,        future results, performances or achievements                by accepting, accessing or reviewing this
invitation, solicitation or recommendation to acquire,    expressed or implied by such forward-looking                presentation, you acknowledge and agree to the
purchase, subscribe for, sell or otherwise dispose of,    statements. No representation, warranty or                  terms set out in this disclaimer.
or issue, any shares. Further, this presentation does     assurance (express or implied) is given or made by

                                                                                                                                                                                2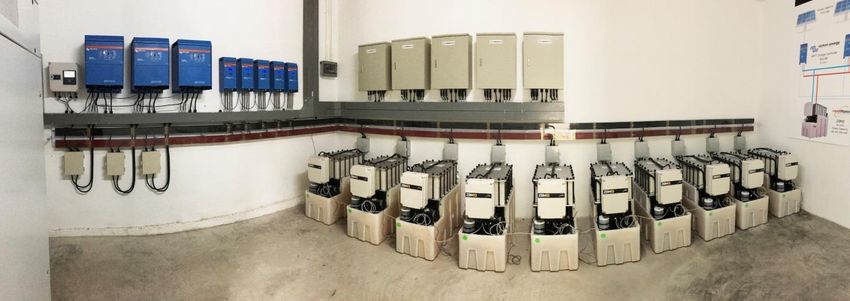
Table of contents

1. Company Summary
2. Manufacturing Update
3. Commercialisation Strategy
4. 1H19 Financials
5. Priorities For 2019
6. Appendices

                                3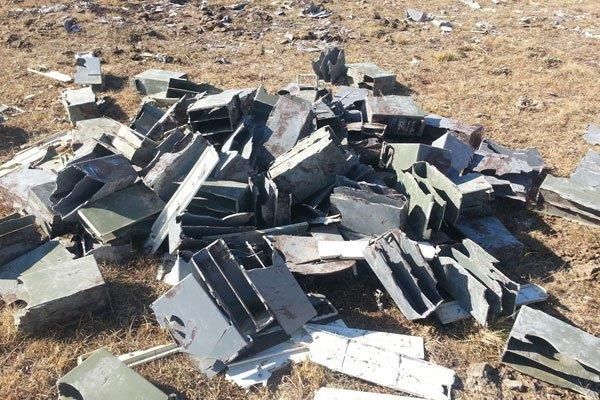
Company Overview
Established in 2005.
Listed on ASX in 2010
(ASX:RFX)
Netherlands
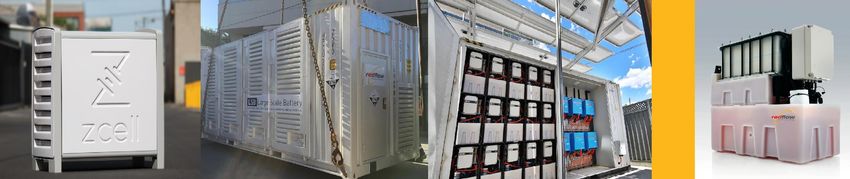
Redflow designs Germany
and manufactures zinc- Poland
bromine flow Italy
batteries
Jordan Thailand (plus the
Manufacturing Plant)
Headquartered in
Australia. Company Fiji
owned manufacturing
facility in Thailand South Africa New
Zealand
States in Australia:
Batteries currently QLD (Corporate Head Office Brisbane)
deployed in nine SA (Office in Adelaide)
VIC, NSW, TAS
countries
Redflow is positioned to redefine energy storage in our
target markets
4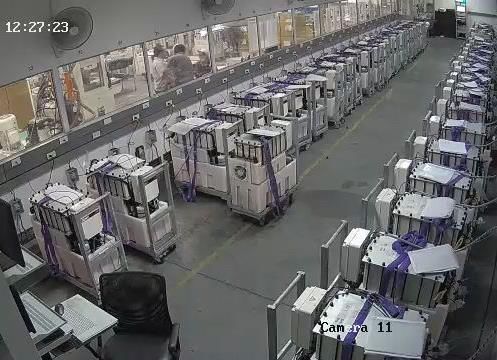
1H19 Key Highlights

                      • Thailand factory now established and producing high quality batteries
     Scalable         • Produced 150 batteries in Dec 18.
     Manufacturing    • Scalable model for immediate demand (250 batteries/month). Moderate capex to
                        scale factory to 54 MWh facility
                      • 30% Cost-down program underway and ISO9001 accreditation targeted for June 2019

                      • Momentum growing - initial orders across telco, commercial and industrial and micro
                        grid markets
     Customer &       • Attractive and growing sales pipeline – targeting volume opportunities following initial
     Markets            deployment
                      • Ability to extend current customer and partner ecosystem into adjacent markets and
                        customers
                      • Revamped Board and management team focused on commercialisation
                      • Managing Director, Chief Commercial Officer, CFO and Chief Deployment Officer
     Board &
                        recruited in last 12m
     Management
                      • Directors with deep technology and manufacturing experience recruited Sept/Oct 2018
                      • Investment in core capabilities required for sales growth and customer support

                      • Ongoing investment in R&D to maintain industry leadership and battery
     Technology         performance
     Leadership       • Key projects include Gen3 stack, new electronics and tank design – 30% cost down
                      • Additional innovation launched – standby power mode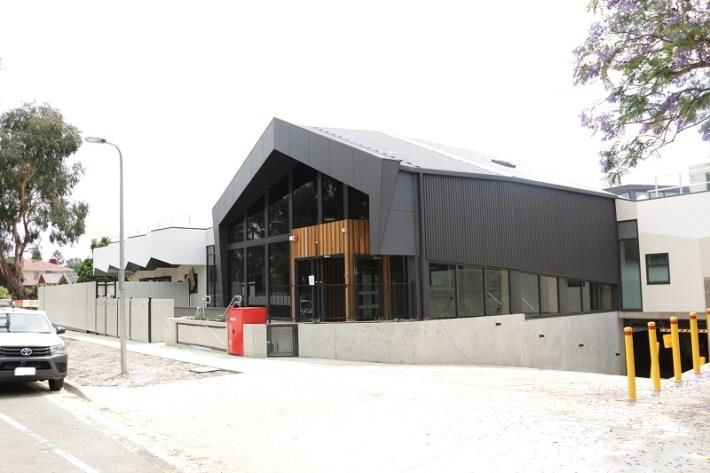
Manufacturing Update

                       6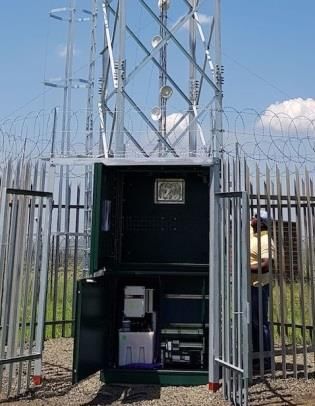
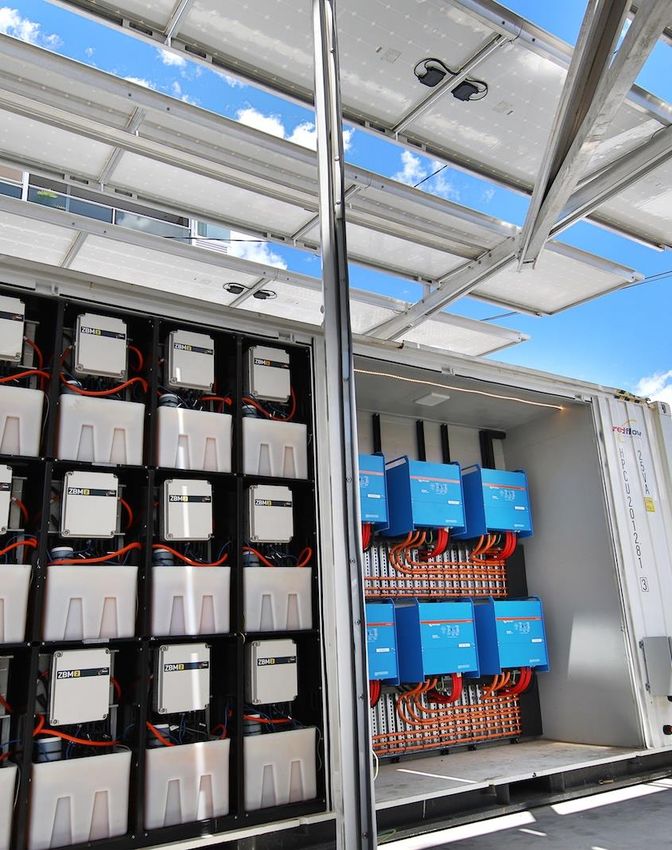
An Established Manufacturing Base with Scalability

• Relocation of facilities to Thailand completed in
  April 2018
• Ownership ensures supply chain control, end to end
  quality assurance, scalability and flexibility to meet
  demand
• Clear benefits emerging from in-house manufacturing
  as production ramps up
• ISO9001 program underway – target completion June
  2019
• Currently 75 FTE
• Model scalable to meet demand whilst delivering
  productivity and cost down benefits.
• Facility now proven at 150 batteries/month. Scale to
  250 /month only requires double shift in selected
  processes (30 MWh)
• Current focus to scale volume and reduce cost – key
  engineering and productivity projects underway to
  deliver 30% cost down in 2019
• Moderate levels of capex required to reach ~450          Production    Quality    Health and
  batteries /month (54 MWh) ($ 2-3M)                          Yield     Assurance     Safety

                                                                                                 7
Commercialisation Strategy

                             8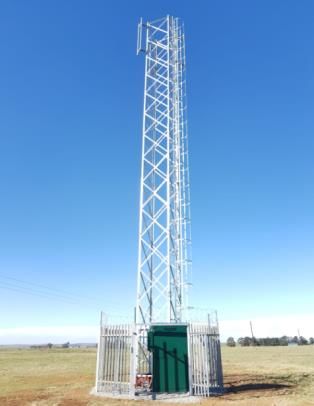
Redflow Zinc-Bromine Flow Battery Advantages

                                                     Ability to utilise 100% of the battery’s
        Ability to fully empty - with no damage!
                                                     stored energy capacity all the time

        Ability to turn off the battery without      Ability to “park” a system at any state of
  OFF
        degradation                                  charge and use it as required                P

        No electrochemical degradation at 15 - 50C
                                                     Lower total cost of ownership and
        battery operating temperature, no air
                                                     operation, especially in warm climates.
        conditioning required

                                                     Reduced need for fire suppression costs
   ✘
        Not susceptible to thermal runaway           and less hazardous at locations with
                                                     valuable infrastructure

                                                                                                      9
Redflow Zinc-Bromine Flow Battery Customer Benefits
Higher energy
density and lower
Balance of Plant
costs than Vanadium Excellent temperature
or Lead-acid tolerance means lower
air-conditioning OpEx
Remote monitoring
in warm climates
1 reduces operating &
2 maintenance costs
Potential for late-life
3 refurbishment & re-
Long cycle-life and 100% 4 conditioning to extend
useable energy deliver 5 operational life
competitive levelized
Non-flammable 6
cost of energy
electrolyte reduces 7
fire suppression costs Significant
opportunities for
8
upfront cost Simple recovery & reuse
reduction from of chemistry significantly
growth and scale lowers end-of-life costs
compared with lithium
Current Planned Future
101H19 Commercial Highlights – Momentum Building
Commercial and
Telco Residential
industrial / Microgrid
Off-grid or backup power supply Reduce energy costs by replacing/ On-grid or off-grid solutions for
requirements for remotely supplementing grid power and greater energy independence,
located telco towers. Leverages avoiding demand tariffs through solar self-consumption and
renewable energy generation and storing off peak energy backup. Often multi-battery sites.
mitigates theft
Australian Telco Australian Local Government High value deployments
Optus –Optus has ordered six Knox City Council has built two Emerging partner eco-system in all
ZBM2s for mobile phone tower in state-of-the-art children’s centres Australian states
environmentally sensitive Daintree in eastern Melbourne, each with 16 New training and certification
rainforest ZBM2 batteries program supports partners
South African Telco Microgrid in Thailand Ongoing dialogue with local
Leading telco - 37 ZBM2s order to Thai Government-backed energy governments and industry bodies
power remote mobile phone storage project has 10 x ZBM2 around participation in state
towers for leading South African batteries (100 kWh) supplying battery programs
telco energy for off-grid village in
mountainous northern Thailand
11Drivers for Redflow’s Telco Strategy
• High power costs are a major factor that Redflow’s batteries help mitigate
• Increase in infrastructure-sharing, core data growth and 5G expected to drive power and sites growth
• Battery theft a major issue in some markets – cost, uptime and revenue impacts
• Redflow features versus alternative technologies valued by target customers in key markets
4
3
Target ongoing
orders in next 12m 2
1
Field Deployments
Initial Orders
1 Extending current business with current end
End Customer Engagement users beyond current deployments
Partnerships 2 Replicate with other customers in same
markets e.g. other telcos in South Africa
Growth >4% 6% 9% 8.5%
3 Extend with partners and end customers into
Size 127k 15k 4.4k 286k adjacent territories
Sub Saharan NZ & South East 4 Step out opportunities in new strategic
Market Australia markets – e.g. China, India and other growth
Africa Pacific Asia market (Global Market Size 4.4 Million
Towers).
Major activity in last 1H19
Figures calculated from TowerXchange data, and internal company research.
12Spotlight on South Africa
• Eskom – National electricity utility in crisis leading
to widespread load shedding and black outs
• World Bank identified Eskom as a major risk to
economic growth
• >28k cell towers in South Africa nationwide growing
at 4% p.a.*
• Mobile towers targeted by criminals - diesel,
batteries, copper, and equipment theft
• Telco operator costs include repair and replacement
costs, loss of revenue, security costs, emergency
• Long standing local partner with Specialised Solar
services uptime and network quality/uptime
Systems
• Redflow batteries deployed in South Africa since
2016
• November 2018 initial 37 battery order for new build
telco sites for delivery through March 2019 to address
theft issue – weight and limited value of components
• Current discussions with mobile operator for
expansion into existing sites – diesel run time
reduction and stand by power applications
• Additional opportunities being pursued in South
Africa around in micro-grids and grid scale storage
* Source: TowerXChange.com
13Look Forward C&I & Minigrid strategy
• Next phase of solar growth is expected to be mid-size C&I deployments: Business cases for solar, and increasingly
storage, possible due to high electricity costs, peak tariffs and unreliable supply. Objective to expand recent deployment
with local government and corporates into adjacent applications, customers and industries
• Minigrids for community electrification in developing economies present a very substantial opportunity. An estimated
1.3 billion people (approximately 1/5 of the world’s population) lack access to reliable electricity at home. Solar mini-
grid projects in Africa and Asia is expected to grow from 3k installations in 2017, to over 31k by 2023*
• Future step out opportunities such as participation in India’s electrification program - 235M people**
Target ongoing
orders in next 12m
Knox Children and Family
Centre, Wantirna South Field Deployments
Initial Orders
End Customer Engagement
Partnerships
Region Australia NZ/Pacific Africa SE Asia
Market C&I Minigrid
Ban Pha Dan, Thailand Major activity in last 1H19
* Calculated from data provided by ‘The Economist.’
*** From Institute of transformative Technologies, ‘Achieving Universal Electrification in India – A roadmap for rural solar mini-grids.’ 141H19 Financials
15Profit & Loss
Revenue for the period was $502k down 58% on the
prior corresponding period (pcp) with a reported
Loss after Income Tax of $4,912k up 27% on pcp. $kaud H1 FY19 H1 FY18
The results were driven primarily by: Revenue 502.8 1,198.9
• A reduction in sales activity as the result of the Other Income 1,751.6 2,131.4
transfer of manufacturing to Thailand and the
subsequent time required to ramp up production Expenses
in the new facility
Raw Materials and Consumables Used 1,469.9 2,609.2
• Revenue does not include ~60 batteries ordered
but not yet delivered due to customer readiness.
Other Expenses 5,696.7 4,576.4
• The Thai factory completed the first full battery in
June: During December, the factory produced 150 Loss before Income Tax (4,912.2) (3,855.3)
batteries
Income Tax Expense 0.0 13.1
• Ramp-up production processes still being
optimised Loss after Income Tax (4,912.2) (3,868.4)
• The expensing of freight for inwards bound
Other Comprehensive Income (18.4) 1.9
materials and relocation of finished goods to
Australia rather than capitalising into inventory Total Comprehensive Loss Half Year (4,930.6) (3,840.2)
• The investment in personnel to drive the next
stage of business growth
16Balance Sheet
$kaud 31 Dec 18 30 June 18
Current Assets: Current assets
Cash and cash equivalents 7,856.8 17,732.8
The Net cash position of $7,857k is down 56% from Trade and other receivables 69.7 253.9
prior comparison period (pcp). Inventories 7,013.0 4,066.2
Other current assets 2,322.5 520.6
This is partially offset by the Increase in Inventory, Total current assets 17,261.9 22,573.6
both Raw Materials $5,217k up 11% and Finished Goods Non-current assets
$2,748k up 792% from 30 June 2018. Property plant and equipment 1,213.8 1,024.2
Intangible assets 617.9 629.1
Finished Goods include batteries for orders previously Total non-current assets 1,831.7 1,653.3
announced where the customer is not ready for Total Assets 19,093.6 24,227.0
Current liabilities
delivery yet. It is anticipated these will occur over the Trade and other payables 857.9 848.1
next 2 Quarters. Other current liabilities 474.5 465.1
Provisions 1,615.9 1,938.9
Other Current Assets are $2,322k up 346% from 30 Total current liabilities 2,948.2 3,252.1
June primarily being the accrued receivable for the Non-current liabilities
R&D Tax Incentive rebate. These funds were received Provisions 226.4 187.8
in January 2019. Total non-current liabilities 226.4 187.8
Total liabilities 3,174.7 3,439.9
Non Current Assets: NET ASSETS 15,918.9 20,787.0
Are $1,832k up 11% from pcp primarily being Equity
investments in production equipment for the Contributed equity 111,305.5 111,300.9
Thailand facility. Reserves 3,354.4 3,314.8
Accumulated losses (98,741.0) (93,828.7)
TOTAL EQUITY 15,918.9 20,787.0
17Cash Flow
Net cash (outflows) from operations $kaud H1 FY19 H1 FY18
was $9,471k, and increase of $3,554k Cashflows from operating activities
from the prior comparison period Receipts from customers 613.1 929.5
(pcp) and is reflective of the change Payments to suppliers and employees (10,200.3) (6,858.2)
in the business from the pcp, being: Grants R&D tax incentive received
• Moving from outsourced/ Interest received 125.4 36.1
contract manufacture to in- Interest and finance charges paid (9.3) (11.7)
house manufacturing and the Income tax paid (13.1)
required increase in Inventory, Net cash (outflows) from operating activities (9,471.1) (5,917.4)
both raw materials and finished Cashflows from investing activities
goods Payment for property plant and equipment (351.9) (62.1)
• The investment in ramping up Payments for intangible assets (73.3) (56.9)
production levels with the Net cash(outflows) from investing activities (425.2) (119.0)
purchase of long lead time raw Cashflows from financing activities
materials Proceeds from capital raising 9,856.0
Net cash (outflows) from investing Net cash (outflows) from financing activities 9,856.0
activities was $425k compared to
$119k for the pcp once again Net increase / (decrease) in cash and cash equivalents (9,896.3) 3,819.6
reflective ongoing investment in our Effects of currency translation 20.2 (11.9)
in-house manufacturing capability Cash and cash equivalents at beginning of half year 17,732.8 2,699.5
Cash and cash equivalents at end of half year 7,856.8 6,507.2
18Key Priorities for 2H19
Sales and Business Development
• Develop and secure regular volume orders for the telco sector
• Target 1-2 further lighthouse projects for commercial and industrial sectors
• Progress discussions for participation in Government subsidy programs for
residential product
• Increase qualified partners in Australia and Asia Pacific
Manufacturing
• Regularly producing 250+ batteries per month from current facility to 30 MWh
p.a, matched to sales demand
• Execute on incremental improvement plans to increase yield
• Execute on ISO 9001 certification program for Thai factory
• Finalise demand driven scale plan for up to 54 MWh per annum
• Develop plan and options to achieve volume production to 120 MWh
Engineering
• Execute on cost reduction program to end 2019
• Finalise development of single stack Gen 3 battery
Supply Chain
• Diversify and expand quality supplier base
• Reduce lead times on long lead time materials
New Markets
• Progress potential partnership opportunities in China
• Explore step out opportunities in other markets
19Platform now in Place to Deliver on Growth Strategy
The H1 FY19 results demonstrate Redflow has emerged from a two-year turnaround with the capabilities and
momentum to position the Company for future commercial success
1. We now have batteries ready to meet current sales pipeline and a moderate order ramp up
2. At current price (USD$~7k) and monthly volume at ~130 batteries/month we achieve a positive Gross Margin
3. Executing key engineering programs to drive 30% cost down on manufacture costs + volume supply discounts
4. Current batteries in stock will allow us to moderate working capital requirements over the next 6 months
5. Volume increases and efficiency projects will generate production yield benefits
6. R&D remains core element of Redflow shareholder value – AUD$~4m investment
7. Leadership team in place – board and management - to delivery on opportunities available
8. Limited further SG&A cost required to reach 250+ batteries per month (30 MWh p.a.)
9. Plan for 450+ batteries / month in development (54 MWh p.a.) – est. capex AUD$2-3m
10.Exciting global addressable market opportunity available with focus on immediate prospects
ZBM2 batteries at Ban
Pha Dan in Thailand:
Microgrid opportunity
in developing nations
20Appendices
21Board of Directors
Brett Johnson Jenny Macdonald David Knox John Lindsay David Brant
Non-Executive Chairman Non-Executive Director Non-Executive Director Non-Executive Chairman Non-Executive Chairman
Over 10 Years Director & Chair of Audit Previous CEO and MD of Previously held senior An experienced
experience of listed Committee Santos Ltd. from 2008- technology leadership businessman with
companies including Extensive experience 2015. David was also roles including CTO at strategic manufacturing
Scott Corp Ltd and working with ASX listed previously MD for BP iiNet Ltd, CTO at expertise, is a Fellow of
Helloworld Ltd. and global companies at Developments in Internode and GM of the Australian Institute
Over 25 years experience CFO and general Australasia from 2003 to Chariot Internet. John is of Company Directors
as General Counsel of management level. 2007 and worked for BP a director with more than two
listed Australian Jenny currently serves as in the U.K. and Pakistan. of the Australian decades of
companies, including a Non-Executive Director Telecommunication manufacturing and
Qantas Airways. on the Boards of API Industry Ombudsman corporate experience in
Ltd., Redbubble Ltd. and Ltd and of Uniti Wireless Australia and countries
Bapcor Ltd. Ltd. in Asia.
22Management Team and Technical Experts
Tim Harris Richard Aird Trudy Walsh Dr. Mike Giulianini
Chief Executive Chief Operating Chief Financial Chief Technology
Officer & Managing Officer Officer Officer
Director
Tim McTaggart Ben Shepherd Simon Hackett Dr. Alex Winter
Chief Deployment Chief Commercial System Integration Consulting Engineer
Officer Officer Architect
23ZBM2 Technical Specifications
ZBM2 Technical Specifications
Voltage 48 Volt DC nominal batteries (typical operating range 40-
60V)
Capacity Maximum 10kWh energy output per daily cycle
No reserved battery capacity requirement – full 10kWh cycle
depth available
Dimensions 845 L x 823 H x 400 W (mm)
33 L x 32 H x 16 W (in)
Weight 240 kg (530 lb) with electrolyte
90 kg (198 lb) without electrolyte
Electrolyte volume 100 L (26Gal)
Energy efficiency 80% DC-DC Max
Internal (electrolyte) Operating electrolyte temperature range of 15°C to 50°C
operating temperature (59°F to 122°F), ZBM2 can typically operate at ambient
temperatures outside this range for extended periods
Communication MODBUS RS485
* 1 Values reported for ZBM2 at 100% state of health (SOH)
Safety data sheet DG Class 8 for electrolyte
and room temperature
Power rating 3kW (5kW peak) * 2 Redflow internal testing shows a 5kW supply for
3kW continuous: current up to 75A (40V disconnection approximately 45 minutes before disconnection, for a ZBM2
point) *1 starting at 100% state of charge (SOC)
5kW duration depending on the State of Charge (SOC): * 3 See full warranty document for details, Terms and
current up to 125A (40V disconnection point) *1, 2 Conditions apply
Regulatory compliance marks CE and RCM
Warranty 36,500 kWh of energy delivered or 10 years (whichever
comes first) *3
No cycle depth limitations – battery performance and
lifetime is not sensitive to cycle depth Source: https://redflow.com/products/redlow-zbm2/
24You can also read