REGIONAL MOBILITY MAPPING - WEST AND CENTRAL AFRICA JUNE 2020 - Flow Monitoring
←
→
Page content transcription
If your browser does not render page correctly, please read the page content below
REGIONAL MOBILITY
MAPPING
WEST AND CENTRAL AFRICA
JUNE 2020

                          1
REGIONAL MOBILITY
MAPPING
WEST AND CENTRAL AFRICA
JUNE 2020                                                                                                  Permission is required to reproduce any part of this publication.
                                                                                                           Permission to be freely granted to educational or non-profit
                                                                                                           organizations.

                                                                                                           The opinions expressed do not necessarily reflect the views of the
                                                                                                           International Organization for Migration (IOM). The designations
                                                                                                           employed, and the presentation of material within the report do not
                                          FUNDING SUPPORT                                                  imply the expression of any opinion whatsoever on the part of IOM
                                                                                                           concerning the legal status of any country, territory city or area, or of
This report is produced by DTM Regional Support team for West and Central Africa through funding support   its authorities, or concerning its frontiers or boundaries. This
from:                                                                                                      document was produced with the financial assistance of the European
                                                                                                           Union, the Ministry of Foreign Affairs of the Netherlands, the US
                                                                                                           Government and the United Kingdom’s Department for International
                                                                                                           Development (DFID). The views expressed herein can in no way be
                                                                                                           taken to reflect the official opinion of the donors.
 This project is funded by
   the European Union                                                                                      © International Organization for Migration (IOM) January 2020

                                                                                                           IOM is committed to the principle that humane and orderly migration
                                                                                                           benefits migrants and society. As an intergovernmental organization,
                                                                                                           IOM acts with its partners in the international community to assist in
                                                                                                           meeting the operational challenges of migration, advance
                                                                                                           understanding of migration issues, encourage social and economic
                                                                                                           development through migration, and uphold the human dignity and
                                                                                                           well-being of migrants.

                                                                                                           Photo credit: Young gold minor, Guinea, 2019 © IOM Bérénice Boukaré

                                                                                                           For feedback, please contact:
                                                                                                           RO Dakar, Data & Research Division – rodakar-dataresearch@iom.int
                                                                                                           Damien Jusselme – djusselme@iom.int

                                                                                                                                                                               2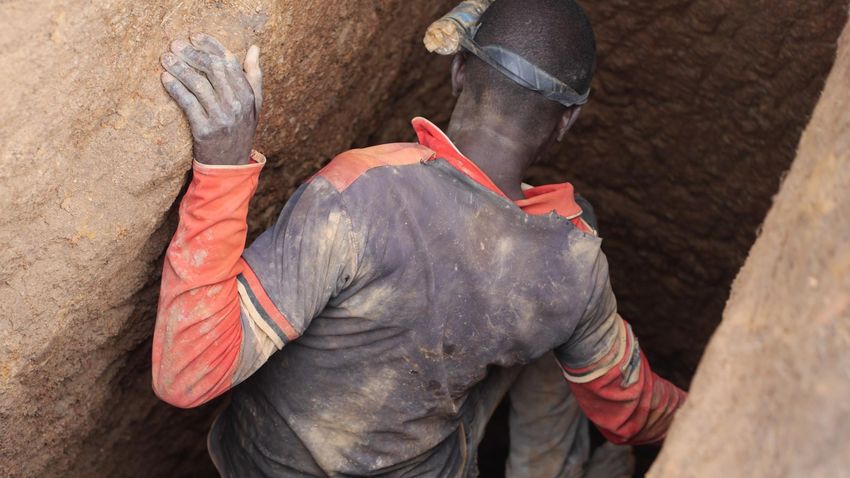
INTRODUCTION
 ABOUT THIS REPORT                                                  DATA SOURCES
 The development and implementation of policies and
                                                                    Data sources for the information displayed in this document are provided at the bottom of
 programmes in West and Central Africa promoting safe,
                                                                    each page. When reference is made to IOM data, the data was collected from: 1) Flow
 orderly and humane migration require a better
                                                                    Monitoring, 2) Mobility Tracking, 3) Interviews with individuals who benefited from voluntary
 understanding of human mobility in the region.
                                                                    returns and reintegration programs (AVRR), 4) Search and Rescue activities conducted in Niger
                                                                    and 5) Interviews with IOM Key Informants, 6) Missing Migrants Project
 Human mobility in the region take many different forms.
 Transhumance, seasonal migration conducted during the
                                                                    Further information on the data collection methodologies and on the activities referenced
 harvesting season, travel during religious festivities, tourism,
                                                                    throughout the report is available in the following documents:
 economic migration to North Africa and Europe, the search
                                                                         • Migration Data collection activities in West and Central Africa – Factsheet
 for employment in the mining industry, forced
                                                                         • Internal displacement Data collection in West and Central Africa – Factsheet
 displacements due to conflict, natural disasters or climate-
                                                                         • Products and Publication activities in West and Central Africa - Factsheet
 related migration, rural exodus, are all examples of
                                                                         • Assistance to Voluntary Return and Reintegration – Factsheet
 movements observes in West and Central Africa and show
                                                                         • DTM Monthly Regional Report - Report
 the many faceted nature of mobility in the region.
                                                                    Other data presented in this document is provided by the Ministries of the Interior of Spain,
 This document is an attempt to provide a dynamic and
                                                                    Italy and Greece, the United Nations High Commissioner for Refugees (UNHCR) and United
 regularly updated portrait of mobility within, from and to
                                                                    Nations Department of Economic and Social Affairs (UNDESA).
 West and Central Africa region, using data collected by the
 International Organization for Migration (IOM), the United
 Nations Department of Economic and Social Affairs
                                                                    CONTENT
                                                                     • INTERNATIONAL MIGRANTS                            ◦ Page 4
 (UNDESA) and the United Nations High Commissioner for
 Refugees (UNHCR).                                                   • EMIGRATION FROM WCA                               ◦ Page 5
                                                                     • MIGRATION FLOWS                                   ◦ Page 6
 The maps contained in this document are not only meant to           • MIGRATION CORRIDORS                               ◦ Page 7
 inform on ongoing mobility patterns, but also provide               • LABOUR MOBILITY                                   ◦ Page 8
 information to support direct programming (protection of            • TRANSHUMANCE                                      ◦ Page 9
 migrants, management of transhumance flows, support to
                                                                     • INTER-REGIONAL ROUTES                             ◦ Page 10
 safe returns of displaced people) and policy.
                                                                     • TRAVELLER PROFILES                                ◦ Page 11
                                                                     • INTER-REGIONAL TRENDS I                           ◦ Page 12
                                                                     • INTER-REGIONAL TRENDS II                          ◦ Page 13
                                                                     • REGIONS OF ORIGIN                                 ◦ Page 14
                                                                     • CONFLICT & DISPLACEMENT                           ◦ Page 15
                                                                     • RETURN ASSISTANCE BY IOM                          ◦ Page 16
                                                                     • IOM PRESENCE IN THE REGION                        ◦ Page 17
                                                                     • NOTE ON METHODOLOGY                               ◦ Page 18

                                                                                                                                                            3
INTERNATIONAL MIGRANTS 4
R e g i o n a l M o b i l i t y M a p p i n g i n We s t a n d C e n t r a l A f r i c a • J u n e 2 0 2 0
82% of immigrants living in West
and Central Africa are from
another country in the region
173,000
468,000
294,000
275,000
512,000
215,000
27,000 718,000
121,000
467,000
390,000
54,000
1.3 M 91,000
279,000
94,000
2.6 M
506,000
An estimated 9.5 million
2,100 migrants live in the
228,000
WCA region. The largest
registered migrant
communities in the
411,000
LEGEND region are currently
COUNTRY BORDER
DETAILS: THIS MAP PRESENTS THE STOCKS OF living in Côte d’Ivoire
(2.6 million) and Nigeria
WEST AND CENTRAL AFRICA REGION (1) IMMIGRANTS REGISTERED IN EACH COUNTRY OF
402,000
THE REGION.
MAIN ROADS
SOURCES: (1) REGION AS COVERED BY IOM
REGIONAL OFFICE. (2) UNDESA MIGRANT DATABASE 0
(1.3 million) (UNDESA).
XX NUMBER OF MIGRANTS PRESENT IN COUNTRY (2) 500 km
2019
Disclaimer: The maps in this report are for illustrative purposes only. Representations and the use of boundaries and geographical names on these maps may include
errors and do not imply judgment of the legal status of a territory, nor official recognition or acceptance of these boundaries by IOM.EMIGRATION FROM WCA 5
R e g i o n a l M o b i l i t y M a p p i n g i n We s t a n d C e n t r a l A f r i c a • J u n e 2 0 2 0
66% of emigrants from An estimated 11.9 million
WCA countries are living individuals from West and
Central Africa currently live
in another WCA country
outside their country of
origin. The countries with the
largest numbers of emigrants
128,000
1.3 M (or diasporas, nationals living
402,000 abroad) are from Burkina
Faso (1.6), Nigeria (1.4 M),
Mali (1.3 M).
643,000
118,000 206,000
666,000
121,000 1.4 M
1.6 M
104,000
187,000 767,000
383,000
971,000 543,000
219,000 1.1 M
37,000
126,000
LEGEND 47,000
239,000
COUNTRY BORDER
DETAILS: THIS MAP PRESENTS THE STOCKS OF
WEST AND CENTRAL AFRICA REGION (1) EMIGRANTS REGISTERED ORIGINATING EACH
COUNTRY OF THE REGION.
MAIN ROADS
SOURCES: (1) REGION AS COVERED BY IOM
XX NUMBER OF INDIVIDUALS CURRENTLY LIVING OUTSIDE REGIONAL OFFICE. (2) UNDESA MIGRANT DATABASE 0 500 km
THEIR COUNTRY OF ORIGIN (2) 2019
Disclaimer: The maps in this report are for illustrative purposes only. Representations and the use of boundaries and geographical names on these maps may include
errors and do not imply judgment of the legal status of a territory, nor official recognition or acceptance of these boundaries by IOM.MIGRATION FLOWS 6
R e g i o n a l M o b i l i t y M a p p i n g i n We s t a n d C e n t r a l A f r i c a • J u n e 2 0 2 0
Sabha
Tamanrasset
Madama
Inhalid
Nouadhibou
Zouarké
Arlit
Assamaka
Nouakchott
Faya
Agadez
Ménaka
Timbuktu Gao
Gogui
Dakar
Mopti
Banjul
Tambacounda Abéché
Niamey
Sokoto
Bamako
Bissau Ouagadougou N’Djamena
Kano
Bobo-
Dioulasso
Kankan
Conakry
Abuja
Freetown
Bouaké
Lagos
Kumasi
Monrovia Yamoussoukro
Porto-Novo
Lomé
Abijdan Accra
Aba
Douala Bangui
Malobo
Yaoundé
An estimated 80 to
90% of migration
Libreville
LEGEND Sao Tome
COUNTRY BORDER
DETAILS: THIS MAP PRESENTS THE MAIN MIGRATION
ROUTES IN WEST AND CENTRAL AFRICA. flows in West and
WEST AND CENTRAL AFRICA REGION (1) SOURCES: (1) REGION AS COVERED BY IOM REGIONAL
OFFICE. (2) ROUTES DRAWN BASED ON DISCUSSIONS
Central Africa are
DEMOCRATIC REPUBLIC OF THE CONGO
MAIN ROADS WITH MIGRANTS AND KEY INFORMANTS SURVEYS
CONDUCTED WITH NATIONAL AND LOCAL
internal to the
MAIN MIGRATION ROUTES (2) AUTHORITIES IN VARIOUS COUNTRIES OF THE REGION.
(3) ESTIMATES BASED ON UNDESA 2019, FMP DATA
Brazzaville
region(3)
CAPITAL CITIES 2019 AND ECONOMIC DEVELOPMENT IN AFRICA,
REPORT 2018 FROM UNCTAD 0 500 km
OTHER CITIES
Disclaimer: The maps in this report are for illustrative purposes only. Representations and the use of boundaries and geographical names on these maps may include
errors and do not imply judgment of the legal status of a territory, nor official recognition or acceptance of these boundaries by IOM.MIGRATION CORRIDORS 7
R e g i o n a l M o b i l i t y M a p p i n g i n We s t a n d C e n t r a l A f r i c a • J u n e 2 0 2 0
Sabha
Tamanrasset
Madama
Inhalid
Nouadhibou
Zouarké
Arlit
Assamaka
Nouakchott
Faya
Agadez
Ménaka
Timbuktu Gao
Gogui
Dakar
Banjul
Tambacounda Abéché
Niamey
Sokoto
Bamako
Bissau Ouagadougou N’Djamena
Kano
Bobo-
Dioulasso
Kankan
Conakry
Abuja
Freetown
Bouaké
Lagos
Kumasi
Monrovia Yamoussoukro
Porto-Novo
Lomé
Abijdan Accra
Aba
Douala Bangui
Malobo
Yaoundé
Intraregional mobility
mainly takes place
LEGEND
Sao Tome
Libreville
along two MAIN
EAST-WEST AXES
COUNTRY BORDER
WEST AND CENTRAL AFRICA REGION (1)
MAIN ROADS
DETAILS: THIS MAP PRESENTS THE MAIN MIGRATION
ROUTES AND AXES IN THE WEST AND CENTRAL
and are then
MAIN AXES (2)
AFRICA REGION. distributed over
ancillary routes.
SOURCES: (1) REGION AS COVERED BY IOM REGIONAL
OTHER AXIS (2)
OFFICE. (2) ROUTES DRAWNS BASED ON DIRECT
DISCUSSIONS WITH MIGRANTS AND KEY INFORMANTS Brazzaville
CAPITAL CITIES
SURVEYS CONDUCTED WITH NATIONAL AND LOCAL 0 500 km
OTHER CITIES AUTHORITIES IN VARIOUS COUNTRIES OF THE REGION.
Disclaimer: The maps in this report are for illustrative purposes only. Representations and the use of boundaries and geographical names on these maps may include
errors and do not imply judgment of the legal status of a territory, nor official recognition or acceptance of these boundaries by IOM.LABOUR MIGRATION 8
R e g i o n a l M o b i l i t y M a p p i n g i n We s t a n d C e n t r a l A f r i c a • J u n e 2 0 2 0
Sabha
Tamanrasset
Madama
Inhalid
Nouadhibou
Zouarké
Arlit
Assamaka
Nouakchott
Faya
Agadez
Ménaka
Timbuktu Gao
Gogui
Dakar
Banjul
Tambacounda Abéché
Niamey
Sokoto
Bamako
Bissau Ouagadougou N’Djamena
Kano
Bobo-
Dioulasso
Kankan
Conakry
Abuja
Freetown
Bouaké
Kumasi
Lagos
MAIN SECTORS ATTRACTING MIGRATION
Monrovia Yamoussoukro
Porto-Novo
Lomé Farming
Abijdan Accra Services (auto repairs,
Aba
housekeeping, etc.)
Douala Bangui
Fishing
Malobo
Yaoundé
Mining
Forestry
LEGEND
Sao Tome
Libreville
Intraregional mobility is largely driven
COUNTRY BORDER
WEST AND CENTRAL AFRICA REGION (1)
DETAILS: THIS MAP PRESENTS THE MAIN MIGRATION
ROUTES IN WEST AND CENTRAL AFRICA AND LABOUR
by employment opportunities in
MAIN ROADS
INTENSIVE AREAS ATTRACTING LARGE MIGRATION
FLOWS
labour intensive areas. Favoured DEMOCRATIC REPUBLIC OF THE CONGO
MAIN MIGRATION ROUTES (3) SOURCES: (1) REGION AS COVERED BY IOM REGIONAL
OFFICE. (2) BASED ON DISCUSSION WITH VARIOUS IOM
destinations for labour migration
MAIN DESTINATION FOR LABOUR MIGRANTS (2) OFFICES AND SECONDARY DATA REVIEW, (3) DIRECT
DISCUSSIONS WITH MIGRANTS AND KEY INFORMANTS
vary depending on the season.
Brazzaville
CAPITAL CITIES SURVEYS CONDUCTED WITH NATIONAL AND LOCAL
0 500 km
AUTHORITIES IN VARIOUS COUNTRIES OF THE REGION
OTHER CITIES
Disclaimer: The maps in this report are for illustrative purposes only. Representations and the use of boundaries and geographical names on these maps may include
errors and do not imply judgment of the legal status of a territory, nor official recognition or acceptance of these boundaries by IOM.TRANSHUMANCE 9
R e g i o n a l M o b i l i t y M a p p i n g i n We s t a n d C e n t r a l A f r i c a • J u n e 2 0 2 0
Sabha
Tamanrasset
Madama
Inhalid
Nouadhibou
Zouarké
Arlit
Assamaka
Nouakchott
Faya
Agadez
Ménaka
Timbuktu Gao
Gogui
Dakar
Banjul
Tambacounda Abéché
Niamey
Sokoto
Bamako
Bissau Ouagadougou N’Djamena
Kano
Bobo-
Dioulasso
Kankan
Conakry
Abuja
Freetown
Bouaké
Lagos
Kumasi
Monrovia Yamoussoukro
Porto-Novo
Lomé
Abijdan Accra
Aba
Douala
Transhumance, a form Bangui
of pastoralism which
Malobo
sees herders and their livestock migrate on
Yaoundé
LEGEND
COUNTRY BORDER
a seasonal basis between complementary
WEST AND CENTRAL AFRICA REGION (1)
ecological areas, from areas with scarce
PASTORAL ZONE (2) Libreville grazing lands and water sources to areas
Sao Tome
TRANSBOUNDARY TRANSHUMANCE ROUTE (2) with more abundant pastures and water, is
DIRECTION DURING DRY SEASON (2)
DETAILS: THIS MAP PRESENTS THE MAIN
a common occupation across West and
DIRECTION DURING WET SEASON (2)
TRANSHUMANCE AND NOMADIC ROUTES IN THE
WEST AND CENTRAL AFRICA REGION.
Central Africa which contributes DEMOCRATIC REPUBLIC OF THE CONGO
ROUTE TAKEN BY NOMADIC CARAVANS (2)
KEY TRANSIT POINTS FOR TRANSHUMANT HERDERS (2)
SOURCES: (1) REGION AS COVERED BY IOM REGIONAL significantly to human mobility in the
OFFICE. (2) ROUTES ARE TAKEN FROM FAO-CIRAD,
CAPITAL CITIES
SYSTEME D’INFORMATON SUR LE PASTORALISME AU
SAHEL, 2012 AND IOM TRANSHUMANCE TRACKING
region Brazzaville
0 500 km
OTHER CITIES TOOL (MAURITANIA, BURKINA FASO, CHAD, CAR).
Disclaimer: The maps in this report are for illustrative purposes only. Representations and the use of boundaries and geographical names on these maps may include
errors and do not imply judgment of the legal status of a territory, nor official recognition or acceptance of these boundaries by IOM.INTER-REGIONAL ROUTES 10
R e g i o n a l M o b i l i t y M a p p i n g i n We s t a n d C e n t r a l A f r i c a • J u n e 2 0 2 0
WESTERN AFRICAN ROUTE WESTERN MEDITERRANEAN ROUTE CENTRAL MEDITERRANEAN ROUTE
To Morocco To Algeria or Morocco To Tunisia To Libya or
To the Canary Tunisia
Islands, Spain
Tamanrasset
Madama
Nouadhibou
Séguédine Zouarké
Arlit
Assamaka
Nouakchott
Faya
Agadez
Ménaka
Timbuktu Gao
Gogui
Dakar
Tahoua
Kidira Sévaré
Dori
Banjul Rig-Rig
Benana Dan Issa Dan Barto
Niamey Magaria
Moussala Sokoto
Bamako
Bissau Boundoufourdou Ouagadougou Kantchari Kano N’Djamena
Kouremalé Faramana Kousséri
Nafadji Heremakono
Kankan
Yendere
Conakry
Abuja
Sarh
Freetown
Inter-regional migration routes
Lagos taken by migrants regularly shift
Yamoussoukro
Monrovia
Lomé
Porto-Novo according to changes in
Abijdan Accra
migration legislation, policies and
Bangui
LEGEND Malobo
Yaoundé
controls. However, the routes
COUNTRY BORDER themselves do not evolve much.
WEST AND CENTRAL AFRICA REGION (1)
FLOW MONITORING POINTS - ACTIVE
MAIN INTRA-REGIONAL MIGRATION ROUTES (2)
Libreville Migrants heading to North Africa
Sao Tome
WESTERN MEDITERRANEAN ROUTE (BY AIR) or Europe travel along three
WESTERN MEDITERRANEAN ROUTE (BY LAND) DETAILS: THIS MAP PRESENTS THE MAIN MIGRATION
ROUTES IN WEST AND CENTRAL AFRICA AND INTER-
main migration routes:
WESTERN AFRICAN ROUTE (MARITIME) REGIONAL ROUTES
SOURCES: (1) REGION AS COVERED BY IOM REGIONAL
1. Western African DEMOCRATIC REPUBLIC OF THE CONGO
CENTRAL MEDITERRANEAN ROUTE
MAIN ROADS
OFFICE. (2) DIRECT DISCUSSIONS WITH MIGRANTS AND
KEY INFORMANTS SURVEYS CONDUCTED WITH
0 500 km 2. Western Mediterranean
CAPITAL CITIES
NATIONAL AND LOCAL AUTHORITIES IN VARIOUS
COUNTRIES OF THE REGION. (3) IOM NIGER DATA (4) 3. Central Mediterranean
Brazzaville
FMP MALI AND NIGER DASHBOARDS
OTHER CITIES Disclaimer: The maps in this report are for illustrative purposes only. Representations and the use of boundaries and geographical names on these maps may include
errors and do not imply judgment of the legal status of a territory, nor official recognition or acceptance of these boundaries by IOM.TRAVELLER PROFILES 11
R e g i o n a l M o b i l i t y M a p p i n g i n We s t a n d C e n t r a l A f r i c a • J u n e 2 0 2 0
AGE (average) MARITAL STATUS EDUCATION LEVEL EDUCATION LEVEL
EUROPE
88% 49% 51%
26.4 29%
42%
10% 2% 0% 0% 3% 2%
6% 4%
Gender (distribution) 0% 2%
INTENDED DESTINATION
Male: 92% 0%
11%
0%
Female: 8% Divorced Married Single Widowed
AGE (average) MARITAL STATUS EDUCATION LEVEL EDUCATION LEVEL
61%
AFRICA
NORTH
26.9
41%
80%
27% 34%
17%
6% 2% 1% 0% 2% 1%
Gender (distribution) 4% 2% 1%
19%
Male: 90% 1% 0%
Female: 10% Divorced D
Married Single Widowed
MARITAL STATUS EDUCATION LEVEL EDUCATION LEVEL
AGE (average) 37% 35%
53% 25%
23%
30.2
21% 21%
WCA
44%
19%
3% 5%
Gender (distribution) 5% 4%
0%
1% 0%
Male: 82% 2% 1%
Female: 18% Divorced Married Single Widowed
Travellers moving within West and Central Africa, headed for North Africa, and migrating to Europe showcase significant differences in age, marital status, education level and
employment status prior to travel (in their country of habitual residence). The unemployment rate of travellers also varies according to the nature of the movements and the intended
destination: migration to a country in West and Central Africa is more likely to be conducted in response to concrete job opportunities than migration to Europe or North Africa. The
profile of travellers (individuals crossing IOM Flow Monitoring Points) by intended destination presented on this page is based on data collected during Flow Monitoring Surveys
conducted with over 27,000 travellers across the region between January and June 2020. Further information on methodology is available at the end of this document.INTER-REGIONAL TRENDS I 12
R e g i o n a l M o b i l i t y M a p p i n g i n We s t a n d C e n t r a l A f r i c a • J u n e 2 0 2 0
S PA I N (3)
I TA LY (3) GREECE (3)
8,546 ARRIVALS IN 2020 (JAN-JUNE) 6,950 ARRIVALS IN 2020 (JAN-JUNE) 9,628 ARRIVALS IN 2020 (JAN-JUNE)
2014 – XXXX 2017 – 28,707 2014 – 170,100 2017 – 119,369 2014 – XX,XXX 2017 – 35 052
2015 – 5,309 2018 – 65,325 2015 – 153 842 2018 – 23,370 2015 – 857 363 2018 – 50,125
2016 – 14,558 2019 - 32.513 2016 – 181 436 2019 - 11,471 2016 – 176,906 2019 - 70,651
Including 3,328 ARRIVALS FROM WCA (39%) Including 899 ARRIVALS FROM WCA (13%) Including 690 ARRIVALS FROM WCA (7%)
Main WCA nationalities: NAT 3: Mali (18%)
Main WCA nationalities: NAT 3: Mali (14%) Main WCA nationalities: NAT 3: The Gambia (8%)
NAT 1: Unidentified Sub- NAT 4: Côte d’Ivoire (17%)
NAT 1: Côte d’Ivoire (34%) NAT 4: Nigeria (8%) NAT 1: Rep of Congo (39%) NAT 4: Nigeria (6%)
Saharan (26%) NAT 5: Senegal (11%)
NAT 2: Guinea (14%) NAT 5: Senegal (7%) NAT 2: Cameroon (21%) NAT 5: Ghana (6%)
NAT 2: Guinea (22%)
To Tunisia To Libya or
To Morocco To Algeria or Morocco Tunisia After dropping in 2018 and 2019,
To the Canary arrivals to Europe from West and
Islands 51
Tamanrasset
Central Africa stabilized in 2020. In
2018-2020, Spain was the main arrival
89 255 country for migrants using both the
Madama
Western African and Western
Nouadhibou
Mediterranean routes. Migrants often
Séguédine Zouarké
travel along perilous and isolated
Assamaka
Arlit
routes, oftentimes crossing the desert
Nouakchott
and making dangerous
Faya
sea crossings to
Ménaka
Agadez reach Europe.
Timbuktu Gao LEGEND
Gogui COUNTRY BORDER
Dakar
Tahoua
Kidira Sévaré WEST AND CENTRAL AFRICA REGION (1)
Dori
Banjul Rig-Rig
Benana Dan Issa Dan Barto DEATHS/DISAPPEARANCE OF MIGRANTS (2)
Niamey Magaria
Moussala Sokoto
Bamako MAIN INTERREGIONAL MIGRATION ROUTES (2)
Bissau Boundoufourdou Ouagadougou Kantchari Kano N’Djamena
Kouremalé WESTERN MEDITERRANEAN ROUTE (BY AIR)
Faramana Kousséri
Nafadji Heremakono
WESTERN MEDITERRANEAN ROUTE (BY LAND)
DETAILS: THIS MAP PRESENTS THE NUMBER OF Kankan
ARRIVALS TO EUROPE BY YEAR AND BY Yendere WESTERN AFRICAN ROUTE (MARITIME)
DESTINATION (GREECE, ITALY AND SPAIN) AS
Conakry
WELL AS THE NATIONALITIES OF INDIVIDUALS CENTRAL MEDITERRANEAN ROUTE
Abuja
Sarh MAIN ROADS
SOURCES: (1) REGION AS COVERED BY IOM
Freetown
REGIONAL OFFICE. (2) DATA FROM THE MISSING
MIGRANT PROJECT, MOSTLY PROVIDED BY THE CAPITAL CITIES
MIXED MIGRATION CENTER (2019). (3) SPAIN, Lagos
ITALY AND GREECE DATA (JUNE 2020) PROVIDED OTHER CITIES
Monrovia Yamoussoukro
BY IOM AND GOVERNMENT SOURCES Porto-Novo Disclaimer: The maps in this report are for illustrative purposes only. Representations and the use of boundaries and geographical names on these maps may include
Lomé errors and do not imply judgment of the legal status of a territory, nor official recognition or acceptance of these boundaries by IOM.INTER-REGIONAL TRENDS II 13
R e g i o n a l M o b i l i t y M a p p i n g i n We s t a n d C e n t r a l A f r i c a • J u n e 2 0 2 0
TOTAL ARRIVALS IN GREECE AND PROPORTION OF WCA NATIONALS
900 000 100%
800 000 90%
700 000 80%
600 000 70%
60%
500 000
857 363 50%
400 000
40%
300 000
176 906 50 125 30%
200 000 35 052 71 386
9% 7% 9 361 20%
3% 5%
100 000 1% 1% 10%
- 0%
2015 2016 2017 2018 2019 2020
TOTAL ARRIVALS IN ITALY AND PROPORTION OF WCA NATIONALS
200 000 100%
180 000 90%
160 000 80%
140 000 60% 70%
120 000 60%
100 000 47% 50%
37% 181 436
80 000 40%
60 000 153 842 119 369 20% 21% 30%
LEGEND: 13%
40 000 6 950 20%
XX # OF ARRIVALS 20 000 10%
23 370 11 471
0 0%
% OF ARRIVALS OF WCA
X% 2015 2016 2017 2018 2019 2020
NATIONALS
TOTAL ARRIVALS IN SPAIN AND PROPORTION OF WCA NATIONALS
DETAILS: THIS PAGE
PRESENTS THE NUMBERS OF 70 000 100%
ARRIVALS TO EUROPE BY 90%
60 000
MAIN COUNTRY OF ARRIVAL 71% 80%
(GREECE, ITALY, SPAIN), 50 000 60% 70%
YEAR, AND PROPORTION OF
WEST AND CENTRAL 40 000 49% 60%
43% 40% 50%
AFRICAN NATIONALS 65 325
30 000 40%
SOURCES: National 28%
Government of Spain, Italy 20 000 30%
and Greece as well as IOM 28 707 32 513 20%
and UNHCR data were used 10 000
14 558 10%
for this infographic. 5 309 8 546
0 0%
2015 2016 2017 2018 2019 2020
Migrant and refugee arrivals to Europe have changed significantly between 2015 and 2020. In 2015, an estimated 857,363 migrants and refugees reached Greece, with only 1%
originating from West and Central Africa (WCA). The share of migrants from WCA amongst arrivals to Greece then steadily increased, reaching 9% in 2018, before dropping back to 5%
in 2019. Arrivals of WCA nationals in Italy were stable in 2018-2019 (respectively 20% and 21%) but have dropped significantly since 2016 (60% of arrivals in 2016 were WCA nationals).
The share of WCA nationals amongst migrant and refugee arrivals to Spain witnessed some fluctuations between 2015 and 2020, and witnessed a sharp decreased between 2018 (71%
of all arrivals in Spain, the highest observed in the 2015-2019 time period) and 2019 (43%) and 2020 (40%).REGIONS OF ORIGIN 14
R e g i o n a l M o b i l i t y M a p p i n g i n We s t a n d C e n t r a l A f r i c a • J u n e 2 0 2 0
MAIN REGIONS OF ORIGIN OF Sabha
MIGRANTS ASSISTED BY IOM
1 – 138
139 – 555 Tamanrasset
556 – 1,519
1,520 – 3,438
3,439 – 6,115 Madama
Inhalid
Nouadhibou
Zouarké
Arlit
Assamaka
Nouakchott
Faya
Agadez
Ménaka
Timbuktu Gao
Dakar Gogui
Mopti
Abéché
Niamey
Sokoto
Ouagadougou
Bissau
Bobo-
Dioulasso
Conakry
Abuja
Freetown
Bouaké
Lagos
Yamoussoukro Kumasi
Monrovia
Porto-Novo
Lomé
Aba
Bangui
Malobo
Yaoundé
The regions of origin of migrants
LEGEND
heading to North Africa or Niger
(with the intention to leave the
COUNTRY BORDER Libreville
(1)
Sao Tome
WEST AND CENTRAL AFRICA REGION
MAIN ROADS
region) are varied. This data is based
MAIN MIGRATION ROUTES
on a question on regions of origins
CAPITAL CITIES
DETAILS: THIS MAP PRESENTS THE MAIN MIGRATION asked to IOM migrants assisted to
ROUTES, REGIONS OF ORIGIN AND DESTINATIONS OF
OTHER CITIES MIGRANTS IN WEST AND CENTRAL AFRICA return upon their return in their
MAIN AREAS OF ORIGIN OF MIGRANTS (2)
SOURCES: (1) REGION AS COVERED BY IOM REGIONAL
OFFICE. (2) DATA FROM RO DAKAR ON ORIGINS OF
country
Brazzaville of origin
0 500 km
Admin ADMIN LEVEL OF AREA OF ORIGIN (2) MIGRANTS ASSISTED TO RETURN 2017-2020 (AVRR).
Disclaimer: The maps in this report are for illustrative purposes only. Representations and the use of boundaries and geographical names on these maps may include
errors and do not imply judgment of the legal status of a territory, nor official recognition or acceptance of these boundaries by IOM.C O N F L I C T A N D I N T E R N A L D I S P L AC E M E N T 15
R e g i o n a l M o b i l i t y M a p p i n g i n We s t a n d C e n t r a l A f r i c a • J u n e 2 0 2 0
Sabha
Nearly 7 million individuals are currently
internally displaced across West and
Tamanrasset
Central Africa, including more than 6.4
million displaced by conflict and insecurity,
to which an additional 550,000 were
Madama
Nouadhibou
Inhalid displaced by natural disasters (floods,
landslides...)(4)Zouarké
. The regions of origin of
Assamaka
Arlit migrants assisted to return and areas of
Nouakchott ongoing conflict, violence
Faya
and insecurity do
Agadez not necessarily overlap.
Ménaka
Timbuktu Gao
Gogui MALI NIGER
NIGER (Diffa)
231k CHAD
Mopti (Tahoua)
108k
BURKINA 140k
Niamey
236k Abéché
FASO NIGERIA
Sokoto
Ouagadougou (NORTH
Bissau
Bobo- 979k CENTRAL)
Dioulasso 578k NIGERIA
(NORTH-EAST) CAMEROON
(FAR-NORTH)
Kankan
2.1 M 321k
Conakry
Abuja
Freetown
Bouaké
Lagos
Yamoussoukro
Monrovia
Kumasi CENTRAL
Lomé
Porto-Novo AFRICAN
REPUBLIC
Aba
CAMEROON 685k
(SOUTH WEST & Bangui
Malobo NORTH WEST)
679k Yaoundé
LEGEND Libreville
DETAILS: THIS MAP PRESENTS THE MAIN REGIONS OF Sao Tome
COUNTRY BORDER
ORIGINS OF MIGRANTS, CONFLIT AREAS AND NUMBER
WEST AND CENTRAL AFRICA REGION (1) OF IDPs CAUSED BY THOSE CONFLICTS
MAIN ROADS SOURCES: (1) REGION AS COVERED BY IOM REGIONAL
OFFICE. (2) BASED ON REPORTS FROM IOM FIELD OFFICES
CAPITAL CITIES AND ACLED DATABASE. (3) CALCULATION OF THE 2020
NUMBER OF IDPS IN WEST AND CENTRAL AFRICA BASED
OTHER CITIES ON A COMBINATION OF SOURCE : NATIONAL
GOVERNMENTS, IDMC, IOM, UNHCR. (4) SOME
Brazzaville
CONFLICT, VIOLENCE AND INSECURITY (2) DISPLACEMENT SITUATIONS ARE NOT REPRESENTED ON
THE MAP: COTE D’IVOIRE (330,000 IDPS) AND THE 0 500 km
Xk INTERNAL DISPLACEMENT (in thousands) (3) REPUBLIC OF CONGO (134,000 IDPS) Disclaimer: The maps in this report are for illustrative purposes only. Representations and the use of boundaries and geographical names on these maps may include
errors and do not imply judgment of the legal status of a territory, nor official recognition or acceptance of these boundaries by IOM.RETURN ASSISTANCE BY IOM 16
R e g i o n a l M o b i l i t y M a p p i n g i n We s t a n d C e n t r a l A f r i c a • J u n e 2 0 2 0
Individuals assisted in their voluntary return (AVR) to WCA MAIN SENDING COUNTRIES
(2017-2020)
2017 28,361
NIGER 42,889
2018 36,578
LIBYA 42,659
2019 29,669
MOROCCO 4,377
2020 8,217 MALI 3,432
43 OTHER 9,468
19,317
8,436
6,747
528
4,976
3,111
17,973
745
1,328
1,735
18,573
3,864
8,032 540 237
2,001
IOM is assisting migrants stranded
4,413 who wish to go home. In 2017-20,
nearly 102,825 migrants benefited
from IOM assistance, often
conducted through the EU-IOM
Joint Initiative on Migrant
25
Protection and Reintegration, a
LEGEND
DETAILS: THIS MAP PRESENTS MIGRANTS’ ORIGINS
AND MAIN RETURN ASSISTANCE PROVIDED BY IOM comprehensive programme to save
COUNTRY BORDER SOURCES: (1) IOM MISSIONS CURRENTLY lives, protect and assist migrants
IMPLEMENTING EU TRUST FUND ACTIVITIES. (2)
218
WEST AND CENTRAL AFRICA + LIBYA (EUTF) (1) ROUNDED UP FIGURES FOR STRANDED AND along key migration routes in
VULNERABLE MIGRANTS SUPPORTED BY IOM WITH
XX ASSISTANCE TO VOLUNTARY RETURNS 2017-2020 (2) THEIR VOLUNTARY RETURN IN 2017 AND 2020 Africa.
(JANUARY TO JUNE). 0 500 km
MAIN ROADS
Disclaimer: The maps in this report are for illustrative purposes only. Representations and the use of boundaries and geographical names on these maps may include
errors and do not imply judgment of the legal status of a territory, nor official recognition or acceptance of these boundaries by IOM.IOM PRESENCE 17
R e g i o n a l M o b i l i t y M a p p i n g i n We s t a n d C e n t r a l A f r i c a • J u n e 2 0 2 0
IOM counts 20 country offices
LEGEND in West and Central Africa as
COUNTRY BORDER well as more than 45 sub-offices.
IOM COUNTRY OFFICES (1)
Transit centers, Migrants
IOM SUB-OFFICES (1)
Resources Centers and shelter
for victims of trafficking and
TRANSIT CENTER (1)
MRC (MIGRANTS RESOURCE CENTER) (1)
UMC (UNACCOMAPNIED MIGRANT CHILDREN) SHELTER (1) DETAILS: THIS MAP SHOWS THE LOCATIONS OF IOM
unaccompanied migrant children
VOT (VICTIMS OF TRAFFICKING) SHELTER (1)
OFFICES IN THE WEST AND CENTRAL AFRICA
REGION.
are active in eight countries.
0 500 km
MAIN ROADS SOURCES: (1) IOM MISSIONS
Disclaimer: The maps in this report are for illustrative purposes only. Representations and the use of boundaries and geographical names on these maps may include
errors and do not imply judgment of the legal status of a territory, nor official recognition or acceptance of these boundaries by IOM.18
NOTE ON METHODOLOGY
This section provides additional details on data sources Senegal). Libya and Niger that have been aggregated and uses nearly
used in this report 100,000 entries dating from 2016 to 2020.
Data is collected at FMPs using two main tools: Flow
FLOW MONITORING METHODOLOGY Monitoring Registry (FMR) and Flow Monitoring Survey It does not necessarily present the origins of all migrants
(FMS). The FMR includes direct observations at places of moving in WCA and focuses on a very specific migrant
This report presents an analysis of 27,000 surveys entry, transit or exit, as well as interviews with key population (those trying to move to other regions)
conducted with mobile populations in the West and informants (including transportation workers, housing
Central Africa region between January and June 2020. workers, and migration officials) to assess movement EXTERNAL SOURCES
These surveys are part of IOM DTM's Flow Monitoring trends, routes, and countries of origin and destination. The
activities, which gather information on the numbers and FMS entails more detailed individual surveys to profile ARRIVALS IN ITALY, GREECE AND SPAIN: data presented on
characteristics of travellers observed in high mobility areas people on the move, including education levels and arrivals to Europe is taken from figures provided by Greek,
of origin, transit and destination. Surveys are conducted at skills/employment; drivers of migrations; and needs, risks Italians and Spanish national authorities. However, the
Flow Monitoring Points on a sample of travellers on a daily and vulnerabilities. This document presents an analysis of complete nationality breakdown of migrants is not
basis (travellers may or may not be nationals). The surveys conducted using the FMS tool. A similar available; only the top 10 nationalities of arriving migrants
purpose of these surveys is to collect more in-depth methodology is used in other regions (Horn of Africa and is provided. Therefore, nationality figures presented are
information on travellers, such as their nationalities, Europe) to allow for comparative analysis of flows and likely fragmented.
educational and vocational backgrounds, reasons for individuals’ characteristics.
departure and intended destinations. IDMC: the Internal Displacement Monitoring Centers is the
LIMITS: The data presented on Page 11 is based on world's definitive source of data and analysis on internal
Page 10 presents cross-border movements based on the surveys conducted with travellers at FMPs in Senegal, displacement and provide regular data on internal
Flow Monitoring Registry (FMR); Page 11 presents a Mali, Guinea, Burkina Faso, Nigeria, Niger and Chad during displacement through its Global internal displacement
regional analysis of the intended destination of travellers the timeframe indicated. The data should not be database and report.
as provided by respondents to Flow Monitoring Surveys. generalized and does not present a full picture of inter-
and intra-regional migration, but rather a snapshot of UNDESA: the United Nations Departement for Economic
METHODOLOGY: At Flow Monitoring Point (FMP), migration flows at specific locations. For example, while and Social Affairs (UNDESA) provides regular update on its
enumerators collect information on the number, IOM aims to establish Flow Monitoring Points at locations migrants’ stocks. Data presented does not reflect all
frequency and defining features of individuals transiting with high transit flows (based on information from key migration stocks in each country and are likely
through a particular location. Prior to the establishment of informants), flows are changing and FMPs can only underestimating total migrants’ population in the region.
an FMP, areas of high mobility are identified following provide a partial picture.
discussions with national and local actors. The locations at
which FMPs are set up, key points of transit such as border DATA ON RETURNS THROUGH ASSISTED
points or coach stations, are then identified based on VOLUNTARY AND HUMANITARIAN RETURN
participatory mapping of main migration routes conducted PROGRAMMES
in partnership with national and local authorities. As of 30
June 2020, more than 30 FMPs are active in eight Data collected on the regions of origin of migrants
countries of the West and Central Africa region (Burkina provides details on individuals assisted in voluntary or
Faso, Cameroon, Chad, Guinea, Mali, Niger, Nigeria, and humanitarian return by IOM. It is based on databases fromDATA SOURCES
IOM FLOW MONITORING POINTS (migration.iom.int)
IOM (AVRR)
IOM NIGER (regions of origins)
IOM NIGER (Search & Rescue)
NATIONAL WORKSHOPS ON CAPTURING
DISPLACEMENT AND MOVEMENTS DATA (Capo Verde,
Mauritania, Senegal, The Gambia, Guinea, Guinea-Bissau,
Burkina Faso, Niger, Nigeria, Liberia, Sierra Leone, Ghana,
Côte d’Ivoire, Togo and Benin)
IOM ITALY, IOM SPAIN, IOM GREECE
IOM COUNTRY OFFICES (labour intensive areas)
MINISTRIES OF INTERIOR (Spain, Italy, Greece, Niger)
UNDESA (migrant stock database)
ACLED (security incidents)
OECD (transhumance)
DATA COLLECTION OVERVIEW & METHODOLOGY
DISPLACEMENT PUBLICATIONS AND PARTNERSHIPS MIGRATION
Regional Office for West and Central Africa
Zone 3, Route des Almadies
Dakar BP 16 838
Senegal: Tel: +221 33 689 62 00 - Fax: +221 33 869 62 33
Information management: RO Dakar – Data & Research Unit
rodakar-dataresearch@iom.int or djusselme@iom.intYou can also read