REINZ & TONY ALEXANDER REAL ESTATE SURVEY - April 2022 - ISSN: 2703-2825
←
→
Page content transcription
If your browser does not render page correctly, please read the page content below

REINZ &
        TONY ALEXANDER
       REAL ESTATE SURVEY
                                                 April 2022

© REINZ - Real Estate Institute of New Zealand                ISSN: 2703-2825
CREDIT CRUNCH IMPACTS STILL
DOMINANT
Welcome to the REINZ & Tony Alexander Real Estate
Survey. This survey gathers together the views of licensed
real estate agents all over New Zealand regarding how they
are seeing conditions in the residential property market in
their areas at the moment. We ask them how activity levels
are changing, what the views of first home buyers and
investors are, and the factors which are affecting sentiment
of those two large groups.

The results this month look very much like those from
four weeks back. Clearly, planned changes to the CCCFA
legislation have not elicited a positive response from
buyers who continue to stand back from the market.
                                                                ARE MORE OR FEWER PEOPLE ATTENDING OPEN
A firm majority of agents feel that house prices are falling    HOMES?
in their location, FOMO is essentially non-existent, and fear
of over-paying (FOOP) has risen to a gross 64% of agents        As was the case above for attendance at auctions, this
observing it on the part of buyers.                             month has produced the second worst reading on record
                                                                for the change in attendance at open homes. A net 69% of
The survey results show that the pullback in the New            agents have reported seeing fewer people at open homes,
Zealand residential real estate market from the extremes        only a slight improvement from the record net 79% who last
of 2020 and 2021 has continued largely unabated this            month reported seeing fewer people.
past month.
                                                                Again, we see evidence of buyers stepping back from
ARE MORE OR FEWER PEOPLE SHOWING UP AT                          the market, waiting to see what will happen, and perhaps
AUCTIONS?                                                       most especially, waiting to see how other potential buyers
                                                                and sellers react to factors such as rising interest rates,
A net 66% of the 558 real estate agents replying in this
                                                                reduced credit availability and net migration outflows.
month’s survey have reported seeing fewer people
attending auctions. This is better than the record net 72%
in March who saw a deterioration. But that counts for little
alongside the fact this month’s result is the second worst
on record. Buyers have lost their FOMO (see below) and
perhaps with caution associated with the rapid spread of
the Omicron variant of COVID-19 have decided for now to
step back from attending auctions.

This is not surprising considering the established positive
correlation between overall strength in the New Zealand
residential property market and the number of people
attending auctions — and the number of auctions held.

2
HOW DO YOU FEEL PRICES ARE GENERALLY
CHANGING AT THE MOMENT?
Housing markets move in cycles and the cycle since the
period 2012-15 has been firmly upward in all parts of the
country. The cycle got a special non-cyclical boost from
the global pandemic, and now that some aspects of the
pandemic are waning, we are seeing the unwinding of
some of that special boost. Prices will not decline back
to where they were in March 2020 given the large and
growing backlog of frustrated buyers back then. Also,
house prices tend to be slightly ‘sticky’ downward.
When the market weakens many vendors simply step ARE YOU NOTICING MORE OR FEWER FIRST HOME
back from the market, waiting for things to improve before BUYERS IN THE MARKET?
choosing to sell.
A net 53% of agents have noted that they are seeing fewer
Our latest survey shows that whereas as recently as first home buyers in the market looking to make a purchase.
October a net 60% of agents felt that prices were rising in This is an improvement from March’s net 71% seeing first
their location, now a net 51% feel that they are falling. home buyers withdrawing.
But it still means more young buyers are stepping back.
The Government’s proposed changes to the CCCFA have
not brought forward the young buyers.
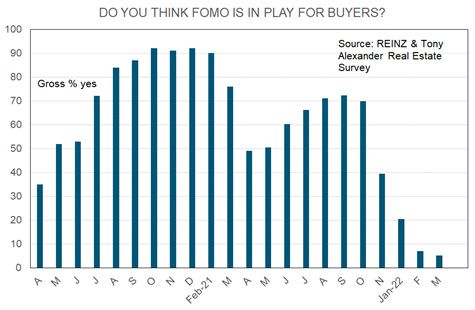
DO YOU THINK FOMO IS IN PLAY FOR BUYERS?
FOMO = Fear of missing out
Last month we noted that FOMO was no more. That
situation continues with only 5% of agents saying that they ARE YOU NOTICING MORE OR FEWER INVESTORS IN
are observing buyers feeling worried that they might miss THE MARKET?
out. Many buyers have been taken out of the market for
now by the government’s tightening of credit availability As previously noted many times – investors took a step
through changes to the Credit Contracts and Consumer back from the market right after the tax changes were
Finance Act (CCCFA). announced late in March last year. Each month since
then more agents have reported seeing fewer investors
Other buyers know this situation, and in conjunction with looking to buy than more and that situation continued in
other restraining forces in play such as the increasing this month’s survey. A net 67% of agents have reported
removal of interest expense tax deductibility for investors, seeing fewer investors, little changed from the record net
feel there is little need to hurry their purchase — for now. 68% of March.
3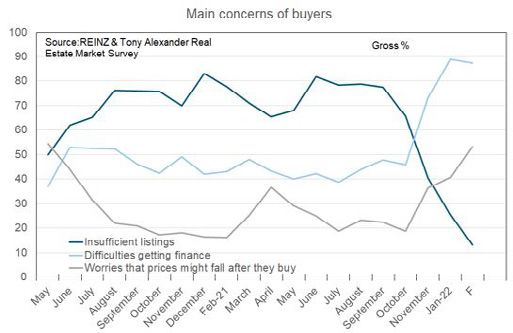
ARE PROPERTY APPRAISAL REQUESTS INCREASING
                                                               OR DECREASING?

                                                               There continues to be a strongly positive net proportion of
                                                               agents reporting that they are receiving more requests to
                                                               appraise the market value of a property. The level of such
                                                               enquiry jumped sharply in September, perhaps reflecting
                                                               more owners wanting to take advantage of the strength
                                                               in the market amidst early reports of credit availability
                                                               tightening up. But there is also likely a strong role played
                                                               by the earlier jump in mortgage interest rates encouraging
                                                               some bringing forward of transaction plans.

ARE YOU RECEIVING MORE OR FEWER ENQUIRIES
FROM OFFSHORE?

There are two key points which I have been stressing for
the past year. The first is that there will not be a wave of
investors selling as a result of the tax changes from March
last year. The impact will be and has been on reduced
buying by investors.

The second is that when the borders open up, we will
not see a wave of Kiwis looking to purchase property.
Those who wanted to do so as a result of the pandemic
encouraging early shifting home have probably already          WHAT ARE THE MAIN CONCERNS OF BUYERS?
done so. Instead, we are likely to see increased selling by
Kiwis shifting to Australia — but that is not something we     We ask agents to note which things are concerning buyers
measure.                                                       most of all. Buyer concerns about sufficient listings being
                                                               available have all but evaporated. Over the period of time
In this month’s survey, a net 41% of agents reported that      that these concerns have collapsed we have seen a jump in
they are receiving fewer enquiries from offshore. There        worries about getting finance and potentially over-paying.
is no indication of this measure approaching net positive      FOOP = fear of over-paying and this month a record gross
any time in the near future. Note however in the regional      64% of our 558 agents have said that buyers are displaying
results table at the end of this document. For Queenstown      price decline worries.
Lakes this reading is 0%. That is starkly different from all
other regions.                                                 This is shown as the grey line in the following graph.

4
Our second graph addressing buyer concerns shows              same as two months ago but lower than in the early days
a levelling off in worries about rising interest rates        of the pandemic.
(interesting), low worries that prices are too high, and no
great level of concern about employment income.

                                                              Our second graph of investor motivations clearly shows
                                                              that following the March 2021 tax announcement demand
                                                              from investors backed off substantially.

ARE INVESTORS BRINGING MORE OR FEWER
PROPERTIES TO THE MARKET TO SELL THAN THREE
MONTHS AGO?

As noted above, one of my key theories this past year
has been that despite factors like tax changes and rising
interest rates, we will not see a wave of investor selling.
No such wave has happened since the end of March last
year and this month there has been a decrease in the net
proportion of agents seeing more investor sellers — to 5%
from 10% last month.

WHAT FACTORS APPEAR TO BE MOTIVATING
INVESTOR DEMAND?

Low interest rates have become a very small driver of
investor demand now. Instead, we are seeing a rising trend
in the proportion of agents saying that investors appear
to be motivated by hopes of finding a bargain. 34% of
agents are now saying they see this factor in play, the

5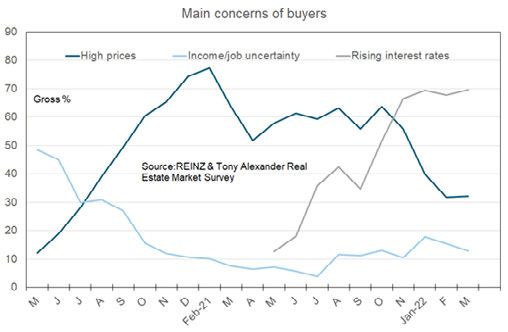
REGIONAL RESULTS

The following table breaks down answers to the numerical questions above by region. No results are presented for
regions with fewer than 7 responses as the sample size is too small for good statistical validity of results. The three top of
the South Island regions are amalgamated into one and Gisborne is joined with Hawke’s Bay.

Best use of the table is achieved by picking a variable and comparing a region’s outcome with the national result shown
in bold in the bottom line. For instance, nationwide a net 51% of agents feel that prices are falling in their area. But in
Northland this is only 16% whereas in Auckland it is 64% and Wellington 81%.

The table shows net percentages apart from the FOMO question in column F. The net percent is calculated as the
percentage of responses saying a thing will go up less the percentage saying it will go down.

If anyone is interested, I can make available time series for each measure shown here. Contact me at
tony@alexander.nz.

    A.   # of responses
    B.   Are property appraisal requests increasing or decreasing?              G.      Are you noticing more or fewer first home buyers in the market?
    C.   Are more or fewer people showing up at auctions?                       H.      Are you noticing more or fewer investors in the market?
    D.   Are more or fewer people attending open homes?                         I.      Are you receiving more or fewer enquiries from offshore?
    E.   How do you feel prices are generally changing at the moment?           J.      Are investors bringing more or fewer properties to the market to sell
    F.   Do you think FOMO is in play for buyers?                                       than three months ago?

                              A            B             C            D          E              F             G              H              I              J
                             #obs       Appraisals    Auctions      Open H.    Prices         FOMO           FHBs          Invest.       O/seas       Inv.selling
 Northland                     25           36           -32            -32     -16              4            -52            -52           -24            -32
 Auckland                     218            7           -76            -63     -64              5            -54            -71           -41             1
 Waikato                      50            38           -78            -64     -28              10           -48            -64           -38             8
 Bay of Plenty                 49           35           -80            -84     -49              4            -55            -71           -39            16
 Hawke's Bay                   28           50           -79            -89     -61              7            -68            -86           -36            18
 Taranaki                      6
 Manawatu-Whanganui            25           24           -44            -80     -64              4            -68            -44           -44            -16
 Wellington                    52           19           -48            -69     -81              0            -77            -73           -52            10
 Nelson/Tasman                 27           30           -44            -78     -44              0            -44            -70           -48            27
 Canterbury                    48           -13          -58            -69     -19              10            -31           -38           -35            10
 Queenstown Lakes              9            -11          -78            -67     -11              11           -22            -56            0             22
 Otago exc. Q'town             14           0            -50            -100    -21              0            -36            -79           -64             7
 Southland                     5
 New Zealand                  558           18           -66            -69     -51              5            -53            -67           -41             5

6
ISSN: 2703-2825

This publication is written by Tony Alexander, independent economist.
Subscribe here https://forms.gle/qW9avCbaSiKcTnBQA
To enquire about having me in as a speaker or for a webinar contact me at tony@tonyalexander.nz
Back issues at www.tonyalexander.nz

Tony’s Aim
To help Kiwis make better decisions for their businesses, investments, home purchases, and people by writing about the economy in
an easy to understand manner.

Feel free to pass on to friends and clients wanting independent economic commentary.

Disclaimer: This report is intended for general information purposes only. This report and the information contained herein is under no circumstances
intended to be used or considered as legal, financial or investment advice. The material in this report is obtained from various sources (including third
parties) and REINZ does not warrant the accuracy, reliability or completeness of the information provided in this report and does not accept liability for
any omissions, inaccuracies or losses incurred, either directly or indirectly, by any person arising from or in connection with the supply, use or misuse
of the whole or any part of this report. Any and all third party data or analysis in this report does not necessarily represent the views of REINZ. When
referring to this report or any information contained herein, you must cite REINZ as the source of the information. REINZ reserves the right to request
that you immediately withdraw from publication any document that fails to cite REINZ as the source.


You can also read