REINZ & TONY ALEXANDER REAL ESTATE SURVEY - May 2022 - ISSN: 2703-2825
←
→
Page content transcription
If your browser does not render page correctly, please read the page content below

REINZ &
        TONY ALEXANDER
       REAL ESTATE SURVEY
                                                 May 2022

© REINZ - Real Estate Institute of New Zealand              ISSN: 2703-2825
BUYERS ARE IN NO HURRY FOR NOW
Welcome to the REINZ & Tony Alexander Real Estate              ARE MORE OR FEWER PEOPLE ATTENDING OPEN
Survey. This survey gathers together the views of licensed     HOMES?
real estate agents all over New Zealand regarding how they
are seeing conditions in the residential property market       Consistent with agents continuing to report poor
in their areas at the moment. We ask them how activity         attendance at auctions is the high net 63% still reporting
levels are changing, what the views of first home buyers       that fewer people are showing up at open homes. Buyers
and investors are, and the factors which are affecting the     are facing restraining pressures from rising interest rates,
sentiment of those two large groups.                           decreased access to bank credit, soaring cost of living
                                                               expenses, visibly rising house supply, and uncertainty
Our fourth survey of licensed real estate agents for 2022      surrounding events offshore.
has revealed conditions to be as weak as they have been
since the start of the year. First home buyers and investors
have backed away, agents report that prices in their area
are falling, FOMO is all but gone to be replaced by a record
level of FOOP (fear of overpaying) and interest in property
from offshore has reached a two-year low.

Agents continue to report that buyers have few worries
about their employment and listings are abundant.
However, rising interest rates are increasingly concerning
and while worries about securing finance has eased
slightly, it still remain a significant concern of buyers.

ARE MORE OR FEWER PEOPLE SHOWING UP AT
AUCTIONS?                                                      HOW DO YOU FEEL PRICES ARE GENERALLY
                                                               CHANGING AT THE MOMENT?
A net 65% of responding real estate agents in this month’s
survey have said that they are seeing fewer people             A record net 60% of agents nationwide reported this
attending auctions. This is about the same negative level      month that prices are falling in their area of operation.
as all other months this year and consistent with media        Last month this was a net 51% and back as recently as
reports of low success rates at auctions and decreasing        October a net 60% reported that prices were rising. Prices
auction numbers. In an environment where FOMO has all          have turned sharply very quickly over the past few months
but disappeared, potential buyers are not having to attend     with the biggest shift occurring in November as the new
auctions to gain insight into market conditions as much as     LVR restrictions on bank lending at low deposits took hold
they had to previously.                                        and banks got ready for Credit Contracts and Consumer
                                                               Finance Act changes.

2
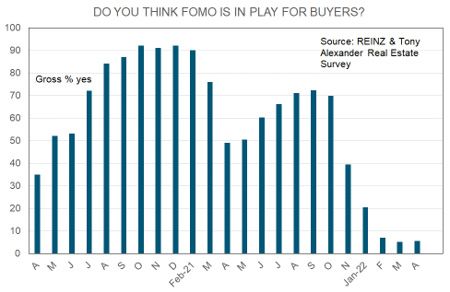
DO YOU THINK FOMO IS IN PLAY FOR BUYERS? ARE YOU NOTICING MORE OR FEWER INVESTORS IN
THE MARKET?
FOMO = Fear of missing out
A net 60% of agents have reported seeing fewer investors
Only a gross 6% of agents report that they can see FOMO in the market. Whereas the presence of first home buyers
on the part of buyers. This is essentially the same as last collapsed after the Reserve Bank and Government
month’s result of 5% and the 7% recorded late in February. restricted credit access with the LVR and CCCFA changes,
In contrast, 70% of agents reported that they were seeing investors stood back and have remained in reduced
FOMO in October last year. As is the case with our other evidence since tax changes of late-March 2021.
measures, the turning of FOMO since new LVR and CCCFA
restrictions came into force has been extreme.
ARE YOU RECEIVING MORE OR FEWER ENQUIRIES
FROM OFFSHORE?
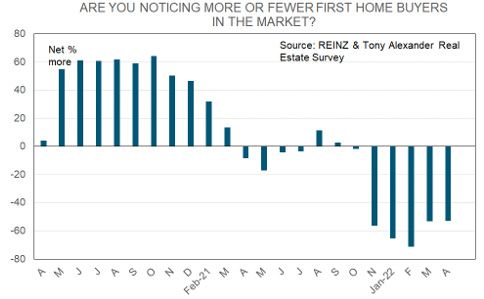
ARE YOU NOTICING MORE OR FEWER FIRST HOME A record net 50% of agents have this month reported
BUYERS IN THE MARKET? receiving less enquiry about NZ properties from people
located offshore. There is no border-opening induced flood
Late last month a net 53% of agents reported that they of Kiwis looking to resettle back in NZ in a purchased home,
were seeing fewer first home buyers in the market. This and no rush of enquiry by migrants anticipating residency
percentage is unchanged from our previous month’s survey visas either.
and consistent with strongly negative results since late
November last year. The turnaround has been sharper than
in late 2020 when soaring prices caused a lot of first home
buyers to step away from the market.
3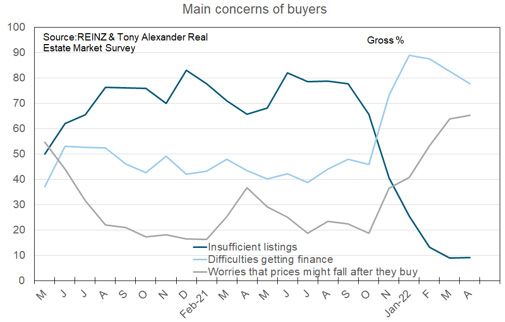
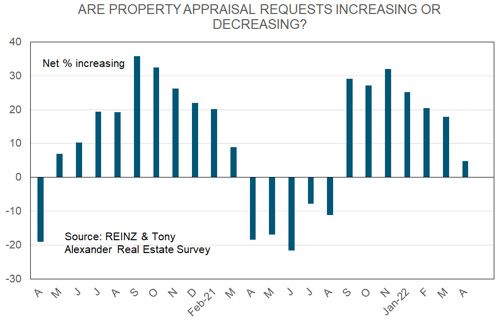
ARE PROPERTY APPRAISAL REQUESTS INCREASING
OR DECREASING?

Just a net 5% of agents this month reported seeing an
increase in requests for property appraisals. This is down
from a net 18% last month and the lowest reading since
August last year. It can be challenging to interpret what
shifts in this measure mean. But it would seem reasonable
to consider this latest decline as a sign that there is no rush
of properties set to be placed on the market. Data from
realestate.co.nz already tell us that although weaker sales
levels are leading to rapidly rising stocks of listings around
the country, there is no firm upward trend in the number of
new listings being received by agents each month.

Factors such as rising interest rates and removal                 Our graphs also show that worries about employment
of expectations for immediate capital gains are not               remain low. This is a distinguishing characteristic of this
encouraging a wave of selling — just reduced buying.              current phase of the New Zealand economy and housing
                                                                  market. Unemployment is low, shortages of staff abound,
                                                                  and job security is high. This is an important factor which
                                                                  will help cushion weakness in many sectors such as
                                                                  housing and retailing.

WHAT ARE THE MAIN CONCERNS OF BUYERS?

We ask agents to note which things are concerning buyers          ARE INVESTORS BRINGING MORE OR FEWER
most of all. The main concern noted is rising interest rates,     PROPERTIES TO THE MARKET TO SELL THAN THREE
cited by a record 81% of agents. Next comes 78% of agents         MONTHS AGO?
citing difficulties getting finance, then 65% citing worries
that prices will decline after one has made a purchase.           To repeat something written here and in other outlets many
                                                                  times over the past year — there is no wave of investor
The two following graphs tell us that price decline worries       sellers hitting the market. Despite rising interest rates, tax
continue to grow, but that there has been a small reduction       changes, Healthy Homes legislation, and altered landlord
in worries about getting finance. This is consistent              flexibility in management of tenants, investors continue
with results from my survey of mortgage advisers with             to see the benefits of long-term holdings of residential
mortgages.co.nz which has just shown a small net                  investment property.
percentage of advisers observing that bank willingness to
lend has improved.

4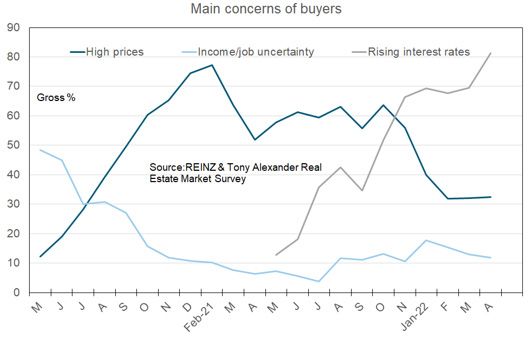
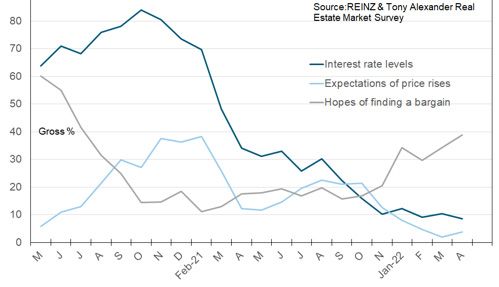
Shortages of rental accommodation continue, and rents are
rising at a firm pace nationwide. Property is often viewed
as a hedge against high inflation, there is new volatility in
markets for other assets such as shares, real returns on
bank deposits and other fixed interest assets are firmly
negative, and still rising construction costs will act to place
a general floor underneath house prices.

WHAT FACTORS APPEAR TO BE MOTIVATING
INVESTOR DEMAND?

The main factor which agents cite as motivating demand
from investors still looking to make a purchase is hopes of
finding a bargain. This factor is cited by 39% of agents and
is shown as the grey line in the graph immediately below.
Interest rate levels and price rise expectations barely
feature as motivators now as compared with late-2020.

Our second graph of investor motivations clearly shows that
following the March 2021 tax announcement demand from
investors backed off substantially.

5
REGIONAL RESULTS

The following table breaks down answers to the numerical questions above by region. No results are presented for regions
with fewer than seven responses as the sample size is too small for good statistical validity of results. The three top of the
South Island regions are amalgamated into one and Gisborne is joined with Hawke’s Bay.

The best use of the table is achieved by picking a variable and comparing a region’s outcome with the national result
shown in bold in the bottom line. For instance, downward pressure on prices is observed by agents everywhere, but to the
least extent in Taranaki, Nelson/Tasman/Marlborough, Canterbury, and Dunedin.

The table shows net percentages apart from the FOMO question in column F. The net percent is calculated as the
percentage of responses saying a thing will go up less than the percentage saying it will go down.

If anyone is interested, I can make available time series for each measure shown here. Contact me at
tony@alexander.nz.

    A.   # of responses
    B.   Are property appraisal requests increasing or decreasing?              G.      Are you noticing more or fewer first home buyers in the market?
    C.   Are more or fewer people showing up at auctions?                       H.      Are you noticing more or fewer investors in the market?
    D.   Are more or fewer people attending open homes?                         I.      Are you receiving more or fewer enquiries from offshore?
    E.   How do you feel prices are generally changing at the moment?           J.      Are investors bringing more or fewer properties to the market to sell
    F.   Do you think FOMO is in play for buyers?                                       than three months ago?

                              A            B             C            D          E              F             G              H              I              J
                             #obs       Appraisals    Auctions      Open H.    Prices         FOMO           FHBs          Invest.       O/seas       Inv.selling
 Northland                     25           24           -44            -32     -44              0            -64            -52           -44            -24
 Auckland                     172           -17          -72            -60     -69              4            -47            -61           -53             1
 Waikato                       33           39           -82            -67     -45              9            -42            -45           -48             6
 Bay of Plenty                 35           37           -74            -74     -74              3            -43            -51           -37            -6
 Hawke's Bay                   23           74           -70            -100    -70              0            -83            -83           -48             5
 Taranaki                      7            57           -43            -86     -29              0            -57            -86            -71           29
 Manawatu-Wanganui             17           -6           -47            -71     -65              0            -88            -35           -65            -12
 Wellington                    33            6           -42            -42     -82              3            -30            -64           -58            -15
 Nelson/Tasman                 23           30           -48            -65     -43              13           -70            -70           -74            -26
 Canterbury                    43           -7           -74            -70     -35              14           -58            -44           -42            -19
 Queenstown Lakes              6            n/a
 Otago exc. Q'town             12           -8           -25            -67     -42              8            -67           -100           -42             0
 Southland                     4            n/a
 New Zealand                  434            5           -65            -63     -60              6            -53            -60           -50            -5

6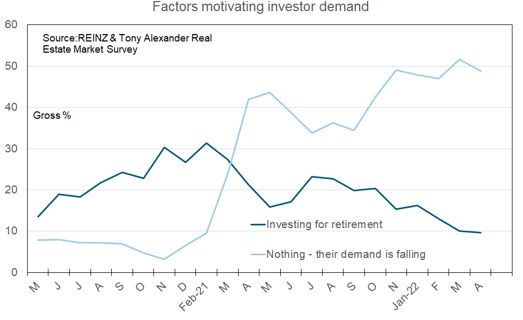
ISSN: 2703-2825

This publication is written by Tony Alexander, independent economist.
Subscribe here https://forms.gle/qW9avCbaSiKcTnBQA
To enquire about having me in as a speaker or for a webinar contact me at tony@tonyalexander.nz
Back issues at www.tonyalexander.nz

Tony’s Aim
To help Kiwis make better decisions for their businesses, investments, home purchases, and people by writing about the economy in
an easy to understand manner.

Feel free to pass on to friends and clients wanting independent economic commentary.

Disclaimer: This report is intended for general information purposes only. This report and the information contained herein is under no circumstances
intended to be used or considered as legal, financial or investment advice. The material in this report is obtained from various sources (including third
parties) and REINZ does not warrant the accuracy, reliability or completeness of the information provided in this report and does not accept liability for
any omissions, inaccuracies or losses incurred, either directly or indirectly, by any person arising from or in connection with the supply, use or misuse
of the whole or any part of this report. Any and all third party data or analysis in this report does not necessarily represent the views of REINZ. When
referring to this report or any information contained herein, you must cite REINZ as the source of the information. REINZ reserves the right to request
that you immediately withdraw from publication any document that fails to cite REINZ as the source.
You can also read