Report LETTERKENNY GATEWAY - Southern Regional Assembly
←
→
Page content transcription
If your browser does not render page correctly, please read the page content below
Gateways | Hubs
                Development Index 2012
    A Review of Socio-Economic Performance

                 LETTERKENNY
                                       GATEWAY
                            Report
Border, Midland & Western Regional Assembly
                                              May 2013
Southern & Eastern Regional Assembly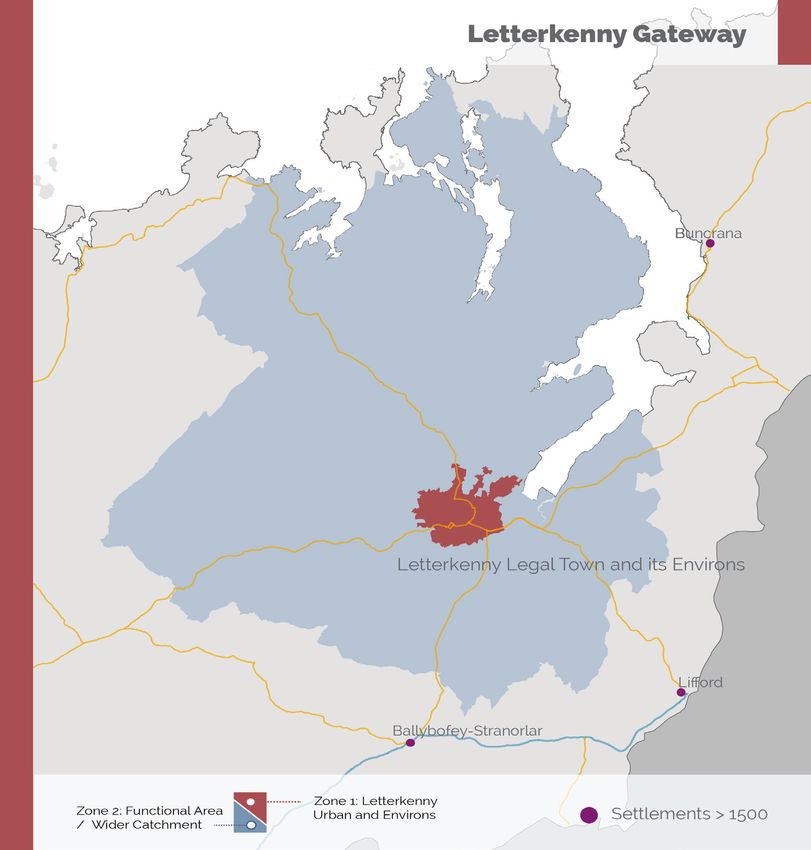
Gateways | Hubs
                               Development Index 2012
              A Review of Socio-Economic Performance

                                       LETTERKENNY
                                                 GATEWAY
                                                       Report

Border, Midland and Western Regional Assembly   Southern and Eastern Regional Assembly
The Square, Ballaghaderreen, Co Roscommon       Assembly House, O’Connell Street, Waterford

Phone: 		      + 353 (0) 94 986 2970            Phone: 		       + 353 (0) 51 860700
Fax: 		        + 353 (0) 94 986 2973            Fax: 		         + 353 (0) 51 879887
Email: 		      info@bmwassembly.ie              Email: 		       info@seregassembly.ie
Website:       www.bmwassembly.ie               Website:        www.seregassembly.ie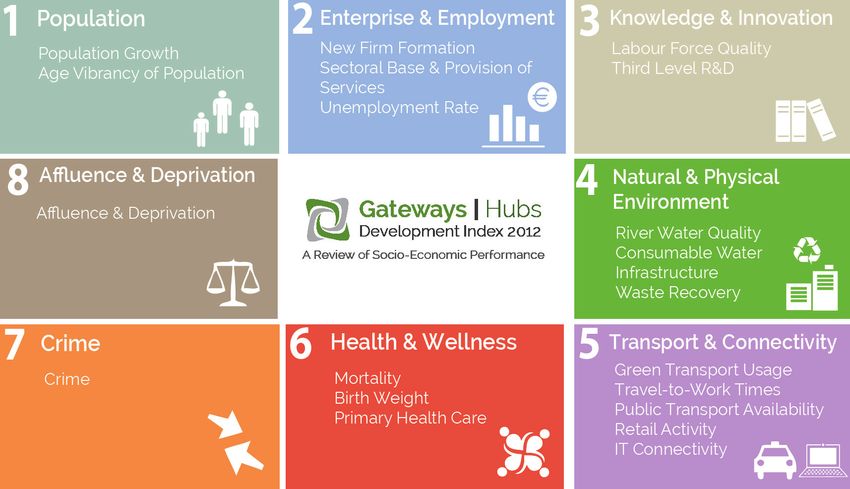
Preface
This report is one in a series of nine assessing the socio-economic performance of
individual Gateways as designated under the National Spatial Strategy (NSS) 2002-2020.
This series serves as both an update and progression of the Gateway Development
Index (GDI), which was originally compiled and published in 20091. It builds upon the
initial study using previously established domains and constituent indicators (or suitable
alternatives where necessary and appropriate), as well as expanding the Index to
encompass the Hub towns for the first time. Accordingly, the Index is hereinafter referred
to as the Gateways and Hubs Development Index (GHDI) 2012.
Each report presents the updated findings for the relevant Gateway2 (a Hubs report is
also available) using the latest available datasets in 2012, in the form of an Index, based
upon the evaluation of all of the Gateways and Hubs within a series of domains and
indicators. For reasons of comparability, these datasets were prepared and analysed
for both 2006 and 2011. The domains and indicators were, for the most part, previously
defined and used within the GDI 2009 report, while some minor adjustments have
been introduced3. It is important to note that the geographic boundaries upon which
the indicators are formulated have changed in all cases. It should also be noted that
although both the GDI 2009 and the GHDI 2012 utilise largely the same indicators,
they are however not directly comparable due to changes in the boundaries of the
various Gateways and Hubs as defined by the CSO POWSCAR dataset. The GHDI 2012
therefore will compare the performance of the Gateways and Hubs in 2011 and 2006 by
retrospectively applying the new framework to the GDI 2009. This is set out in the series
of reports. In addition,the findings of a comprehensive perception survey complement
the detailed domain analysis.
It should be noted that, for the purposes of the GHDI study (which is primarily tasked with
measuring and monitoring the economic and social performance of each Gateway given
the context of their prescribed NSS role, and the EU Co-Financed Regional Operational
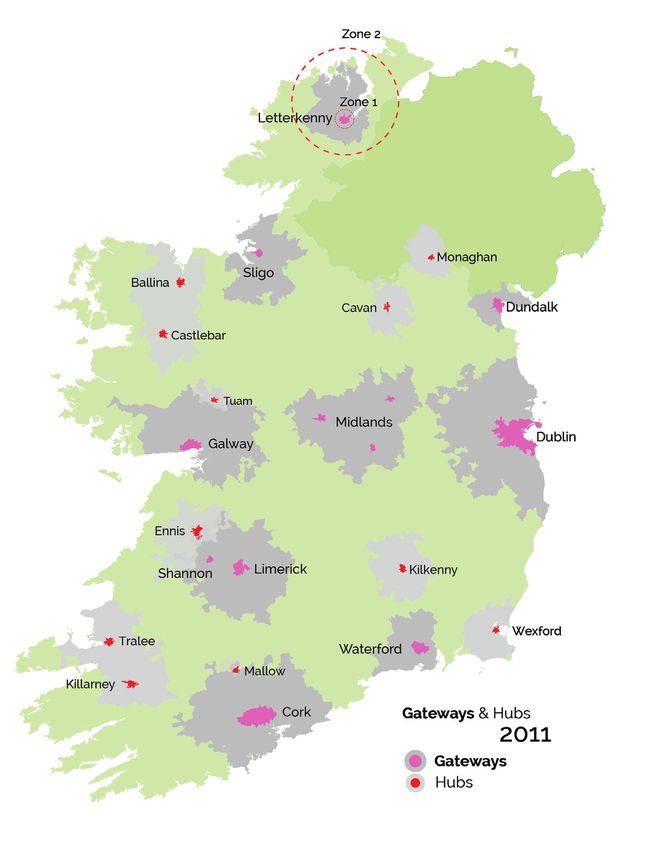
Programme investment), two ‘Zone’ boundaries have been determined to further inform
the analysis, these are defined in such a manner that: Zone 1 reflects the urban cores, i.e.
the relevant cities and towns and their environs as defined by the CSO (2011); and, Zone
2 consists of the wider Gateway catchment or functional area, where in excess of 20% of
the residents in employment commutes to the urban core (Zone 1) to work. The Zone 2
areas may extend beyond the administrative boundaries of each Gateway settlement.
In many cases, this has resulted in large parts of the surrounding rural hinterland also
being included within the study area, which reflects the influence and economic reach
of the Gateways. Accordingly, the population findings within Gateway reports should not
be directly compared with Regional Planning Guidelines (RPG) population targets (as set
out within the RPGs and development plans).
1 Available at: http://www.bmwassembly.ie/publications/other_reports/BMW_GDI_Report.pdf and
http://www.seregassembly.ie/images/text_pages/11497_SE_GDI_Report.pdf
2 Reports have been compiled for each of the nine Gateways, with a single report to include all of the Hubs,
and a summary Gateway and Hubs Development Index Report
3 A new domain, ‘Crime’ replaces ‘Social Facilities and Networks’ as a measure of human capital. The 2009 GDI
domain ‘Social Facilities and Networks’ was largely based on crime statistics in any event. In addition, some
minor indicator adjustments have been introduced to some indicators within domains.
i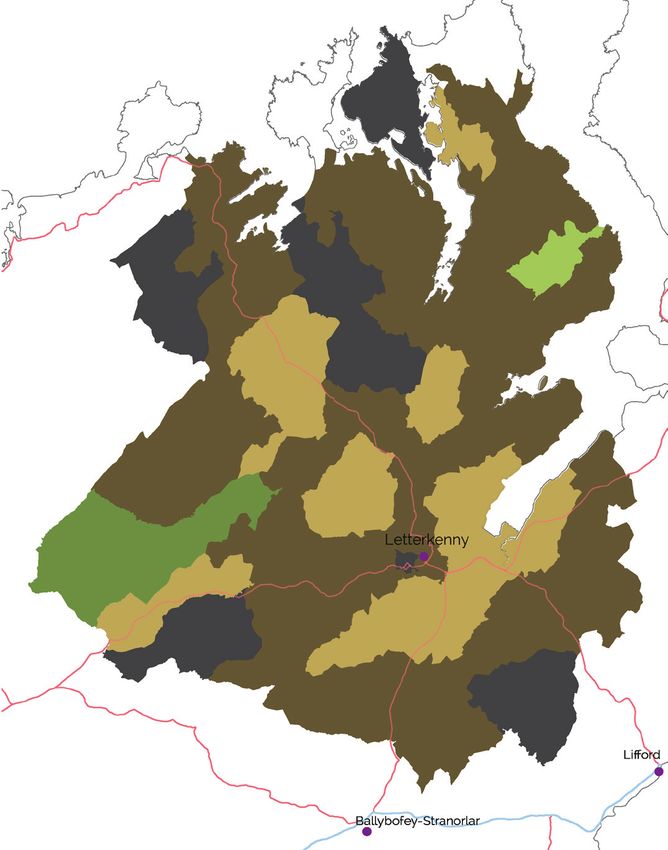
The CSO derived boundaries of cities/towns (Zone 1) will not always capture the full
extent of the influence of the Gateway/Hub as a number of large employment nodes
are located outside of the defined boundaries e.g. Dublin Airport and Shannon Industrial
Zone. CSO POWSCAR data is used in the Index to ensure and enable consistency of
analysis across all Gateways and Hubs. However anomalies such as those identified
may arise.

It should be noted that the remit and scope of this report is focused upon examining the
economic and social performance of both the Gateways and Hubs and does not seek
to catalogue or identify all investments delivered under national, regional and local
investment programmes (information which is publicly available).

The reports are the outputs to a study which is co-funded by the European Regional
Development Fund (ERDF) under the Regional Operational Programmes 2007-2013
undertaken on behalf of the Border, Midland and Western Regional Assembly and the
Southern and Eastern Regional Assembly by Future Analytics Consulting, in conjunction
with Behaviour and Attitudes. A steering committee, consisting of representatives from
the following bodies guided the overall study.

A series of stakeholder workshops were organised by the BMW and S&E Regional
Assemblies, and conducted with the assistance of Future Analytics Consulting and
Behaviour and Attitudes (a list of those who attended is set out in Appendix 2). The
feedback from these workshops was instrumental in informing the compilation and
presentation of the final reports. The Steering Committee would like to sincerely thank
all those who attended the workshops and contributed to the overall project outputs.

                                                                                           ii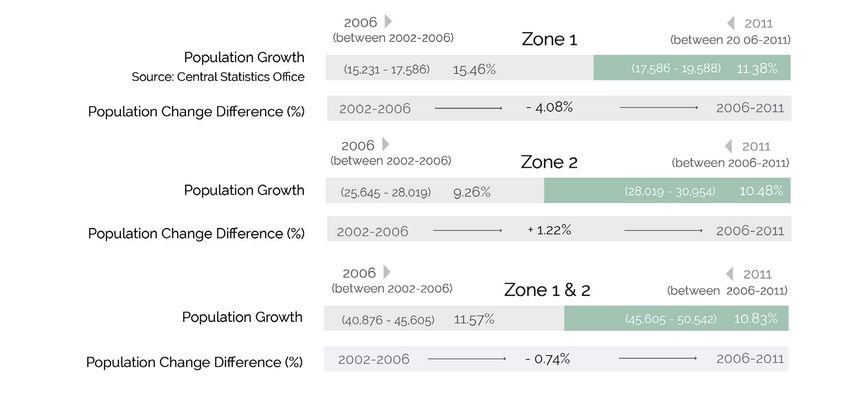
Table of Contents
      The Letterkenny Gateway
       1.0     Introduction     							1
       1.1     Gateway Context							1
       1.2     Use of POWSCAR Data							4
       1.3     Use of GeoDirectory Data						5

       2.0     Policy Context 							6
       2.1     The Importance of Policy for Balanced and
               Sustainable Regional Development					6
       2.2     Spatial Policy Landscape						7
       2.3     Resourcing Gateway Development					10
       2.4     Emerging Policy Landscape						12
       2.5     The Importance of the Gateways and Hubs
               Development Index to Inform Policy					13

       3.0     Letterkenny Gateway Development Index       			15
       3.1     Individual Domain Analysis						15
       3.2     Population								16
       3.3     Enterprise and Employment						20
       3.4     Knowledge and Innovation						23
       3.5     Natural and Physical Environment					26
       3.6     Transport and Connectivity						30
       3.7     Health and Wellness							35
       3.8     Crime									38
       3.9     Affluence and Deprivation						                 40

       4.0     Letterkenny Gateway Perception Survey				42
       4.1     Introduction								42
       4.2     Findings of Perception Survey						42

       5.0     GDI 2009 Versus GHDI 2012         					44
       5.1     GDI 2009 and GHDI 2012: Indices Scores				      44

       Appendix 1 - Steering Committee
       Appendix 2 - Stakeholder Engagement
       Appendix 3 - Perception Survey Findings

iii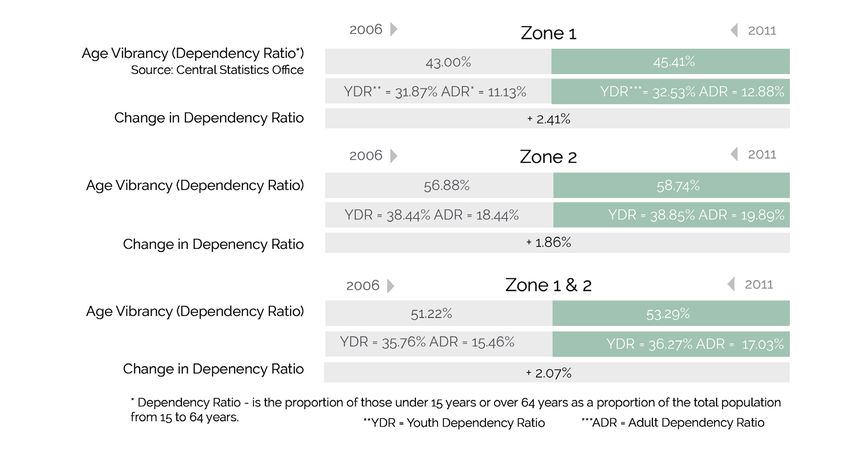
1.0 Introduction
1.1   Gateway Context
      Letterkenny is the primary urban settlement, administrative and commercial centre
      of County Donegal, and is also the principal driver of economic activity within the
      county. Due to its location, in the North-West corner of the Island of Ireland, County
      Donegal shares the vast majority of its land border with Northern Ireland. The
      presence of this border has been influential on the county as well as the towns and
      people within it, and this influence continues today, with cross-border trade and
      commuting in both directions now a common feature of life. It is within this context
      that the co-designation of Letterkenny and the Northern Irish city of Derry, located
      approximately 40kms to the north-east, as a linked Gateway by the National Spatial
      Strategy 2002-2020 (NSS)4 in 2002 must be seen. The increasing influence of cross-
      border planning, in keeping with the ideals of the European Spatial Development
      Perspective (ESDP)5, and as illustrated in the example of Letterkenny and Derry, is
      anticipated to contribute to a more integrated approach to the development of towns
      located on or near the border. Cross-border cooperation in the area of spatial planning
      is reinforced by the compatibility of the NSS with its Northern Ireland equivalent, the
      Regional Development Strategy for Northern Ireland 20356, and is seen as an area
      that will be of increasing importance in the coming years.

      Letterkenny itself is a vibrant town, which has been able to demonstrate sizeable
      demographic and economic growth over the last number of years. The town is an
      important employment centre within the North-West, having successfully attracted
      and retained a healthy proportion of foreign direct investment (FDI) from the likes of
      UnitedHealth Group (Healthcare Claims Processing), Pramerica Systems Ireland Ltd
      (Software Development Centre), Medisize Donegal Healthcare (Medical Products),
      Zeus Industrial Products (Medical Devices) and SITA PTS (Software Development).
      Other important employers in the Gateway include the Health Services Executive, the
      Department of Social and Family Affairs and Donegal County Council.

      The Letterkenny Institute of Technology (LYIT) is a strategically important third level
      institution located within the town, with a sizeable student population (2,969 people
      enrolled in 2011). It offers a wide range of courses, from a number of different disciplines
      such as business, law, engineering and health. In addition CoLab, the innovation
      centre based at LYIT, performs an important role in the regional economy in terms
      of the provision of incubation space and business supports to high technology and
      knowledge intensive companies. The University of Ulster has around 4,000 students
      enrolled at their campus at Magee, Derry located approx. 40 km (25 miles) from
      Letterkenny and has degree and postgraduate programmes in disciplines ranging
      from computer science/games and robotics to psychology and nursing. The North-
      West Regional College a further education and high education college is also located
      in Derry (with campuses in Limavady and Strabane). The National Training Agency,
      FÁS, has a training centre located in Letterkenny. While Donegal Airport and the City
      of Derry Airport provide both domestic7, UK and European flights to the area. Both are
      approximately forty-five minutes from Letterkenny.

      4 Government of Ireland (2002) National Spatial Strategy for Ireland 2002-2020: People, Place and Potential.
      Available at: http://nss.ie/pdfs/Completea.pdf
      5 European Commission (1999) ESDP European Spatial Development Perspective.
      Available at: http://ec.europa.eu/regional_policy/sources/docoffic/official/reports/pdf/sum_en.pdf
      6 Available at: http://www.drdni.gov.uk/shapingourfuture/
      7 Flights flight from Donegal Airport to Dublin Airports operates daily supported by the Irish Government
      under a Public Service Obligation (PSO) route.                                                                 1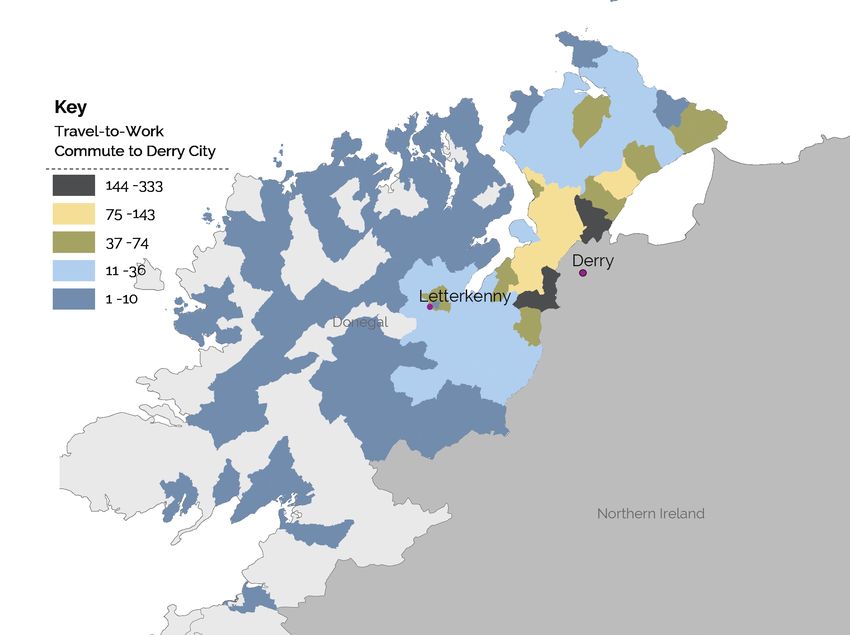
As a linked Gateway, Letterkenny plays a key role in the delivery of services and
    infrastructure across the international boundary which separates Northern Ireland
    and the Republic of Ireland. In a spatial context the co-designation of these two
    urban areas as a single Gateway is a logical choice; Derry is the second largest city
    in Northern Ireland with an urban area population of 105,0668 (and the 4th largest in
    the island of Ireland), and an important economic driver within its hinterland on both
    sides of the border. Letterkenny also features a sizeable hinterland that traverses
    both jurisdictions. Indeed, an analysis of census (2011) travel to work patterns further
    demonstrates their interdependencies (see section 1.1.1), with a notable proportion
    of East Donegal and the Letterkenny hinterland workforce commuting across the
    border to Derry for employment. The proximity of these two settlements to each
    other as well as to the joint hinterland which they serve reinforces this Gateway
    designation. Indeed more than 380,000 people live within a 60km radius of the
    Letterkenny Gateway9.

    Due to the lack of readily available statistical information for the Northern Ireland
    component required to complement the methodology adopted by the Index, it has
    not proven possible to undertake a full analysis of the Letterkenny-Derry linked
    Gateway. Instead all of the accompanying statistical analysis that is derived and
    reviewed in this report is confined to the Letterkenny element of the linked Gateway
    only. It was possible to analyse travel to work patterns from County Donegal, and
    to identify where people were travelling into Northern Ireland, using data derived
    from the 2011 Census of Ireland. While it has not been possible to incorporate data
    in respect of the Derry component of the Gateway in this instance (as for example
    travel to work data from the Northern Ireland Census 2011 is not available at the
    time of writing), there is significant potential for its future incorporation10.

    8 Northern Ireland Statistics & Research Agency (2011) Census 2011 – Population and Household
    Estimates for Northern Ireland.
    9 Available at: http://www.idaireland.com/locations/regions-of-ireland/north-west/
    10 For example, it may be possible for the Interreg IVA funded North-West SPACEial Project to analyse
    cross-border data through its remote sensing and GIS work, allowing for a much more detailed and
    inclusive data analysis of the Gateway. Available at: http://www.donegalcoco.ie/NR/rdonlyres/
    D1E05AC0-4CF6-49D1-8C22-AE575F3B06F7/0/MicrosoftWordSummaryofSPACEialNorthWest.pdf .
2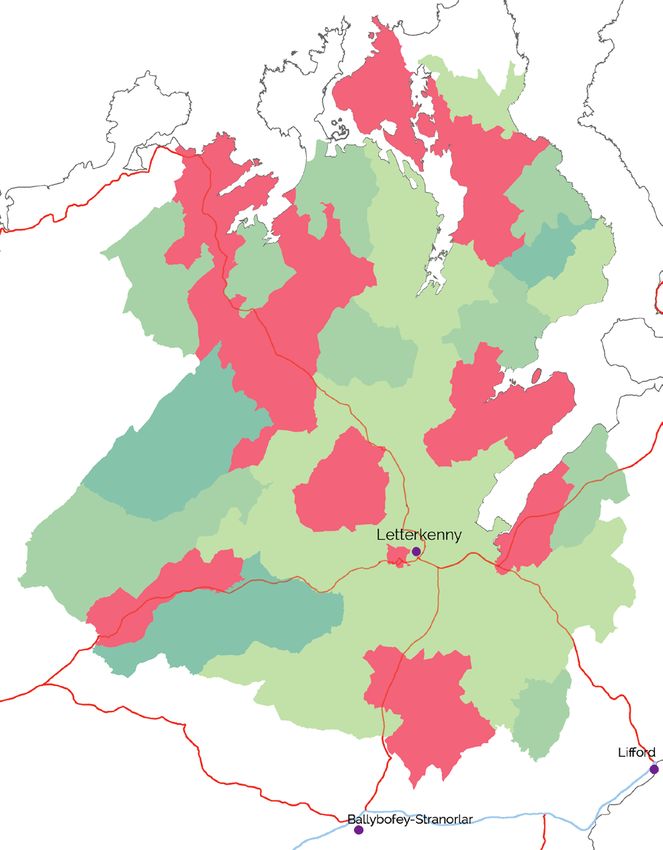
While the Gateway and Hubs Development Index (GHDI) 2012 focuses solely on the
Letterkenny Gateway, there remains merit in understanding how the Donegal Gateway
is performing and the data within this report can prove to be a valuable tool to continue
to monitor and understand the development needs and achievements of the Gateway
over time. It is therefore worth briefly looking at how the Gateway performed within the
2009 Gateway Development Index (GDI)11; this will be done using the same indicators
as used in the GHDI 2012 in order to enable comparison. The Letterkenny Gateway
was found to have been performing below the Gateway average of 5.0 in 2009, with
a composite Index score of 4.512. However, despite the weaknesses in the domains
of Affluence and Deprivation, and Enterprise and Employment, there were positives.
These positives included a strong performance in the Health and Wellness domain,
as well as above average population growth. In 2012 the GHDI score for Letterkenny
is 4.6, demonstrating that progress and improvements have been made overall within
the Letterkenny Gateway since 2009.

         »»The functional area of the Letterkenny Gateway can be seen to have
           contracted between 2009 and 2012;
         »»The western part of Zone 2 is largely unchanged from that which was
           evident in the original GDI study, but it no longer stretches north east into
           the Inishowen Peninsula and towards the border near Derry as it did in 2009.

11 In order to facilitate comparison between the GHDI 2012 and the GDI 2009, the 2009 Index has been
remapped across the 2011 Census boundaries to produce a comparative Index.
12 The 2009 GDI is available at: http://www.bmwassembly.ie/publications/other_reports/BMW_GDI_
Report.pdf.
                                                                                                       3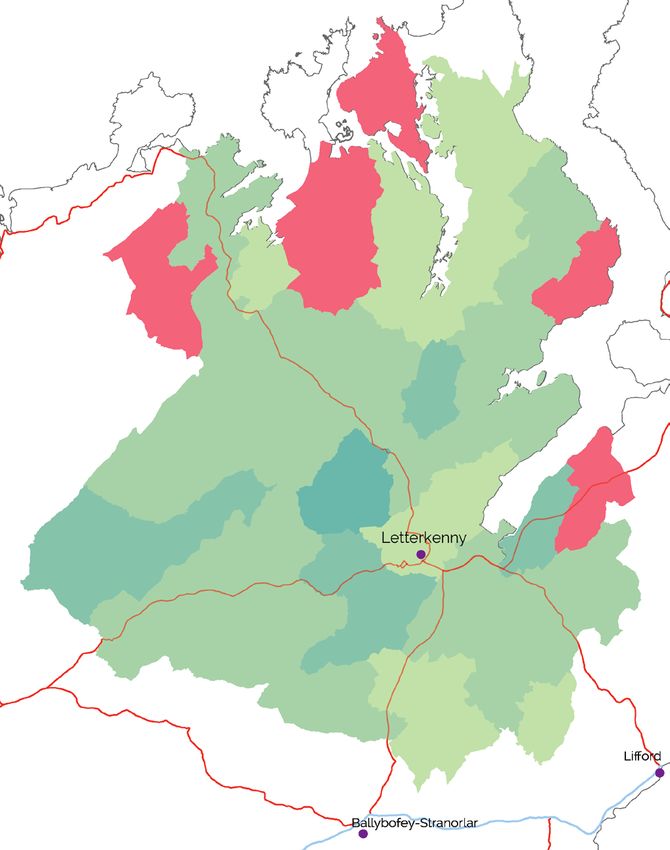
1.1.1     Cross-border context
      The Northern Ireland Census was released in 2013, and therefore was not available
      for full review during the preparation of the Gateways and Hubs Development Index
      2012. Accordingly, Letterkenny is assessed on an individual basis. However, a brief
      analysis of the cross-border relationship, from a work-based commuting perspective,
      has been undertaken to further inform and demonstrate the economic corridor that
      links these Gateway, as outlined below.

      The map above indicates the strength of this relationship with respect to the share
      of the work force in County Donegal that commutes to Derry City (in 2011). This
      percentage invariably ranges but, at its most significant, links in excess of 30% of the
      working population in area of Donegal to Derry City, in 2011. Some of the areas where
      the trend is most extensive include those areas closest to the border, such as Kilderry
      where, of 686 people in the workforce, 333 or 48.5% commute to Derry City, while in
      Killlea, of 543 people in the workforce, 261 or 48% commute to Derry City.

1.2   Use of POWSCAR Data
      The boundaries of the Cork Gateway have been defined using the Central Statistics
      Office (CSO) Place of Work, School or College Census of Anonymised Records
      (POWSCAR) data derived from the 2011 Census. Each Gateway is divided into two
      specific Zones for analysis, with Zone 1 defined as the city, legal town or small town
      and environs (as defined by the CSO, 2011), while Zone 2 has been defined as consisting
      of District Electoral Divisions (DEDs) where in excess of 20% of the resident population
      in employment commutes to the Gateway urban core for work. The use of POWSCAR
      data facilitates an understanding of the functional area of the Gateway, to examine
      its economic reach and to ascertain how it is acting as a driver of growth based on its
      NSS-identified role. Although the Gateway boundaries were defined from POWSCAR

 4
data, for the purposes of this analysis, data for travel to schools and colleges was not
      utilised. The rationale for this was to replicate as closely as possible the approach
      taken in the previous GDI boundary definitions as the travel to schools and colleges
      was not included in the POWCAR 2006.

1.3   Use of GeoDirectory Data
      GeoDirectory 2012 is a service, jointly established by An Post and Ordnance Survey
      Ireland, which provides a complete database of all of the buildings in the Republic
      of Ireland and their geolocation details. It holds records for 1.8 million properties.
      The database is regularly updated and no legacy or previous versions are retained13.
      In this case the GeoDirectory 2012 (used under licence), provides a snapshot for a
      particular point in time (Q1 2012). The GeoDirectory 2012 has been utilised in this
      project to determine the level of retail activity and the sectoral base/provision of
      services in the Gateways (and Hubs).

      13 The Q1 2012 version of GeoDirectory 2012 should be ‘frozen’ such that it can be considered in any future
      review and update of the Gateways and Hubs Development Index.
                                                                                                                    5
2.0 Policy Context
2.1 The Importance of Policy for Balanced and Sustainable
Regional Development
It is important to establish the overview spatial and socio-economic policy
and guidance frameworks which have had a bearing on the development and
performance of the Gateways and Hubs since their roles were established in the
National Spatial Strategy 2002-2020 (NSS)14 to date. Given that a range of strategic
national, regional and local-level policies have influenced the performance of these
designated Gateways and Hubs, understanding their effects, both positive and
negative is seen as an important step in informing the future direction of regional
policy in Ireland.
Nationally, Gateways are expected to act as strategically placed engines of growth
to enable its regions and by extension the country to grow to its potential, within
a national spatial and forward planning framework. With a strategic location both
nationally and relative to their surrounding environs, Gateways act as the main
providers of the area’s social and economic infrastructure and support services.
At a regional level, Gateways are positioned to guide more balanced regional
development, therefore should inform capital investment priority decisions. They
should facilitate their functional areas to harness their potential and provide a
framework for coordinating local planning (for example, alignment of population
targets with Gateways objectives, etc), while also strengthening the relationship
between urban and rural areas, and promoting sustainable forms of development.
The Gateways, supported by the nine designated Hubs, have been the main drivers
of the regional economy throughout the country, and, in the case of Dublin, the
national economy, albeit to different extents.
In terms of the Letterkenny Gateway, the NSS identifies the Gateway as having a
crucial role to play in driving forward effective economic and spatial ties with Northern
Ireland. The importance of developing a strategic transport corridor between the
two settlements to strengthen cross-border links and enhance the region’s links to
the large growth centres of Belfast and Dublin15 was recognised by the NSS. The
Regional Planning Guidelines (RPGs) for the Border Region 2010-202216 establishes
the framework for the development roles and capabilities of urban centres within
the Border Region and comprises the counties of Donegal, Sligo, Leitrim, Cavan,
Monaghan and Louth. In the case of Letterkenny the Border RPGs emphasises the
importance of co-ordinating infrastructural development with Derry and achieving
critical mass between the two settlements to ultimately energise the wider North-
West Region.
14 Government of Ireland (2002) National Spatial Strategy for Ireland 2002-2020: People, Place and
Potential. Available at: http://nss.ie/pdfs/Completea.pdf
15 Border Regional Authority (2002) Available at: http://www.border.ie/downloads/What%20the%20
NSS%20means%20for%20each%20County%20in%20the%20Region.pdf
16 Border Regional Authority (2010) Regional Planning Guidelines for the Border Region 2010-2022.
Available at: www.border.ie
6The longer terms priorities for the Gateway, as set out in the Gateway Investment
Priorities Study17, include the strengthening of research and innovation capabilities,
improving the Letterkenny-Derry transport axis and while also improving
transportation corridors to Dublin and Belfast.
The importance of an all-Ireland economy is particularly evident for the Letterkenny
Gateway. Significant linkages and opportunities exist in terms of the coordination
of the cross-border provision of health, retail, tourism, employment and transport
infrastructural services. In this regard, the work of the North-West Partnership Board
(NWPB), a multi-sectoral platform which draws its membership from the Donegal
County Development Board (CDB) and the Derry-Londonderry Strategy Board,
is particularly important. The partnership promotes active collaboration and a
coordinated approach to economic, social and cultural cross-border development
in the region. The NWPB builds on the work of the North-West Gateway Initiative
(NWGI) and will seek to identify the needs of the North-West Region and to harness
opportunities to meet these needs. A North-West Action Plan, incorporated mutual
interest areas identified in the County Donegal Development Plan 2012-2018 and the
Derry Regeneration Plan 2011 is currently being prepared by the NWPB. This is being
supported by the International Centre for Local and Regional Development (ICLRD)
and the North/South Ministerial Council.
2.2 Spatial Policy Landscape
National Spatial Strategy 2002-2020
The National Spatial Strategy 2002-2020 (NSS) was created as the principal national
strategic planning framework within Ireland18. As outlined above, Letterkenny was
designated one of nine Gateways, each of which is intended to develop as the
primary driver of sustainable economic and spatial development within their region.
Over the last decade the Gateway had seen its economic footprint grow while its
Gateway population has also expanded.
The NSS Update and Outlook Report, released in 2010, acknowledged that despite
the attainment of a certain level of success, specifically in the area of infrastructure
provision and compliance with the RPGs, a number of issues and challenges to the
achievement of the wider NSS objectives remain. The most notable of these relate
to settlement patterns and the way in which much of the development which took
place in recent years did so in an unsustainable manner, leading to a high level of car
dependence and the decline of many urban core areas.
One past policy which had a significant spatial dimension was decentralisation.
This was a programme to redistribute entire government departments and state
agencies with large numbers of civil and public servants from Dublin to various parts
of the country. The distribution did not, however, focus exclusively on relocating
departments/agencies to the Gateways and Hubs, Ireland’s designated engines for
growth. Of those departments/agencies that were relocated, 33%19 were relocated
17 Department of Environment, Heritage and Local Government and Forfás (2006) Implementing the NSS:
Gateway Investment Priorities Study, p. 30. Available at: http://www.forfas.ie/publication/search.jsp?ft=/
publications/2006/Title,741,en.php
18 Under the guidance and funding initiatives of the original National Development Plan 2000-2006.
19 Department of the Taoiseach, Department of Education and Skills, Department of the Environment,
Community and Local Government and Department of Foreign Affairs and Trade (January, 2012) Third
Report of the Organisational Review Programme. Available from: http://per.gov.ie/wp-content/uploads/
ORP-Third-Report.pdf. This percentage is derived from a cursory assessment of the initial phases of
decentralisation and relating them to their place of destination/relocation.
7to the designated Gateways and Hubs, thereby diverting a proportion of development
beyond those areas. Furthermore, a large share of future phases of decentralisation
were earmarked to move to towns which did not feature in the NSS.
In addition to strategic level policy and investment mechanisms, there have also
been regional and locally focused policies and strategies which have sought to
enhance the strategic vision of the NSS at a lower level, providing guidance to the
relevant authorities on how and where this development should take place. Amongst
the most notable of these are Regional Operational Programmes20 for the Border,
Midland and Western (BMW) Region, RPGs for the Border Region, and relevant
County Development Plans and Local Area Plans. Many are subject to review and
replacement within statutorily defined periods, and the manner in which they have
sought to fulfil the goals of the NSS has also evolved. In this way, resulting policies
have been influenced in their development by an extensive series of factors.
The Department of Environment, Community and Local Government (DoECLG)
recently announced their intention to undertake a full review of the NSS to be
completed by the end of 2014 or early 201521. The outcome of this review will have an
important bearing on the future development of Ireland’s Gateways and Hubs and
will have implications which inform Ireland’s approach to regional policy.
Regional Planning Guidelines
The Regional Planning Guidelines (RPGs)22 are an important element in controlling
how the goals of the NSS are achieved. Unlike the NDP, the RPGs have no financial
instruments (although they do include a chapter related to regional economic
strategies), but instead exert their influence through the establishment of an
integrated regional planning framework by ensuring that city and county councils
fulfil their obligation that all city and county development plans must be consistent
with the goals of the RPGs, and, as such, with the NSS. The RPGs were most recently
updated in 2010 and will be subject to a fundamental review in 2016 following the
planned reconfiguration of the eight Regional Authority (NUTS III) regions into 3
Regional Assemblies in 2014.
Local and Regional Government Reform
This recently unveiled local and regional government reform measure, contained
within the reform programme “Putting People First: Action Programme for Effective
Local Government”23, is intended as a comprehensive mechanism for the reform of
local government in Ireland. Local and regional bodies are involved in the development
and implementation of policies and the provision of funds which are designed to
give effect to the strategic goals of the NSS. The establishment of three Regional
Assemblies, as well as the amalgamation of a number of Local Authorities, as set out
in “Putting People First”, will have an important impact in relation to the delivery of
services and funding and the creation of policies in support of individual Gateways.
20 Funding was provided from various EU funds for the 2000-2006 programme and from the European
Regional Development Funds (ERDF) for the 2007-2013 programming period.
21 This announcement was made by Minister for the Environment, Community and Local Government, Phil
Hogan T.D, at the Regional Studies Association ‘New Regional Governance in Ireland’ Conference held on
21st January 2013.
22 Border Regional Authority (2010) Border Regional Planning Guidelines 2010-2022.
Available at: http://www.border.ie/downloads/RPGs/Regional%20Planning%20Guidelines%202010%20
-%202022.pdf
23 Department of Environment, Community and Local Government (2012) Putting People First: Action
Programme for Effective Local Government. Dublin: Stationary Office. Available at:
http://www.environ.ie/en/Publications/LocalGovernment/Administration/FileDownLoad,31309,en.pdf
8The three new Assemblies will be as follows:
»»Southern Region Assembly which will evolve from the existing Southern
and Eastern Regional Assembly (consisting of Munster and the south-east
counties of Carlow, Kilkenny and Wexford);
»»an Eastern and Midland Region Assembly which will be newly established
(consisting of the province of Leinster other than the south-east counties in
the Southern Region); and
»»a Connacht-Ulster Region Assembly which will evolve from the existing
Border, Midland and Western Regional Assembly (consisting of the province
of Connaught and the counties along the Border with Northern Ireland other
than County Louth).
These will assume all of the responsibilities previously held by the eight Regional
Authorities; within the context of the NSS. This means that these Assemblies
will be responsible after the 2014 Local Authority elections for the delivery and
administration of regional and economic strategies, including the continued
management of EU Regional Operational Programmes, all of which will be
influential in the future development of the designated Gateway and Hubs, as well
as the continuing implementation of the RPGs, which will run until 2016, pending
their replacement by the new regional strategies mentioned above, the preparation
of which will commence in 2014/15.
The Importance of the Regional Development Dimension
The strengthening of regional government is essential to ensure that regional
imbalances are addressed, and to manage the regional impact of national policies
and programmes. A regional approach to enhancing competitiveness, and
addressing the various strengths and weaknesses of individual regions, necessitates
appropriate regional structures being in place. One example of the importance
and potentially effective approach to regional development is seen in the recently
published National Strategy for Higher Education, which also advocates regional
clustering, wherein collaboration is fostered “between clusters of geographically
proximate institutions, to ensure that individual, enterprise and societal needs are
addressed in a planned, coherent and efficient way”. The report states that the
clustering model proposed complements the NSS and will benefit from ongoing
improvements in regional government structures24.
The Forfás Regional Competitiveness Agendas 201025 for the Border Region
highlighted the challenges relating to leadership and governance mechanisms to
develop and deliver on a coherent enterprise strategy, and the overcoming lower
productivity levels within the region. Positive developments identified include
a reduction in the number of ‘unskilled’ people within the labour force over the
past decade and early school leavers, and the emergence of employment in
internationally traded and financial services in the region.
24 Department of Education and Skills (2011) National Strategy for Higher Education, Report of the
Strategy Group. Dublin: Department of Education and Skills, p.84.
Available at: http://www.hea.ie/en/national-strategy
25 Available at: http://www.forfas.ie/media/forfas100121-Regional-Competitiveness-Agendas-Border.
pdf
9Planning Legislation
In terms of spatial planning legislative changes, the Planning and Development
(Amendment) Act, 201026 enhances the objective of supporting economic renewal
and sustainable development and strengthens the requirement for greater alignment
between the NSS and RPGs and city/county development plans and Local Area
Plans. In addition, the requirement by city and county councils to prepare a Core
Strategy grounded in an evidence-based assessment will augment development
plans, while ongoing reforms to specific aspects of legislation such as the construct
of ‘Part V’ (which relates to social and affordable housing) will ensure that the statutory
context is relevant and fit-for-purpose.
Resourcing Mechanisms for Spatial Policy
Prior to 2008, there was little by way of dedicated resourcing mechanisms (although
Gateways were prioritised in Government capital funding programmes) in place to
drive the implementation of national spatial policy. Furthermore, there has been
an evident slowdown in the implementation of national economic policy in recent
years owing to the scale of the prevailing economic conditions faced. One important
objective in resourcing Gateway development is the compatibility and alignment
of various programmes. For example, the Human Capital Investment Operational
Programme 2007-2013 (supported by the European Social Fund) specifically seeks to
align with the NSS, stating it “...will respect the work to be undertaken in implementing
the NSS and through financing of projects in each of the regions will seek to contribute
where possible to the aims of the NSS”27. The resourcing of Gateway development is
explored further in the next section.
2.3 Resourcing Gateway Development
Prevailing Economic Conditions
The economic circumstances which the country has experienced since 2008 have
impacted upon all policy decisions, and especially those relating to the allocation
of funding and investment, such as those required to facilitate the realisation of
objectives for Ireland’s Gateways and Hubs. Since this time, there has been a series
of funding cuts and new economic policies, each of which has sought to gain greater
control over public expenditure. In some cases there has been a direct impact upon
the implementation (such as in the case of deferrals of infrastructure investment
programmes) of the NSS as a result of these policies, while in other cases, the impact
has been indirect (such as reduced funding for health services which will have longer
term implications for the health of the population). The cumulative effect led to delays
in the realisation of NSS objectives within individual Gateways and Hubs.
Two National Development Plans (NDPs, those of 2000-2006 and 2007-2013) have
been in operation since the adoption of the NSS in 2002. The current NDP 2007-
2013, which is, in effect, no longer in operation (and has been taken over by capital
investment strategies, etc), has been much hampered by the effects of the economic
downturn in recent years; despite this, it has been a useful framework for channelling
investment to the Gateways.
26 Government of Ireland (2010) Planning and Development (Amendment) Act, 2010. Available at: http://
www.irishstatutebook.ie/pdf/2010/en.act.2010.0030.PDF
27 Department of Education and Skills (2012) Human Capital Investment Operational Programme 2007-
2013 Supported by the European Social Fund p.57
10The deferral of the Gateway Innovation Fund (GIF) in 2008 has removed a vital funding mechanism specifically intended to enable the delivery of necessary flagship infrastructure and to aid in the realisation of goals and objectives within the individual Gateways. An initial Exchequer provision of €300 million over three years 2008-2010, was envisaged for the GIF28. Separately the two Regional Assemblies introduced grant schemes to utilise the European Regional Development Fund (ERDF) advances to the Regional Operational Programmes 2007-2013 to fund a number of Gateways and Hubs projects. These schemes funded Gateways and Hubs projects in the BMW Region providing over €17 million in grant aid and Gateway projects in the S and E region with over €11 million in grant aid. The combined investment under both schemes across the two regions is €50.5 million. Impact on the Letterkenny Gateway The slower delivery of the strategic goals originally envisaged within each Gateway and Hub has predominantly arisen from the national funding restrictions and new government policies introduced in the last number of years. The impact is particularly noted in relation to the reduced public investment in physical infrastructure. The reduction in revenues which many Local Authorities have experienced due to the collapse in development contributions and a reduced rates base have served to further undermine the delivery of NSS objectives within individual Gateways and Hubs already experiencing funding cuts from national funds. This decline in development and infrastructure funding has impacted upon the realisation of the goals of the Letterkenny Gateway with the suspension and cancellation of a number of projects such as the N56 Letterkenny Relief Road, the A5 Monaghan to Derry, the N14 Letterkenny to Lifford national primary route, as well as two major decentralisation projects, and most recently a multi-cultural centre for Letterkenny. Gateway Investment There have been some focused policies and strategies which have sought to enhance the strategic vision of the NSS at the regional and local level (as discussed earlier), providing guidance to the relevant authorities on how and where this development should take place. Amongst the most notable of these are Regional Operational Programmes29 managed by the Border, Midlands and Western Regional Assembly Area (BMW), the RPGs for the Border Region, and the relevant County Development Plans and Local Area Plans. Many of these are statutory in nature, and are subject to review and replacement within statutorily defined periods, and the manner in which they have sought to fulfil the goals of the NSS has also evolved. In this way, resulting policies have been influenced in their development by an extensive series of factors. The European Regional Development Fund (ERDF) co-funded Gateway Grant Scheme funding mechanism managed by the Border, Midland and Western Regional Assembly30 is designed to assist and support economic, social and environmental enhancements within Gateways, with a specific emphasis on regeneration, infrastructure, cultural, and sustainable energy projects. The Letterkenny Gateway recently received ERDF funding for the repaving and refurbishment of Upper Main Street, and for enhanced traffic management and pedestrian linkages31. 28 Details are available at: http://www.irishspatialstrategy.ie/. 29 Funding was provided from various EU funds for the 2000-2006 programme and for from European Regional Development Funds (ERDF) for the 2007-2013 programming period. 30 European Regional Development Fund co-funded Gateway Grant Scheme. Information available at: http://www.bmwassembly.ie/gateways/about.html. 31Further information available at: http://www.bmwassembly.ie/gateways/letterkenny.html 11
A number of EU funding programmes are available to support the economic
      development of the cross-border region. These include Peace III, Interreg IVA and
      others which have supported a broad range of projects in recent years such as the
      North-West SPACEial project, Project Kelvin, marine tourism, regeneration, and a
      number of urban and rural development projects. Forthcoming EU cross-border
      funds, Interreg V and Peace IV, will play a major role in supporting the development
      of the North-West Region from 2014 onwards.

      The Transport 2132 programme, which ran between 2005 and 2010, has resulted in
      significant improvements in terms of infrastructural connectivity throughout the island
      of Ireland. These infrastructural improvements have led to a much more efficient
      transport system, especially between Dublin and the other designated Gateways
      and Hubs, as well as within the Gateways and Hubs themselves. However, despite
      the level of investment which the inter-urban motorway network has received,
      Letterkenny is one of only two Gateways which is not connected to the capital by a
      direct motorway link, nor are there any rail links to County Donegal.

2.4   Emerging Policy Landscape
      In response to the economic downturn, initiatives and strategies have been developed,
      and subsequently superseded. However, in many cases it is noteworthy that such
      policies have not incorporated an overtly regional dimension, notwithstanding the
      fact that the NSS Update and Outlook report identified that successful regional
      development depends upon effective interaction of policies and funding strategies
      from a wide range of government departments, local and Regional Authorities, and
      private sector investment.

      The recession brought with it a vast increase in the number of people who found
      themselves out of work. Economic recovery is predicated upon a reversal of this
      trend, and an emphasis on sustainable economic growth has become a government
      priority. Upon its release in 2010, the primary focus of the National Recovery Plan
      2011 - 201433 was to promote nationwide economic recovery. This plan sets out a
      series of reforms of both a fiscal and structural nature, designed to make the country
      more competitive and attractive, and in doing so, develop new markets for existing
      and developing Irish goods, attract additional Foreign Direct Investment (FDI) (the
      Industrial Development Authority advocates a regional spread of FDI in Ireland), and
      make Ireland an attractive place in which to do business.

      One constraint of this plan is the lack of a regional focus. The prioritisation of economic
      recovery at a national level, while perhaps reflective of the scale of the economic
      difficulty Ireland is in, has failed thus far to take account of structural weaknesses at
      a regional spatial scale. In this way weaker parts of the country which were already
      struggling more than other areas may not be allowed to recover as quickly as they
      should. It must be noted that in 2012 there has been a significant growth in FDI beyond
      the Dublin region, with the IDA announcing the delivery of 12,722 jobs in 2012 alone,
      representing a net increase of 6,570 for the year34, with notable FDI jobs gains in the
      Dundalk, Sligo, Galway and Limerick regions. In the case of Letterkenny, recent FDI
      investments include Zeus, the US head quartered medical device company, which is

      32 Available at: http://www.transport.ie/viewitem.asp?id=7048&lang=ENG&loc=1850
      33 Government of Ireland (2010) National Recovery Plan 2011-2014, Dublin.
      Available at: http://www.budget.gov.ie/RecoveryPlan.aspx
      34 Available at: http://www.idaireland.com/news-media/press-releases/ida-ireland-client-compan/
      Index.xml
12
investing €10m in a 40,000sq ft expansion and creating 75 new manufacturing jobs
over 3 years. This expansion of its facility is at the IDA Business and Technology Park,
Letterkenny.
National Recovery Policy and Investment Framework
Following on from the National Recovery Plan, the Capital Investment Framework
2012-201635 document was designed to assess the existing and future capacity
requirements of the Country’s infrastructure, in order to ensure that it is capable
of facilitating the essential economic growth required to bring the country out of
recession. Where an infrastructure deficit or funding requirement is identified and
justified, the policy states that where possible capital will be made available to
address this. The primary motivation for this policy is to ensure that, in spite of the
limited amount of funding available, necessary infrastructure developments and
financial support for fledgling businesses will be obtainable.
The National Action Plan for Jobs policy document published in 2012 seeks to
reinforce the Government’s role as an employment facilitator rather than as a jobs
provider. To this end, the document identifies seven principal areas on which to focus
job creation activities within the coming number of years. The focus of these activities
is primarily on enhancing the ability of Irish business to compete both nationally
and internationally, encouraging entrepreneurship, identifying new markets, and
developing new or as yet under developed sectors, while also looking to attract new
FDI and incentivise the expansion of existing operations, with a specific emphasis on
the research sector. The National Action Plan for Jobs acknowledges the requirement
for a regional focus, and sets out individual objectives which encompass a regional
dimension; it also makes a commitment that government will commit ”...to ensuring
that job creation measures are targeted in a balanced way across all regions. The
IDA is committed to delivering 50% of investments to areas outside Dublin and
Cork”36. However, while the National Action Plan for Jobs makes no direct reference
to the NSS being a more specific set of actions than a broad policy document, the
publication of quarterly progress reports will outline the level of delivery of measures
targeted for each quarter, with some measures having a regional focus.
In terms of promoting cross-border linkages between Letterkenny and Derry, the
North-West Action Plan, which is currently being prepared by the North-West
Partnership Board (NWPB) will be a significant driver for the cross-border Gateway
going forward.
2.5 The Importance of the Gateways and Hubs Development
Index to Inform Policy
The continued pursuance of balanced regional development and the development
of designated areas to drive regional growth (such as Gateways and Hubs) should
be seen as an integral part of the economic recovery of the country. One of the
key lessons which should be learned from the period leading up to the economic
downturn is in the area of the decision making process; poor decisions lead to poor
outcomes. In many cases, the absence of comprehensive evidence to inform policy
makers undermined the quality of decision making processes. Policy decisions
35 Government of Ireland (2011) Infrastructure and Capital Investment 2012–2016: Medium Term
Exchequer Framework, Dublin. Available at: http://per.gov.ie/wp-content/uploads/Infrastructure-and-
Capital-Investment-2012-2016.pdf
36 Government of Ireland (2012) National Action Plan for Jobs 2012, p.15.
13informed on the basis of accurate and reliable information will help to avoid the type
of poor decisions which have proved so damaging in our recent past, and result in
more sustainable settlement patterns, economic and regional development.
The Gateways and Hubs Development Index (GHDI) study represents a valuable
opportunity to use a comprehensive and accurate evidence base to provide a solid
foundation on which to make decisions on the development of those Gateways and
Hubs which are meant to form the key drivers of Ireland’s economic development.
The manner in which it has been designed and compiled allows for it to be scalable
from the individual Gateway and Hub level to regional and national levels, as well as
being intended for ongoing update and renewal. In this way, it can be used to assist
in the formulation and implementation of successor regional development policies.
At the level of individual Gateways and Hubs, the opportunity to exploit an evidence-
based approach to policy formulation, especially in the formulation of core strategies,
can result in the more effective identification of potential barriers and the measures
capable of addressing them. The insight which the GHDI provides can inform
regionally specific development agendas and facilitate the identification of core
strengths or weaknesses that need to be addressed. A detailed assessment of the
progress of the Letterkenny Gateway, as well as all of the other Gateways and Hubs,
is seen as a useful tool in the process to determine relevant trends and performance
measured across a set of selected socio-economic indicators. In this way, the GHDI
can play an important part in ensuring a more effective evaluation of how Gateways
and Hubs are developing.
143.0 Letterkenny Gateway Development Index
3.1 Individual Domain Analysis
The analysis of the Gateway is undertaken using a series of eight domains and
constituent indicators, respecting where possible those originally adopted in the
Gateway Development Index (GDI) 2009. The Gateways and Hubs Development
Index (GHDI) 2012 does reflect some minor changes in the suite of indicators used
compared to the 2009 Index. While a small number of data sources were no longer
collected additional indicators have been identified at relevant spatial levels which
serve to further improve the evolution of the Index. The domains and indicators
consist of:
Interpreting the Analysis
»»The Gateways and Hubs Development Index 2012 – this refers to the compilation
of a dataset based on data available across all domains to year end 2012, set
against two geographical zones established using Census 2011 settlement and
labour market flow data.
»»The Gateways Development Index 2009 – in order to facilitate comparison
between the GHDI 2012 and the GDI 2009, the 2009 Index has been remapped
across the 2011 Census boundaries to produce a comparative Index.
»»Gateway Score (Zone 1 and Zone 2) is calculated based on total figures for the
combined gateway. Gateway scores may differ from strict averages based on
the population, size and composition of individual zone characteristics.
»»Comparison of Index Scores Over Time: Care should be taken to note that in the
comparison of the Index scores, as presented within the summary assessment
section of each domain assessment, these scores have been calculated
against the Gateway average for the respective year. As a result the average
score will change between years. Consequently, improvements over time
(in raw numbers), may not actually match the pace of improvement for other
Gateways.
153.2 Population37 4
3.2.1 Population Growth
Indicator Description: Actual change in the number of persons resident within the
defined area. This figure consists of the population of the CSO-defined (2011) urban
cores of the Gateway (Zone 1), and the surrounding area where more than 20% of the
resident population in employment commute to the Gateway (Zone1) for the purposes
of work (derived from CSO POWSCAR, 2011) (Zone 2). As a regional growth centre, a
Gateway’s population should typically grow at a pace in excess of the national growth
rate (8.24% between 2002 and 2006, and 8.22% between 2006 and 2011).
The population of the Letterkenny Gateway in 2011, according to CSO census data
produced by the 2011 Census is 50,54238. This population figure illustrates an increase
of 10.83% on that recorded in 2006, and 23.65% from 2002; the rate of population
change between 2002 to 2006 and 2006 to 2011 decreased by 0.74%. Population
increases within Zone 1 account for the majority of this growth; between 2002 and
2006 population growth of 9.26% occurred within Zone 2 in comparison to 15.46%
within Zone 1. The figures for 2006 to 2011 show that the pace of population growth
within Zone 1 had decreased to 11.38%, but remained ahead of Zone 2, which had
increased to 10.48%. Although both zones continue to demonstrate sizeable growth
in population, it is noted that the percentage growth rate within the urban core of the
Gateway, centred on Zone 1 has remained higher than that demonstrated by Zone 2.
This is a desirable trend which should be retained and exploited to the advantage of
the Gateway and its future development. By comparison, the average growth rates for
all Gateways was 5.90% for Zone 1, 12.06% for Zone 2, and 8.44% for the Gateway as a
whole.
37 The population share figure was not used in the final compilation in the 2009 GDI report, and was not
carried out within this report.
38 This figure consists of the population for the Letterkenny urban area and all surrounding areas where
more than 20% of the resident population in employment commute to the urban core (Zone 1) of the
Gateway for the purposes of work (derived from CSO POWSCAR, 2011).
16Population Growth
2006-2011
Age Dependency
Change 2006-2011
173.2.2 Age Vibrancy of Population39
Indicator Description: The number of those within the age cohorts of children 14
years or under and adults 65 years and older, as a proportion of the total working
population. As regional growth leaders, Gateways should experience and attract
inward migration of those of working age. Therefore increases in the core working
age cohorts (here defined as the 15-64 age cohorts) will occur in successful Gateways
and can be identified by measuring changes in relative age dependency rates.
Analysis of the dependency ratio for the Letterkenny Gateway in 2011 reveals that
45.41% of the population living within the urban area (Zone 1) are classified as being
dependent; this compares with 46.38% in 2002 and 43.00% in 2006. There have been
some changes in the dependency ratio within Zone 2, decreasing from 57.71% in 2002
to 56.88% in 2006 and increasing again to 58.74% in 2011. The overall stability of the
combined Zones 1 and 2 is evident, with identical figures produced for both 2002 and
2011 of 53.29%40, while the adult and youth dependency rates are 17.03% and 36.27%
respectively (which compare to the average for all Gateways of 17.03% and 32.50%
respectively). This dependency ratio is considerably higher than the national Gateway
average of 49.53%, and represents an increase of 2.07% over the figure produced in
2006 (51.22%).
39 The age dependency rate variable for the age vibrancy indicator is derived from CSO Census data. It
should be noted that, in reality, there is likely to be substantial numbers of people aged 15 years and over
that remain in full time education as well as a significant proportion of those who are aged over 65 and still
form part of the work force.
40 This in effect means that for every 100 people within the Gateway, there are 47 within the productive
age group cohorts and 53 who are in the dependent age group cohorts; these figures do not take into
account those who are unemployed, disabled or incapable of work for some other reason.
183.2.3 Assessment41
»»Under the Population domain the Letterkenny Gateway’s composite Index
score was 5.1 in the 2012 GHDI compared to 4.9 in the 2009 GDI, this reflects
an increase of 0.2.
»»Under the Population domain the Letterkenny Gateway’s Zone 1 Index score
was 5.6 in the 2012 GHDI compared to 5.6 in the 2009 GDI, this reflects no
change.
»»Under the Population domain the Letterkenny Gateway’s Zone 2 Index score
was 3.9 in the 2012 GHDI compared to 4.0 in the 2009 GDI, this reflects a
decrease of 0.1.
The population of the Letterkenny Gateway continued to increase above the
Gateway average between the years 2006-2011, although at a slower rate than
that which took place between 2002 and 2006. The Border Regional Authority
Planning Guidelines 2010-2022 set out a population growth target for the urban
centre of the Letterkenny Gateway of 13.69%. In contrast, within the GHDI study,
Zone 1 of the Gateway produced a growth figure of 11.38%. It is important to note
that these figures are not directly comparable due to boundary differences. Zone 1
did outperform Zone 2 in terms of the overall increase in population, which can be
seen as a positive result for the Gateway.
The 2011 dependency ratio for the Gateway as a whole is higher than average for
the Gateways, particularly for Zone 2. The relatively high youth dependency rate,
which is considerably above the average for all Gateways, is also further evidence
of a naturally expanding Gateway population.
Population Growth
2002-2011
41 Comparison of Index Scores Over Time: Care should be taken to note that in the comparison of
the Index scores, as presented within the summary assessment section of each domain assessment,
these scores have been calculated against the Gateway average for the respective year. As a result the
average score will change between years. Consequently, improvements over time (in raw numbers),
may not actually match the pace of improvement for other Gateways.
193.3 Enterprise and Employment
3.3.1 New Firm Formation
Indicator Description: The number of Value Added Tax (VAT) registrations by new
firms per 1,000 of the labour force. Gateways that are developing successfully should
experience faster growth rates in new firm formations than the national average.
The level of new firm formation which is evident for 2011 within the Letterkenny
Gateway shows that there were 5.42 new firms established for every 1,000 employees
within the Gateway, which is considerably less than the average new firm formation
figure for all Gateways of 7.29. This latest figure shows a decline of 5.62 firms per
1,000 employees42 in comparison to the figures for 2006 (11.05). The rate of new firm
formation is largely equal between the Zones, with Zone 1 producing 5.16 and Zone
2 5.60 new firms per 1,000 employees, illustrating a difference of only 0.44 new firms
between the two. This serves to illustrate the largely uniform nature of new firm
formation which occurs in both Zones of the Gateway.
3.3.2 Sectoral Base and Provision of Services
Indicator Description: Analysis of the sectoral base, as an indicator of economic
activity is informed by the quantity of services within all enterprises of the Gateway,
and gives a valuable insight into the economic development of the Gateway. Results
are presented as a percentage of all services within the national economy which
occur in this Gateway (the share of services in the economy), and compared with the
percentage of the national population which is present within the Gateway.
The quality of the sectoral base is calculated based on the share of services in the
total number of companies using the NACE coding (an EU statistical classification) of
businesses in the GeoDirectory 2012 (database of all Irish buildings and addresses).
42 It is important to note that this indicator does not account for the scale of operation of the new business
entity. It includes all new VAT registrations of newly formed firms regardless of the size, type or character
of the new firm.
20You can also read