RESPONDING TO COVID-19 - Almanac Highlights June 4, 2020 update - Marsh ...
←
→
Page content transcription
If your browser does not render page correctly, please read the page content below

RESPONDING
TO COVID-19
Almanac Highlights

June 4, 2020 update

INTRODUCTION: OLIVER WYMAN COVID-19 ALMANAC

Context and purpose                                          What is it?

The novel coronavirus has infected hundreds                  COVID-19 is the name for the illness caused
of thousands of people globally and is taking                by the novel coronavirus that originated in Wuhan,
a severe toll on individuals, families, and economies        China in December 2019
as productivity drops and stock markets reflect
increased global uncertainty                                 It is from the same family of viruses that cause some
                                                             common colds, as well as Severe Acute Respiratory
This document provides a sample of available baseline        Syndrome (SARS) and Middle East Respiratory
facts and guidance for business leaders as to critical       Syndrome (MERS)
questions to address in the immediate and near-term
to ensure the continuity of their business and the safety,   It is considered similar to other respiratory infections
health, and wellbeing of their workforce and customers       such as influenzas; symptoms range from fever, cough,
                                                             shortness of breath to more severe cases of pneumonia
                                                             and organ failure

© Oliver Wyman                                                                                                          2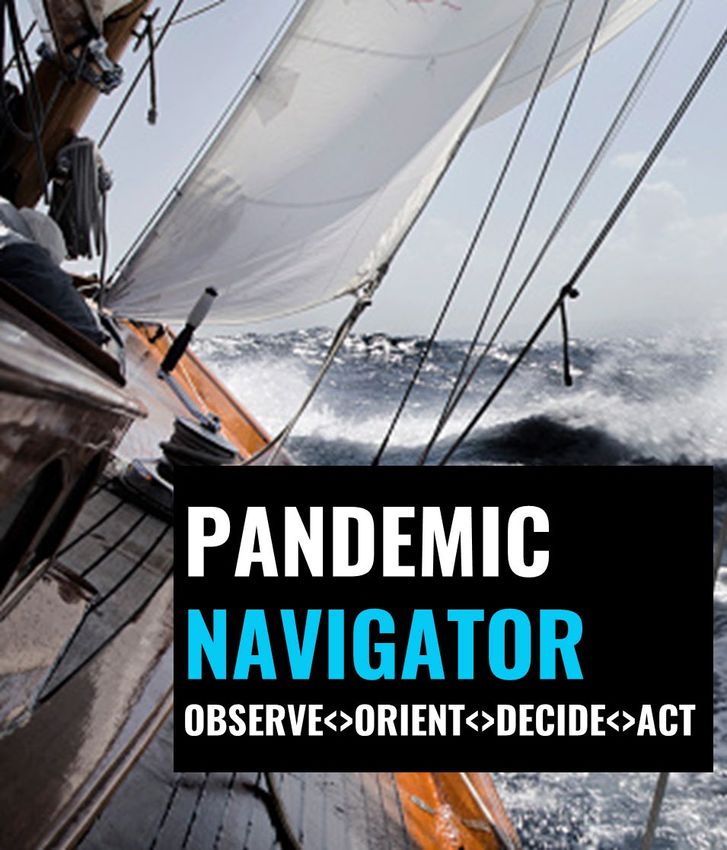
OUR DETAILED ALMANAC CONTAINS THE LATEST PERSPECTIVES ON KEY AREAS
RELATED TO THE COVID-19 PANDEMIC
                       Key Topics                             Summary

Epidemiologic          • Epidemiological background           • Coronavirus, declared a pandemic in March 2020, has infected millions globally
perspectives           • Up-to-date statistics by geography   • The virus displays unique and deadlier characteristics than other known diseases
(Sample pages 4-6)                                            • The pace and maturity of infection is highly variable by region, largely hinging
                                                                on speed and strength of government response
First peak suppression • Current state of suppression         • Many countries have effectively suppressed the first peak through a range of measures,
and road to re-opening   by geography                           but re-opening and recovery is just beginning
(Sample pages 7-8)     • Requirements for re-opening with     • Health system capacity, testing, tracing, surveillance and social distancing are key tools
                         detail on key capabilities             on the road to re-opening
Re-opening             • Strategic framework for re-opening • Government policies, which must balance public health with restoring economic health,
considerations         • Economic considerations              will shape the next phases of the pandemic
(Sample pages 9-11)

Lessons learned from   • Global lessons learned               • As countries re-open, we are crystalizing best practices and assessing regions with greatest
re-opening             • US opening approach and risk of        risk of further disruption
(Sample pages 12-13)     disruption
                       • Employer implications
Oliver Wyman           • Overview                             • Oliver Wyman has developed a unique time-dependent SIR model to forecast the spread of
Pandemic Navigator     • Example capabilities                   the virus at the state and county level called the Pandemic Navigator Core Model
(Sample pages 14-18)   • Web-based version to explore         • Along with a number of methodologies and tools, Pandemic Navigator provides business
                                                                leaders and policymakers with the data needed to make informed decisions through the
                                                                crisis
                                                              • A sample of the Pandemic Navigator is available freely online
Vaccines and           • Therapeutics in development          • Effective therapies and an eventual vaccine will be critical to bring economies
therapeutics           • Vaccine development timeline and       and communities fully “back to normal” - further testing and drug development is to come,
(Sample pages 19-20)     current state                          and timelines are long
                       • Key considerations and unknowns      • Constantly evolving understanding of the disease and limited understanding of the immune
                                                                response to it propagates uncertainty around how and when the pandemic will resolve
Macroeconomic          • Most recent forecasts of US and      • Latest GDP forecasts predict a severe shock to the US economy,
outlook                  global GDP and US unemployment         mirrored by unemployment levels
(Sample pages 21-22)                                          • Return to pre-COVID levels is anticipated early 2022
© Oliver Wyman                                                                                                                                                 3
Information as of 6/1/20
COVID-19 TRENDS AND SPREAD OF THE DISEASE
Cumulative confirmed cases continue to rise across the world, but the epicenter is beginning to shift away from Europe
and towards South Asia, the Middle East, and South America
Cumulative Confirmed Cases of Active cases per day of COVID-19 New Cases Per Day of COVID-19
COVID-19
2,500,000 1,400,000 70,000
1,200,000 60,000
2,000,000
Large increase due
1,000,000 50,000 to new cases
reported by Italy
and Spain
1,500,000
800,000 40,000
600,000 30,000 Updates to
1,000,000
Measurement
Updates to Definitions1
Measurement 400,000 20,000
Definitions1 Updates to
500,000 Measurement
200,000 Definitions1 10,000
Rest of0 World 0 0
12-Feb
4-Mar
6-May
22-Jan
25-Mar
15-Apr
27-May
12-Feb
4-Mar
6-May
19-Feb
4-Mar
1-Apr
22-Jan
22-Jan
25-Mar
15-Apr
27-May
5-Feb
18-Mar
15-Apr
29-Apr
13-May
27-May
China US Europe2 South America Asia/Middle East Africa Rest of World
Source: John Hopkins University & Medicine Coronavirus Resource Centre
1. Until February 17, the WHO situation reports included only laboratory confirmed cases causing a spike in total cases. Some sources include this update as of February 13. The jump due to inclusion of non lab
confirmed cases is not included in the new cases data in WHO situation reports.; 2. Includes countries categorized under “European region” based off of latest WHO Situation Reports
© Oliver Wyman 4
Information as of 6/1/20

HOW DOES COVID-19 COMPARE TO OTHER DISEASE OUTBREAKS? (1 OF 2)
COVID-19 is currently more deadly and contagious than the Flu, but the science on transmission and mortality
continues to evolve

Case Fatality Rate1                                                                                                                                Additional details
Log scale                                                                    Legend and key statistics
                                                                                 SARS
 100%                                                                                                                                              • R-naught (R0) represents the number of cases
                                     Bird Flu                                    8,096 infected | 774 deaths
                                                                                                                                                     an infected person will cause
         More Deadly

                                                Ebola                                                                                                – Initial estimates suggested COVID-19 R0
                          MERS                                                   MERS
                                                            Smallpox             2,494 infected | 858 deaths                                           is between 2 and 3 (with edge of range
                             1918                                                                                                                      estimates closer to 1.4 and 3.6), which
  10%                  Spanish Flu                                               1918 Spanish Flu                                                      means each person infects 2–3 others3;
                                                 SARS                            ~500 MM infected | ~50 MM deaths                                      R0 for the seasonal flu is around 1.34
                                       Case Fatality Rate                                                                                            – New emerging estimates suggest R0 may be
                                     & Transmission Range                        COVID-19                                                              closer to 5.7 (edge of range 3.8–8.9)6
                                                                                 ~6.2MM infected | ~375 K deaths
                                                                                                                                                   • Early evidence suggests COVID-19’s
    1%                                                                                                                                               transmission is highly variable, with most
                                                                                 H1N1 Swine Flu
                                                                                                                                                     infections resulting in no subsequent infections
                                                                                 700 MM–1.4 BN infected | 284 K deaths2
                                                                                                                                                     and a few resulting in many, which should color
                                                                                                                                                     response7
                                       H1N1 Swine Flu                                                                      Measles                 • The global case fatality rate for confirmed
 0.1%                                                                                                                                                COVID-19 cases is currently 6.0%5 according
                              Seasonal Flu                                                                                                           to WHO’s reported statistics versus 0.1%
                                                                                                                                                     for the seasonal flu; the rate
                                                                          Chickenpox                                                                 varies significantly by country
                                 Common cold                                                                                                         (e.g. Italy – 14.4%,
                                                                                                           More contagious                           South Korea – 2.4%5)
                                1                            5                                   10                                   15           • We expect case fatality rates to fluctuate
                                                                                                                                                     as testing expands identifying more cases
                                         Average number of people infected by each sick person (R0)                                                  and as existing cases are resolved
    Denotes Coronaviruses

1. New York Times (link) for fatality and R-naught comparisons, CDC timelines for case numbers (selected link: CDC SARS timeline); 2. Updated CDC estimates (link); 3. The R0 for the coronavirus was estimated
by the WHO to be between 1.4–2.5 (end of January estimate) (link), other organizations have estimated an R0 ranging between 2–3 or higher (link); 4. CDC Paper (link); 5. Calculated as Number of Deaths/Total
Confirmed Cases as reported by John Hopkins University. 6. Emerging Infectious Diseases (link) 7. Science (link)

© Oliver Wyman                                                                                                                                                                                                    5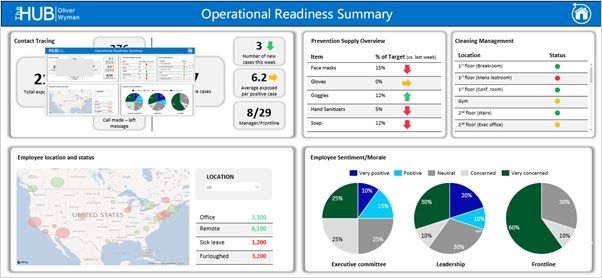
Information as of 6/1/20

AT A GLANCE: SUMMARY FACTS

                                 Key facts                                                                                                                  Implications
Contagion                        • Initial estimates suggested COVID-19 R0 is between 2 and 3 (with edge of range                                           COVID-19 is at least twice as contagious
                                   estimates closer to 1.4 and 3.6), which means each person infects 2–3 others3;                                           as the seasonal flu
                                   R0 for the seasonal flu is around 1.34
                                 • New emerging estimates suggest R0 may be closer to 5.7 (edge of range 3.8–8.9)14
                                 • Early evidence suggests COVID-19’s transmission is highly variable, with most infections
                                   resulting in no subsequent infections and a few resulting in many, which should color
                                   response17
Current human                    • No herd immunity exists yet as the virus is novel in humans                                                              Social distancing (quarantines, WFH, school
immunity                                                                                                                                                    closures) is the only “brake” to slow spread
Incubation period                • The incubation period is a median of 5.5 days (up to 14 days)1, 10, (vs 3-day period                                     People are contagious for longer periods
                                   for common flu1); data suggests that viral shedding continues beyond symptom resolution6                                 than the flu or other illnesses, requiring
                                                                                                                                                            longer bouts of quarantine to suppress spread
Fatality                         • Case fatality rates are trending at 6.0% globally8 (vs. 0.1% for flu)9                                                   Fatality is orders of magnitude higher than
                                 • Estimates for infected fatality rate are 0.3%–1.3% based on assumptions around                                           typical influenzas
                                   the number of undiagnosed individuals13
Portion of cases                 • COVID-19 can be spread asymptomatically5                                                                                 People who feel “fine” are capable of –
asymptomatic                     • In retrospective studies of those people tested and confirmed positive for COVID-19,                                     and are – transmitting COVID-19 to others
but contagious                     experts estimate 18–30% are asymptomatic, with another 10–20% with mild enough
                                   symptoms to not suspect COVID-1911
                                 • Early indicators from point in time comprehensive testing of small populations
                                   (e.g. Vo, Italy; Iceland) suggest as many as 50% of cases could be asymptomatic12
                                 • In cohorts of younger individuals (e.g. pregnant woman, sailors on USS Theodore)
                                   the proportion of asymptomatics exceeded 60%15, 16
Portion of cases                 • Approximately 19% of confirmed cases are considered “severe” or “critical”, requiring                                    Hospital systems risk being overtaxed (ICU
reaching “critical”/               hospitalization; 1/4th of those need ICU beds7                                                                           beds, ventilators, PPE) meaning case fatality
“severe” infection                                                                                                                                          rates could rise further

1. CDC. 3. The R0 for the coronavirus was estimated by the WHO to be between 1.4–2.5 (end of January estimate) (link), other organizations have estimated an R0 ranging between 2–3 or higher (link); 4. CDC
Paper (link); 5. JAMA. “Presumed Asymptomatic Carrier Transmission of COVID-19” 6. MedRxIv. “Clinical presentation and virologic assessment of hospitalized cases of coronavirus disease 2019 in a travel-
associated transmission cluster”. Mar 8. 2020. 7. China CDC, JAMA (link). 8. JHU. 9. CDC. 10. Annals of Internal Medicine (link) 11. Nature (link), Eurosurveillance Paper (link) 12. ZMEScience report (link) 13. SARS-
CoV2 by the numbers (link) 14. Emerging Infectious Diseases (link) 15. Business Insider (link) 16. NEJM (link) 17. Science (link)

© Oliver Wyman                                                                                                                                                                                                         6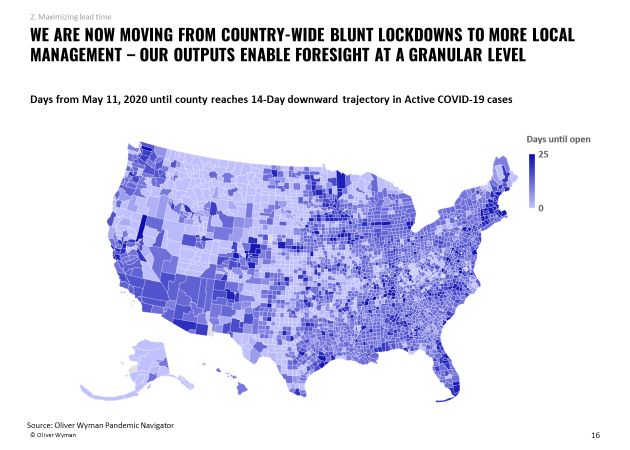
WHAT DOES IT TAKE TO REOPEN ONCE THE FIRST PEAK IS SUPPRESSED?
   Capability1                                                                              Where are we?
                      1: Health system capacity                                             Most countries and US states have sufficient
                      The personnel, PPE, beds, and other equipment                         capacity though a few hot spots remain at
                      to sustainably manage normal healthcare needs                         the margin
                      and a potential new surge

                      2: Testing                                                            US as a whole and many European countries are
                      Sufficient rapid testing to screen essential workers,                 making progress on building necessary capacity,
                      conduct random testing, effectively contract trace                    some European and Asian Countries (Germany,
                      and ID new flareups                                                   Norway, S. Korea) and specific US States (CA)
                                                                                            have adequate supply

                      3: Contact tracing                                                    Most countries lack adequate capacity; rapid staff
                      Identification, testing, and isolation of infected                    up and creation of technological tools
                      individuals’ contacts                                                 are beginning to fill the gap

                      4: Central surveillance                                               Asian countries have led the way, and existing
                      Processes and infrastructure for aggregating                          surveillance systems are being adapted
                      an analyzing data to drive decision-making around                     elsewhere but face data and lag time issues
                      suppression strategies

                      5: Social distancing                                                  Businesses and individuals are just beginning
                      Cultural and infrastructural changes to daily life                    to grasp the extent of the new normal
                      and work
1. CDC has issued guidance on these topics that should be referenced by local authorities
© Oliver Wyman                                                                                                                                   7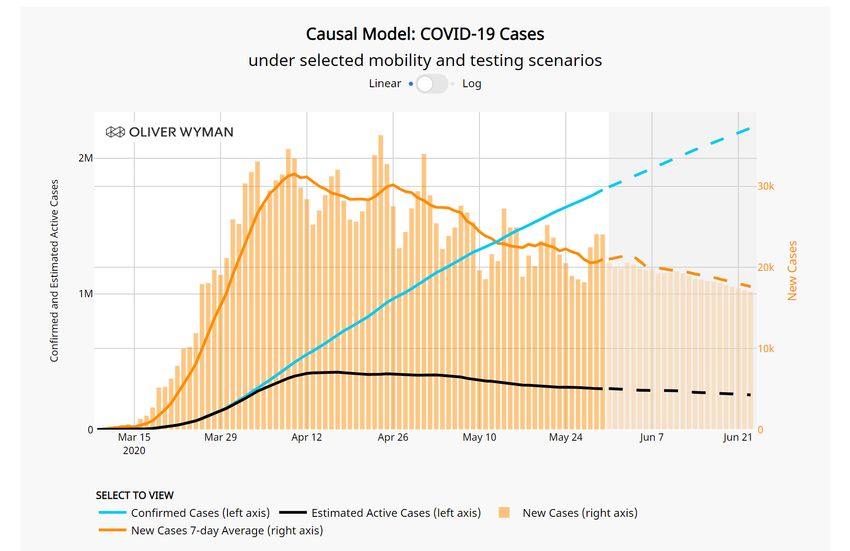
OUR FACTBASE ON KEY CAPABILITIES REQUIRED FOR REOPENING IS CONSTANTLY
EVOLVING TO INCORPORATE THE MOST UP TO DATE INFORMATION

          Health system capacity        Testing

             Contact tracing             Central surveillance

© Oliver Wyman                                                          8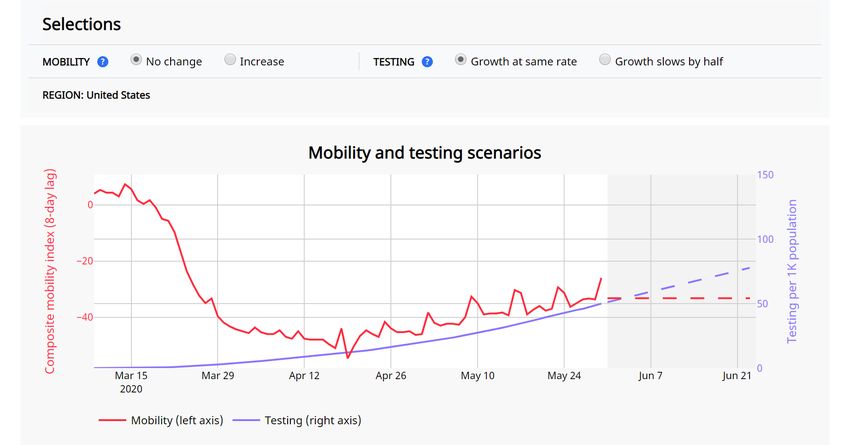
WE CANNOT AFFORD TO REMAIN SHUT DOWN, BUT IT’S NOT WITHOUT RISK TO RE-
OPEN FULLY. WE EXPECT >12 MORE MONTHS OF SOCIAL DISTANCING “CYCLES”

                                  Initial Outbreak                                   Long Haul of Suppression                                              Containment
                                       ~2 Months                                                                   12+ Months

                                                                    Cycles of relax/tighten as social distancing                                     Therapeutic breakthroughs
                                                                    remains the only “brake”                                                         (treatment, vaccine) and/or
                                                                                                                                                     scaled public health tools
                                                                    Ramp up testing to watch for resurgence of virus
                                                                                                                                                     (testing, tracing, selective
                                                                    and gauge progress to herd immunity1
                                                                                                                                                     quarantine, surveillance)
                                                                                                                                                     enable exit to New Normal
    Case growth per day

                          • Closure of non-essential      • Gradually re-open business with employee testing, social distancing                      • All businesses re-open
Mitigation/Economy

                            businesses                      in the workplace and new cleaning protocols (note: serology testing should not currently   with safety protocols
                          • Community-wide stay-at-home     be used for immunity passports)                                                          • Stay-at-home reinstated in
                            mandates                      • Remote work and mask-wearing still the norm                                                areas with new outbreaks
                          • Widespread remote work        • No large gatherings                                                                      • Prevalent use of vaccines,
                          • Border closures and travel    • Quarantine for confirmed cases, close associates, and travelers                            perhaps annually
                            restrictions                  • Stay-at-home order for elderly, ill, and/or immunosuppressed

© Oliver Wyman                                                                                                                                                                      9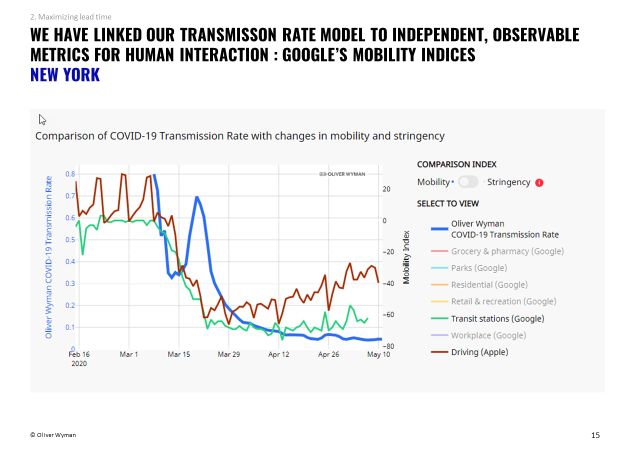
REOPENING PLANS SHOULD BALANCE MOBILITY AND ECONOMIC OPPORTUNITY FOR
YOUNGER RESIDENTS WITH PROTECTION FOR VULNERABLE POPULATIONS

While infection is prevalent in those under the age of                             Asymptomatic patients tend to be younger: there is
60, the risk for hospitalization and death is severely                             less direct risk to them, but they are more likely to
diminished in younger age groups                                                   drive unknown community spread
Case rates by age                                                                  Age distribution of patients, by symptoms
New York City, 20202                                                               Wuhan, 2020 1
       Cases per 100k                                            4,301
       Hospitalizations per 100k
                                   3,553           3,562
       Deaths per 100k                                                             60
                                                                     2,647                                                             Median
                                                                                   40
                 2,187                                                                                                                 Interquartile
                                                       1,666               1,503   20                                                  Range

                                       859
                                                           603                      0
 321                    241                  184
       30 0                   20                                                        Asymptomatic        Symptomatic

     0-17           18-44             45-64           65-74          75+

A smart re-opening strategy will allow the less at risk to return to work (safely) to drive economic recovery while carefully protecting the
more vulnerable (e.g., elderly, those with co-morbid conditions, residents and workers of long term care facilities)
• Introducing age and health status-differentiated mobility restrictions may reduce infection and fatality risk among the most vulnerable, but
  governments should have plans in place to ensure those individuals have easy access to supplies and essential items
• Dedicating stocks of tests and PPE to elder care facilities may decrease the risk of outside infection from staffers, as well as allowing for
  visitation from recently tested friends or family, improving mental health

© Oliver Wyman                                                                                                                                    10
Non-exhaustive
ILLUSTRATIVE PLAYBOOK COMPONENTS ON WORKFORCE RESILIENCE AND READINESS
Physical work space safety Functional Alternative Health
• Increased ventilation redesigns staffing models screening/testing
• Floor layout redesigns and foot • Workflow redesign to reduce hand-offs, • Formal separation of a-teams and b- • Temperature checks or assessments
traffic guidance to reduce congestion complexity, and intensity of rare skills teams to ensure backup availability at entry
and maintain 6 ft distance • Automation of critical processes and • “Flex pool” or “pool of pools” to plug • Testing (on site or protocol for referral
• Comprehensive disinfection practices at processes with higher personnel risks live gaps to local public health entity/physician)
appropriate intervals (particularly of • Infrastructure and IT configured for • Reallocation of workforce across sites • Policies related to health
high touch surfaces and restrooms) enablement of full program portfolio to mitigate undue risk in one location screening/testing (e.g. management
• Bans on 10+ person meetings • No sharing of equipment when possible • All who can work-from-home do so of medical data and privacy, payment
• New behaviors, e.g. masks/gloves at all • Cross-training of all critical skill sets for testing and time required for testing,
times in public spaces, frequent hand reporting of results, policy for use
• …
washing, toilet closure) of results in deployment of staff)
• Cafeteria/social space closure • Education of management about
• … disease and control measures
Proactive monitoring Scalable Management of Legal and labor agreements
and intervention employee support special people situations • Managing responsibilities to labor
• Elevation of centralized risk monitoring • Expanded communications, e.g. educational • Formal identification of higher risk unions with regards to lay offs, reduced
function campaign on social responsibility employees (demographics, health work hours, testing, etc.
• Real-time tracking and evaluation of all • Managing workforce concerns about status, rare skills) • Appropriate compliance with wage
key risks returning to work • Alternative work rotations and hour laws, anti-discrimination laws,
and extended WFH for populations health and safety laws, the Americans
• SWAT teams for rapid intervention • Transportation burden assistance
at higher health risk with Disabilities Act, various new (and
• Contingency plans for (e.g. to avoid subway use)
old) paid sick and family leave rules, etc.
opening/closing/relocating operations • Mental wellbeing coaching resources • Enhanced HR admin capacity for special
employee circumstances (e.g. Sick days, • Preparation for any potential
based on evolving local risk • Productivity training for remote
PTO, furlough, alternative work claims filed by employees as a result
• Alerts and compliance monitoring collaboration
arrangements) of measures undertaken during
• … • Policy & technology provision for crisis period
extended work-from-home for large • …
• …
portions of workforce
• Child care assistance
• …
© Oliver Wyman 11AS US STATES RE-OPEN, WE ARE MONITORING A BROAD ARRAY OF DATA POINTS
TO PREDICT REGIONS AT HIGHEST RISK OF ADDITIONAL DISRUPTION
1 2 3 4 5
Initial peak Reopening Public health Leading Population
experience policy infrastructure indicators dynamics
• How hard has the • How broadly and how • Is there sufficient • How are mobility • Is the region higher-
region been hit? quickly are businesses testing capacity to and social distancing risk due to age,
• Where is the region on being allowed to re- detect patients early? indicators changing? population density,
its first outbreak curve open? • Is there sufficient • How is transmission comorbid conditions,
(emerging, stabilizing, • How stringent are PPE contact tracing rate increasing? socioeconomic factors?
recovering)? and social distancing capability to identify • Using OW’s boots-on- • Is there a cultural bias
• How well have hospitals requirements? potential the-ground Global toward social
been able to manage infections early? Sensing Network, how distancing, or multi-gen
the first surge? • What increased are individuals and households?
capacity is being businesses behaving
planned? and complying?
New cases trajectory Reopening timing, policy, Testing % positive Mobility indices Age, density, % urban
Case fatality rate stringency, seq. Tests per day (Apple, Google, etc.) Chronic conditions
Cases per capita PPE/distancing mandate Contact tracing PPE compliance % essential, % WFH
Impact on hospitals, PPE, Travel restrictions Surveillance OW transmission rate Household size, x-gen
vents, workforce Anecdotal compliance Travel exposure
© Oliver Wyman 12OUR COVID-19 PANDEMIC DATABASE, ARCHETYPE FRAMEWORK AND DETAILED
STATE PROFILES PROVIDE AN UP-TO-DATE VIEW OF EVOLVING RISK
OW’s pandemic database compiles key Covid-19 information at a country, state, MSA, and county level
Database: Rapid export and visualization of 50+ State Archetypes: OW continuously updates
metrics across several market dimensions archetype view to identify areas with greatest risk
‒ Current pandemic status
‒ Reopening policy
‒ Public health infrastructure
‒ Leading indicators
‒ Population dynamics
State profiles: Detailed profiles double click
on key issues facing states and MSAs
Profiles available upon request
© Oliver Wyman 13WE HAVE A HIGHLY DEVELOPED TOOLKIT TO SUPPORT MANAGEMENT TEAMS AS THEY
NAVIGATE THE CRISIS
We have developed a sophisticated capability … to provide business leaders with the tools and support they need to chart a
which we call the Pandemic Navigator… course through the next 18 months
• Stable, highly accurate projection of active and new
Accurate case forecasts
infections for 50 states and 40+ countries.
Dynamic, granular modelling of • Daily modelling of how infection rate is trending by county
virus spread rate to enable high frequency insights and action
Predictive links to drivers like • ‘What if’ capabilities to understand how changes to
testing and mobility mobility and testing impact virus transmission
Analytics to support ‘smart’ • Ability to anticipate ‘corridors’ of increased economic
decisions activity to manage supply chain and demand impacts
Epidemiology (by county) Ability to analyse risk vs • Provides ability to proactively manage return to workplace
economic trade-offs decisions and epidemic management
Containment Measures
A global team of epidemiologists, • Our team is tracking and providing insights hourly and is at
Economic Impacts modelers, economists, and risk your disposal to ensure you are benefiting from lessons
specialists being learned globally and the latest knowledge
© Oliver Wyman 14OUR PANDEMIC NAVIGATOR ANALYTICS PROVIDE ACTIONABLE INSIGHTS TO EXECS Accurate case projections: US counties, Daily virus infection rates linked to real-time Detailed local projections to inform re- 50 states, 45+ countries human mobility indices (e.g. Google, Apple) opening and future lockdown risks Specific, detailed re-opening policies for Predictive analytics linked to testing volumes “End-to-end” scenarios to support planning high-priority locations – New York example and lockdown policy changes and forecasting applications Explore a selection of these capabilities on our website https://pandemicnavigator.oliverwyman.com/ © Oliver Wyman 15
OUR TRANSMISSON RATE MODEL IS LINKED TO INDEPENDENT, OBSERVABLE METRICS
FOR HUMAN INTERACTION: GOOGLE’S MOBILITY INDICES
 Example outputs for New York
 Similar outputs are available for all U.S. States

 Explore this view and more on our website https://pandemicnavigator.oliverwyman.com/
© Oliver Wyman                                                                          16
WE CAN ALSO ASSESS THE IMPACT OF HOW CHANGES IN MOBILITY AND TESTING
IMPACT VIRUS SPREAD

Example outputs for United States
Similar outputs are available for all U.S. States

Select how mobility and testing changes…             …and see how virus spread evolves

 Explore this view and more on our website https://pandemicnavigator.oliverwyman.com/
© Oliver Wyman                                                                           17
LEVERAGING PANDEMIC NAVIGATOR OUTPUT, WE HAVE IMPLEMENTED A RECOVERY
INFORMATION SYSTEM THAT INTEGRATES WITH CORPORATE MIS AND ENABLES
EFFECTIVE DECISION MAKING DURING THE LONG HAUL OF SUPPRESSION
OW Pandemic Navigator
OLIVER WYMAN HAS DEVELOPED A POWERFUL COMPASS TO SUPPORT CORPORATES
THROUGH THESE UNCHARTED WATERS: OW COVID 19 PANDEMIC NAVIGATOR
PRIVATE SECTOR PUBLIC SECTOR
OW COVID-19
RECOVERY
NAVIGATOR
Monitoring
Challenge to Epidemiology (by country) key metrics
macroeconomic views
TOWER
Understanding
More granular approach
the impact of decisions
Lockdown Patterns
More targeted
Decision support tools policy response
The hub
Control tower Design-led and
Industry Earnings (by sector) data-driven approach
Fiscal/Monetary Stimulus
Covid strategy Assessing
operational delivery Risk/Loss Transmission hospital capacity
models, processes, capacity initial use case
Banking/Insurance/Funds/PE
© Oliver Wyman 12
Containment John Hopkins/
measures by geo External sources
Governance and
oversight team
Covid companion • Corporate MIS Social media
• Internal programs
Mobile app Listening tool
© Oliver Wyman 18HOW AND WHEN WILL WE RECOVER COMPLETELY?
A successful vaccine manufactured and deployed at scale is the only certain path to eradication
How long could that take?
• In short, 18+ months is likely for development, trials, approval and mass production
• The best comparison we have is the development of H1N1 vaccines under similar circumstances:
H1N11
6 months until vaccine approval; 12 months critical conditions; 18 months until end of pandemic
Mar 2009 Apr 2009 Summer 2009 July 2009 Sep 2009 Dec 2009 Aug 2010
First world-wide US Gov declares Source region Vaccine clinical FDA approves four Vaccine available WHO declares end
case emerges state of emergency possibly under control trials begin H1N1 vaccines broadly of pandemic
What is the current status?
• As of 5/26, there are 113 vaccine programs, with 15 in a clinical stage
• Two broad categories of vaccine are under development:
– Traditional, protein-based:
- Inactivated vaccine or proteins from it are grown in animal cells and then injected into the human body
- Category has been proven to work and will rely on existing infrastructure, however will take longer to develop
- Efforts of note: Partnership between GSK and Sanofi, Novanax
- Potential timeline – Phase I trials to start later this year, vaccine wouldn’t be approved and available until 2021
– Modern, nucleotide-based:
- mRNA, DNA or inactivated virus is injected into the human body, so that its cells can make viral proteins
- Category has not been proven, but has a much more rapid timeline to development
- Efforts of note: Moderna, Pfizer, AstraZeneca – J&J – Oxford University partnership, Innovio
- Potential timeline – Phase II and III trials have started or planned to start by summer with limited availability of doses potentially available this fall for high risk
individuals and frontline workers
Sources: H1N1 timeline (link), Credit Suisse Equity Research, Nature (link), Artis Ventures (link), Biocentury (link) and DowJones
© Oliver Wyman 19Information as of 6/1/20
WHAT ABOUT HERD IMMUNITY – CAN THAT HELP?
Herd immunity is a long way off, even in heavily affected epicenters like NYC
Infected proportion of population, by country Infected proportion of US population, by MSA
90% 90%
80% 80%
Proportion required for herd immunity1 Proportion required for herd immunity1
70% 70%
60% 60%
50% 50%
40% 40%
30% 30%
20% 20%
10% 10%
0% 0%
NYC3
Chicago
Detroit
Boston
New Orleans
Seattle
San Francisco
Japan
Sweden
US
Spain
South Korea
Norway
Germany
China
Czechia
France
UK
Italy
Confirmed Estimated total – low2 Estimated total – high2
CN JP SK CZ NO DE FR US IT SE ES UK San Fran Seattle Chicago Detroit Boston NOLA NYC
Deaths per 1M4 3 7 5 29 43 100 440 320 550 430 580 570 Deaths per 1M4 60 200 540 1,000 990 960 1,880
Total Deaths4 5K 900 270 320 240 9K 29K 104K 33K 4K 27K 39K Total Deaths4 270 790 5K 4K 5K 5K 36K
Sources: Total confirmed cases by country as reported by Johns Hopkins University as of 5/21/2020; total confirmed cases by US county as reported by US facts as of 5/21/2020; world population as reported
by link; total population for MSAs as reported by Claritas.
1. Estimates for herd immunity for COVID based on R0 of 2–5.7 and a target of R0Last updated: 06/02/2020
LATEST GDP FORECASTS INDICATE A SEVERE SHOCK IN THE U.S. ECONOMY
The escalation of the COVID-19 crisis has lead to significant downward revisions in GDP forecasts globally
U.S. Real GDP Growth Forecasts – Q1, Q2, Q3, Q4, and annual Key observations from estimates
Annualized growth rate, by select economic analysts (9) 1,2
2020 • Forecast updates have been frequent
Q1 2020 Q2 2020 Q3 2020 Q4 2020 (annual)
30 and sizable – Consensus is that bad
Goldman
25
JP Morgan
TD B of A news on the virus continues to
CBO
20 TD outweigh good news on policy actions
15 DB
Moody’s
Goldman • Forecasted Q2 qoq annualized
Annualized growth rate (%)
10 CBO JP Morgan
5 DB
Moody’s
UBS Goldman growth rate in the US (~30–40% drop)
DB
0
UBS Moody’s will be the worst since we have
-5 GDP Q1 Actual
CBO
Moody’s B of A JP Morgan TD quarterly data available
Goldman UBS
-10 JP Morgan DB • Key indicators to track include:
-15 FRBNY Nowcast (May 1)
CBO – Trend for percent of U.S.
-20
population infected
-25 Moody’s B of A
-30 B of A
(scenarios ranging up to 80%)3
UBS
-35
FRBNY Nowcast (May 29) – Reliance on “smart” mitigation
CBO DB
-40 TD
Goldman strategies (e.g., mass testing,
JP Morgan
-45 use of analytics)
Institutional Forecasts Actual FRBNY Nowcast
Q1 2020 Q2 2020 Q3 2020 Q4 2020 2020 (annual)
Median -3.9% -38.2% 18.3% 10.2% -6.6%
Average -5.2% -36.4% 16.2% 11.5% -6.5%
Max/Min -2.3%/-9.9% -28.8%/-41.4% 29.0%/-1.0% 25.0%/5.5% -4.5%/-8.0%
Actuals -5.0%
1. Sources: Bank of America (May 15), Moody’s (May 15), UBS (May 15), Goldman Sachs (May 12), TD (May 15), JP Morgan (May 29), CBO (May 19), Deutsche Bank (May 15), FRBNY Nowcast (May 1, May 29,
Nowcast not included in table calculations), Q1 estimates based on latest forecast before release of Q1 GDP Actual
2. Quarterly estimates in terms of qoq% seasonally adjusted annual rate (saar)
3. Imperial College COVID-19 response team
© Oliver Wyman 21Last updated: 06/02/2020
THE DOWNWARD SHOCK TO GDP IS MIRRORED IN UNEMPLOYMENT
The escalation of the Covid-19 crisis has lead to significant bearish revisions unemployment forecasts globally
U.S. Unemployment Forecasts – Q1, Q2, Q3, and Q4 Key insights
Quarterly unemployment rate, by select economic analysts (5) 1
• Most annual unemployment forecasts
assume a steady economic recovery
Q1 2020 Q2 2020 Q3 2020 Q4 2020 starting in June, and do not account
25
Goldman for the possibility of subsequent
significant waves of infection
20
Goldman • 41.1 million unemployment claims
Unemployment rate (%)
Goldman
JP Morgan
filed since start of the COVID-19
Deutsche CBO CBO
15
April Actual Deutsche lockdown, wiping out the last
Peak unemployment Deutsche JP Morgan CBO
Moody’s eleven years of job gains2, 3
during financial crisis2 Moody’s JP Morgan
10 • Congressional Budget Office forecasts
a slower employment recovery than
March Actual
5 CBO Moody’s Moody’s most major banks
JP Morgan Deutsche
• The CARES Act has allocated ~$660B in
0 forgivable loans to cover small
Institutional forecasts business payroll expenses, padding
Q1 2020 Q2 2020 Q3 2020 Q4 2020 against additional job losses in the
Median 3.8% 15.5% 13.3% 11.0% short term
Average 3.8% 16.7% 13.6% 10.7%
Min/Max 3.8%/3.8% 13.7%/25.0% 9.1%/18.5% 7.1%/14.0%
Actuals2 4.4% (Mar) 14.7% (Apr)
1. Sources: 1. Sources: Bank of America (May 15), Moody’s (May 15), UBS (May 15), Goldman Sachs (May 12), TD (May 15), JP Morgan (May 29), CBO (May 19), Deutsche Bank (May 15), FRBNY Nowcast (May 1, May 29)
2. Sources: U.S. Bureau of Labour Statistics
3. Tracking unemployment forecasts against unemployment reports may be misleading – unemployment reports only record jobless workers actively searching for employment
© Oliver Wyman 22READ OUR LATEST INSIGHTS ABOUT COVID-19 AND ITS GLOBAL IMPACT ONLINE Oliver Wyman and our parent company Marsh and McLennan (MMC) have been monitoring the latest events and are putting forth our perspectives to support our clients and the industries they serve around the world. Our dedicated COVID-19 digital destination will be updated daily as the situation evolves. Visit our dedicated COVID-19 website © Oliver Wyman 23
QUALIFICATIONS, ASSUMPTIONS, AND LIMITING CONDITIONS
This report is for the exclusive use of the Oliver Wyman client named herein. This report is not intended for general circulation or publication, nor is it to be reproduced,
quoted, or distributed for any purpose without the prior written permission of Oliver Wyman. There are no third-party beneficiaries with respect to this report, and
Oliver Wyman does not accept any liability to any third party.
Information furnished by others, upon which all or portions of this report are based, is believed to be reliable but has not been independently verified, unless otherwise
expressly indicated. Public information and industry and statistical data are from sources we deem to be reliable; however, we make no representation as to the
accuracy or completeness of such information. The findings contained in this report may contain predictions based on current data and historical trends. Any such
predictions are subject to inherent risks and uncertainties. Oliver Wyman accepts no responsibility for actual results or future events.
The opinions expressed in this report are valid only for the purpose stated herein and as of the date of this report. No obligation is assumed to revise this report to
reflect changes, events, or conditions, which occur subsequent to the date hereof.
All decisions in connection with the implementation or use of advice or recommendations contained in this report are the sole responsibility of the client. This report
does not represent investment advice nor does it provide an opinion regarding the fairness of any transaction to any and all parties. In addition, this report does not
represent legal, medical, accounting, safety, or other specialized advice. For any such advice, Oliver Wyman recommends seeking and obtaining advice from a qualified
professional.
You can also read