Restoration of the Lake St Lucia estuarine system - SedNet
←
→
Page content transcription
If your browser does not render page correctly, please read the page content below
11th International SedNet Conference 3-5 April 2019, Dubrovnik, Croatia
                             3-5 April 2019

Restoration of the Lake St Lucia estuarine system

 Analysis of alternatives to determine the most feasible solution to the
 hydrological/hydrodynamic issues of the estuarine Lake St Lucia system

                   and Implementation of the solution

                                            Prof Gerrit Basson, Dept. Civil
                                            Engineering, Stellenbosch University,
                                            South Africa, grbasson@sun.ac.za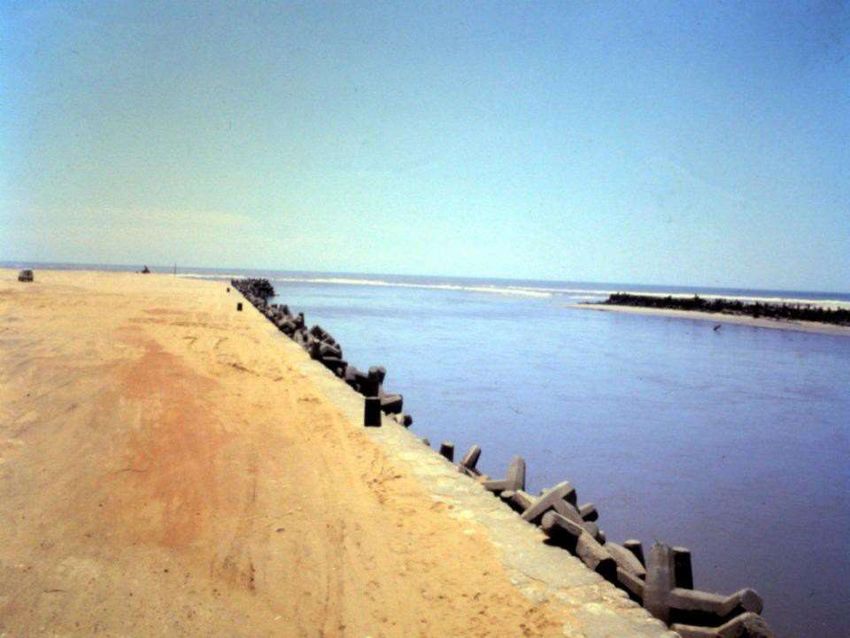
iSimangaliso Wetland Park
World Heritage Site
Contents Background Hydrodynamic modelling 1D and 2D of sediment dynamics Proposed mitigation measures
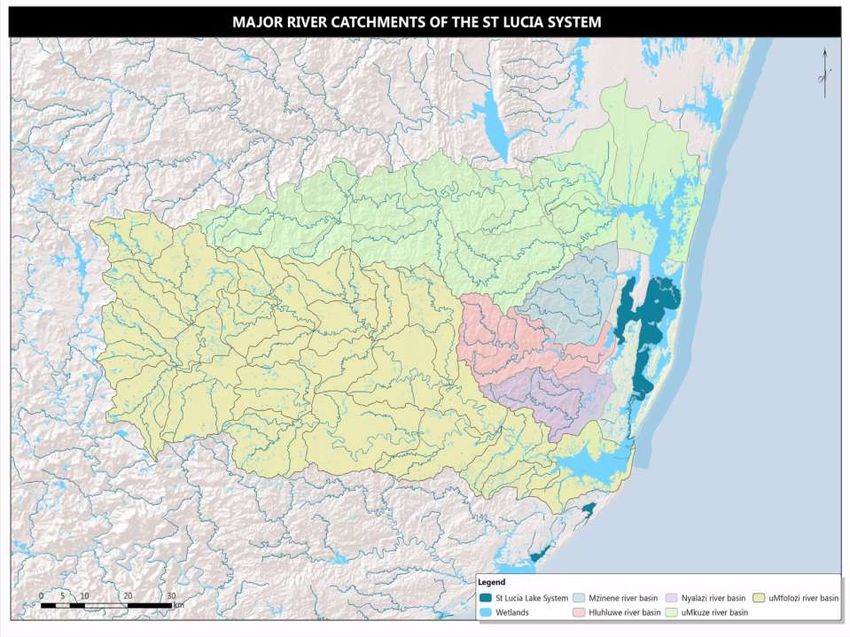
uMkuze

                    Mzinene

             Hluhluwe
uMfolozi            Nyalazi
iSimangaliso Wetland Park

80s & 90s threatened by mining
    – heavy minerals
    – titanium, illemnite, rutile
      and zircon

Mining rejected by government in
1996

4th December 1999 - first South
African protected area to be
proclaimed a World Heritage Site

    •   Ecological processes
    •   Superlative natural beauty
    •   Exceptional biodiversity

iSimangaliso Authority set up to
manage the Park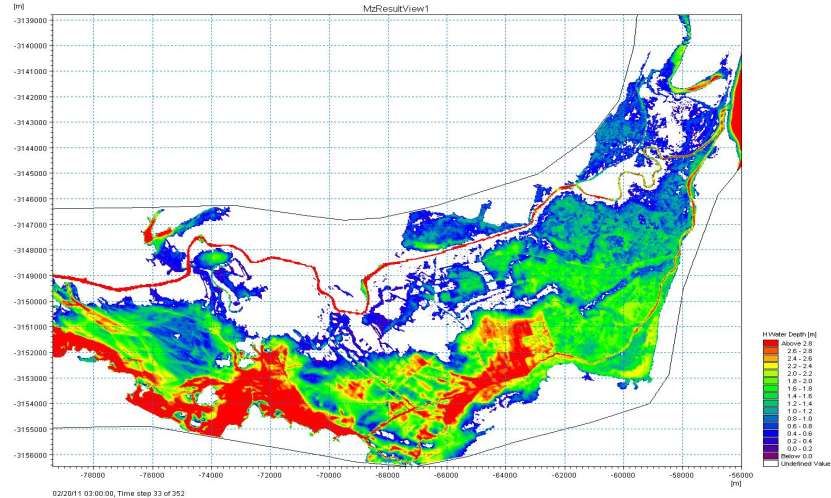
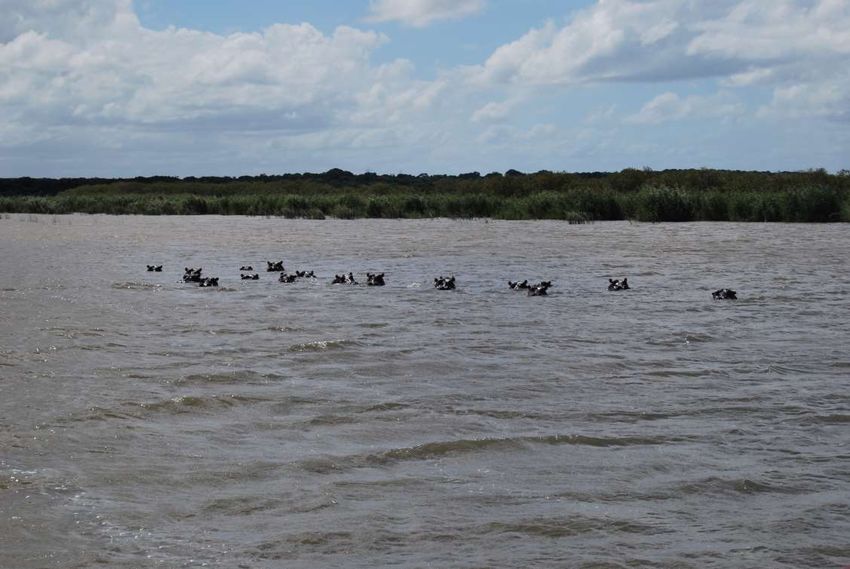
iSimangaliso Wetland Park Restoration Project Removal of 12 000 ha of invasive plants and pine and Eucalyptus plantations on the eastern and western shores of the St Lucia system
iSimangaliso Wetland Park Restoration to date Removal of 12 000 ha of alien plants, pine and Eucalyptus plantations on the eastern and western shores of the St Lucia system A game reintroduction program - black rhino, elephant, buffalo, waterbuck, kudu, nyala and others
iSimangaliso Wetland Park
Restoration to date
Removal of 12 000 ha of alien plants
and pine and Eucalyptus plantations
on the eastern and western shores of
the St Lucia system
A game reintroduction program -
black rhino, elephant, buffalo,
waterbuck, kudu, nyala and other
antelopes.
Upgrade of infrastructure
Restoration of wetlands
iSimangaliso Wetland Park
Restoration to date
Removal of 12 000 ha of alien plants
and pine and Eucalyptus plantations
on the eastern and western shores of
the St Lucia system
A game reintroduction program -
black rhino, buffalo, elephant,
waterbuck, kudu, nyala and other
antelopes.
Upgrade of infrastructure
Restoration of wetlands
Restoration of estuarine function to
the Lake St Lucia system – GEF funding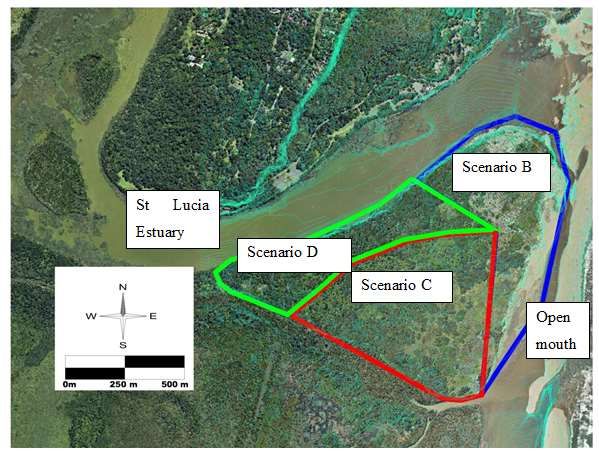
Restoration of the Lake St Lucia System

 Why the focus on hydrological functioning and
 specific concern over the estuary ?

 •   80% of estuarine area of subtropical region of South Africa
 •   60% of estuarine area of the South Africa
 •   90% of the protected estuarine area of the country

 •   Prolonged mouth closure (2002-2012)
 •   High salinities – reached 300 000 mg/l
 •   Water surface – 10% of the 325 km2
 •   Collapse of line fish stocks and offshore shrimp fisheries
 •   Ramsar site - significant habitat – bird nesting and feeding
Restoration of the Lake St Lucia System

 Why the focus on hydrological functioning and
 specific concern over the estuary ?

 •   80% of estuarine area of subtropical region
 •   60% of estuarine area of the country
 •   90% of the protected estuarine area of the country

 •   Prolonged mouth closure (2002-2012)
 •   High salinities – reached 300
 •   Water surface – 10% of the 325 km2
 •   Collapse of line fish stocks and offshore shrimp fisheries
 •   Ramsar site - significant habitat – bird nesting and feeding
Context
Very clear from the preliminary scoping studies
and other scientific work that to address the
issues and improve the health of the St Lucia
system required a focus on the significance and
role of the uMfolozi River as part of the larger
estuary
Alteration of floodplain: 1911
1952 the combined St Lucia and
Mfolozi mouth separated
1952
Dredging of mouth and Narrows +40 years
Mouth kept open to the sea – ‘improved estuarine
functioning’
iSimangaliso Authority
Management Strategy:

 •   Allow the uMfolozi to move northwards and rejoin with
     the St Lucia system

 •   And allow a more natural mouth dynamic to re-establish

 • Required removal of the dredge spoil island (2,600,000 m3)
Field work for modelling parameters
(2013)
Tidal levels
Flow velocities
Bed Sediment samples
% Silt and clayModel layout for hydrodynamics, TDS
and TSS (Mike11-1D)
Single mouth Two mouthsModel long section at low water level
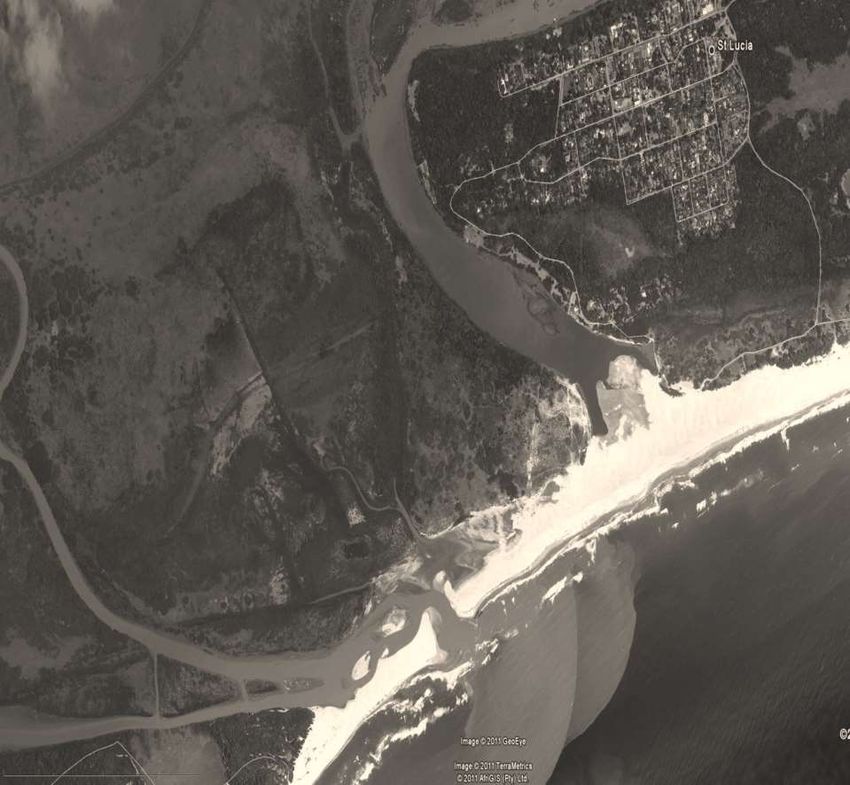
Water coverage of Lake St Lucia in December
2003 reduced to 25% of surface area (Cyrus et
al., 2011; Original figure compiled by Ezemvelo
KZN Wildlife).1D Model Mouth Simulation rules
1. Two mouths:
a) Mfolozi River mouth opens when its river estuary water level > 2.435 m MSL
b) Lake mouth opens when lake estuary water level > 2.435 m MSL
c) River mouth closes when Q river < 1.5 m3/s
d) Estuary mouth closes when lake level at Charters Creek < 0.15 m MSL.
2. One mouth:
a) Opens when upstream estuary water level > 2.435 m MSL
b) Closes when Q river < 1.5 m3/s and water level in lake at Charters Creek
(southern lake) < 0.15 m MSL.
Also sensitivity tests on higher berms: 3.0 m and 3.5 m MSLCalibration against historical data –
Lister’s Point and Charters Creek water levels
Lister’s Point
Charters CreekLake mass balance with observed mouth conditions for the
period 1962 to 2010
Historical
LAKE Rain-Evap
-29%
Narrows in lake 6_Nyalazi
-21% 7%
4_Msinene
2%
5_Nzimane
3_Mkuze 5%
7_Easternshore 24%
s
11%
Eastern Narrows LAKE
Scenario uMfolozi uMsunduzi Nyalazi Mzinene Nzimane uMkhuze shores into Lake Rain-Evap
Million Million m3/a Million Million Million Million Million Million Million
m3/a m3/a m3/a m3/a m3/a m3/a m3/a m3/a
Historical 150.7 657.9 42.2 11.0 26.6 136.1 64.3 -117.7 -166.1Simulated minimum and mean Lake water
levels for 1962 to 2010 (m MSL)
One Mouth – A (link channel; One Mouth – B (partial dredging
Two Mouth – A dredged spoil not removed) dredge spoil dump)
Water Lister’s Northern Charters Lister’s Northern Charters Lister’s Northern Charters
Scenario level Point Lake Creek Point Lake Creek Point Lake Creek
Minimum - - - -0.582 -0.567 -0.351 -0.440 -0.440 -0.167
“Natural”*
Mean - - - 0.760 0.760 0.774 0.759 0.759 0.767
Historical Minimum -1.017 -0.668 -0.923 - - - - - -
(calibrated) Mean 0.339 0.349 0.410 - - - - - -
Minimum -1.182 -0.668 -1.322 -1.050 -0.654 -0.454 -0.721 -0.650 -0.087
Current
Mean 0.242 0.276 0.282 0.490 0.495 0.544 0.508 0.508 0.546
Minimum -1.194 -0.668 -1.330 -1.069 -0.660 -0.485 -0.775 -0.651 -0.185
Scenario 1
Mean 0.160 0.208 0.214 0.372 0.381 0.444 0.422 0.423 0.474
Single mouth significantly improves drought conditions, decreases peak TDS, but
could increase sedimentation caused by inflows from the southern rivers
Low Lake levels lead to hyper salinities of 200 000 mg/l observedMean annual sediment loads entering Lake St Lucia
and the uMfolozi river for different scenarios
4
3.5
From south From north
3
Mean sediment load (Mt/a)
2.5
Mfolozi
2 Msunduzi
Mkuze
1.5 Mzinene
Nsimane
1
Nyalasi
0.5
0
“Natural “ Current Scenario 1 Scenario 2 Scenario 3 Scenario 4
scenario scenario
ScenarioSimulated average suspended sediment concentrations on
the Msunduze and uMfolozi Rivers, at Honeymoon Bend and
at the Narrows (Scenario A)
uMfolozi and
uMsunduzi Rivers Honeymoon Bend
combined average TSS average TSS Narrows average TSS
Scenario concentration (mg/l) concentration (mg/l) concentration (mg/l)
1 mouth/2 mouths 1 mouth 2 mouths 1 mouth 2 mouths
“Natural” 28 17 - 9 -
Historical 40 - 12 - 4
Current 112 68 44 37 28
Single mouth increases the sediment transport, but concentrations
relatively lowFlood flow patterns by 2D
hydrodynamic model (Mike21C)
Recurrence interval (years) Sea level (m MSL)
100 1.71
50 1.59
20 1.41
10 1.28
5 1.23
2 1.15
River Q100 Q50 Q20 Q10 Q5 Q2
uMfolozi 7 487 5 638 3719 2 619 1 704 731
Nzimane 3 408 2 680 1 977 1 309 811 324
Nyalazi 3 334 2 196 1 790 1 037 652 250
Mzinene 2 334 1 528 1 351 829 571 247
uMkhuze 5 344 4 278 3 191 2 181 1 421 625
uMsunduzi 2 364 1 743 1 311 796 540 213
2D Model bathymetry shown to elevation 5 m MSLSimulated flow depth during the 100 year flood near the peak
of the flood on the Mfolozi and Msunduzi Rivers
Mouths
uMfolozi
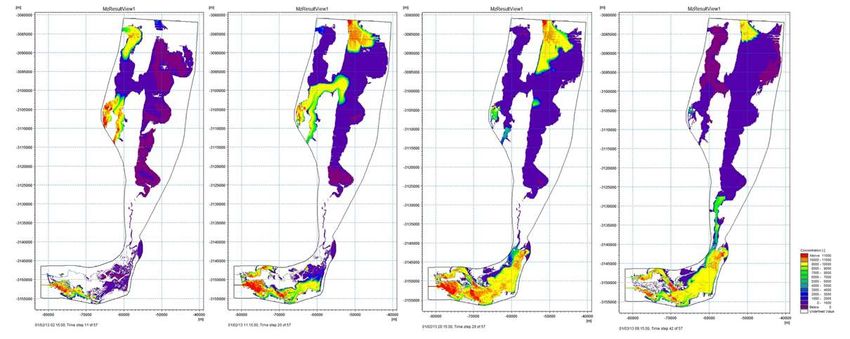
RiverSimulated sediment concentrations uMfolozi and uMsunduzi Rivers 5 year flood 100 year flood
Simulated 100 year flood sediment
concentrations showing deepest penetration
             into Lake St Lucia

                                Flushing of Narrows
                                after flood as Lake
                                level drops
Mitigation measure: partial or complete removal of
the dredge spoil dump at the mouth
The maximum elevation of the spoil is 12.5 m
MSL. The total volume of the dredged spoil
dump is about 2.6 million m3.
Peak of 100 year flood flow depth and
velocity vectors (before removal of
dredged spoil dump)Dredge spoil removal scenarios (blue: Scenario B; blue and
red: Scenario C; green, blue and red: Scenario D shown with
the 2013 survey contours and the 2013 aerial photograph
2013 1937
Proposed order of removal: B, C and D. B is most important; C
& D helps scour of channel near beach bermConclusions and Recommendations
Study of 2013-2015 proposed: Single mouth operation:
without artificial breaching of the beach berm,
remove floodplain levees,
with at least partial removal of the north eastern side of
the dredged spoil dump (implemented during 2017/18)
Sedimentation of the Lake expected to be limited
With higher water levels in the lake and normal salinities
2013 2019Questions?
You can also read