Rethinking Municipal Finance for the New Economy - BY SUNIL JOHAL, KIRAN ALWANI, JORDANN THIRGOOD & PETER SPIRO - Peel ...

Page created by Elizabeth Reeves
 
CONTINUE READING
Rethinking Municipal Finance for the New Economy - BY SUNIL JOHAL, KIRAN ALWANI, JORDANN THIRGOOD & PETER SPIRO - Peel ...
MOWAT RESEARCH #187 | MARCH 2019

Rethinking
Municipal
Finance for the
New Economy
BY SUNIL JOHAL, KIRAN ALWANI,
JORDANN THIRGOOD & PETER SPIRO
Rethinking Municipal Finance for the New Economy - BY SUNIL JOHAL, KIRAN ALWANI, JORDANN THIRGOOD & PETER SPIRO - Peel ...
Acknowledgements
The authors would like to thank those who participated in this research project as interviewees for generously sharing their time,
expertise and perspectives. Special thanks to Enid Slack and Reuven Shlozberg for their critical review and contributions, and
Elaine Stam for her design work on this report. All content and any remaining errors are the sole responsibility of the authors.
The Mowat Centre would like to thank the Region of Peel for commissioning and providing financial support for this report, as well
as the regional staff for their helpful contributions. The content, conclusions and recommendations expressed in the report are the
authors’ alone and do not necessarily reflect those of the Region.

Authors
SUNIL JOHAL                                                          JORDANN THIRGOOD
Policy Director                                                      Policy Associate
Sunil is frequently invited to speak about the future of work,       After joining Mowat in 2015, Jordann contributed to a variety
technology and social policy at conferences in Canada and            of projects on fiscal federalism, the sharing economy, and
abroad. He has contributed expert commentary and advice              the impact of technological innovation on Canada’s labour
on regulatory and policy issues to a range of organizations          market and social programs. Prior to this, she spent two
and media outlets, including the G-20, World Economic                years working in the financial sector and ran a pro bono
Forum, Brookings Institution, The Globe and Mail, The                policy consulting firm for non-profit organizations in the GTA.
Toronto Star, CBC Radio and Television, CTV News, The                Jordann holds a Master of Public Policy degree from the
Guardian, Maclean’s, The Ottawa Citizen, Policy Options, TVO         University of Toronto, and an Honours degree in International
and the OECD. He holds degrees from the London School of             Development Studies from the University of Guelph.
Economics, Osgoode Hall Law School and the University of
Western Ontario.

KIRAN ALWANI                                                         PETER SPIRO
Policy Associate                                                     Policy Consultant
Kiran joined the Mowat Centre in October 2017, and has               Peter Spiro is a policy consultant with many years of
since contributed to a variety of social and economic policy         experience in quantitative modelling. Prior to joining the
projects. Previously, she has worked in a range of research          Mowat Centre, he had worked in the government, utility and
and policy analysis roles, including with the Asia Pacific           financial services sectors, and taught in the economics
Foundation of Canada, the Canada-ASEAN Business Council,             department at the University of Toronto. He is the author
and the Conference Board of Canada. Prior to her Master’s,           of numerous publications in peer reviewed professional
Kiran worked in communications, public engagement, and               journals, including the Canadian Tax Journal.
development at the Institute for Canadian Citizenship. She
holds a Master of Public Policy and Global Affairs degree
from the University of British Columbia.

                                                                                        MOWATCENTRE.CA
                                                                                            @MOWATCENTRE
                                                                                        439 UNIVERSITY AVENUE
The Mowat Centre is an independent public policy think tank
                                                                                        SUITE 2200, TORONTO, ON
located at the Munk School of Global Affairs and Public Policy at the                   M5G 1Y8 CANADA
University of Toronto. The Mowat Centre is Ontario’s
non-partisan, evidence-based voice on public policy.
It undertakes collaborative applied policy research, proposes
innovative research-driven recommendations, and engages in public
dialogue on Canada’s most important national issues.                                   ©2019 ISBN 978-1-77259-082-1
Rethinking Municipal Finance for the New Economy - BY SUNIL JOHAL, KIRAN ALWANI, JORDANN THIRGOOD & PETER SPIRO - Peel ...
Contents
Executive Summary                                   1

1   Introduction                                    3

2 Setting the Stage
    Peel Region – Facts and Figures
    Overview of Peel’s Fiscal Health
                                                   6
                                                    6
                                                    9
    Context of Municipal Governance and Taxation   12
    Shift in Responsibilities and Revenues         13
    Primary Municipal Revenue Sources              17

3 Trends and Drivers of the New Economy            24

4 Implications for Fiscal Health                   36

5 Plausible Scenarios
    Scenario 1: Status Quo or Business-As-Usual
    Scenario 2: Worst Case
                                                   48
                                                   50
                                                   52
    Scenario 3: Best Case                          55

6   Policy Options
    Working at the Margins
    New Revenue Tools
                                                   59
                                                   59
                                                   63
    Innovative Approaches to Service Delivery      71
    Planning and Economic Development              73
    Economic Benefits from the Airport             76

7   Recommendations
    Short Term
    Medium and Longer Term
                                                   80
                                                   82
                                                   83

8 Conclusion                                       85
Rethinking Municipal Finance for the New Economy - BY SUNIL JOHAL, KIRAN ALWANI, JORDANN THIRGOOD & PETER SPIRO - Peel ...
Municipalities
                                                   continue to receive
                                                   the smallest share
                                                   of the economic
                                                   pie – for every
                                                   household tax
RETHINKING MUNICIPAL FINANCE FOR THE NEW ECONOMY

                                                   dollar paid in
                                                   Ontario, they collect
                                                   only 9 cents.
Rethinking Municipal Finance for the New Economy - BY SUNIL JOHAL, KIRAN ALWANI, JORDANN THIRGOOD & PETER SPIRO - Peel ...
EXECUTIVE
SUMMARY
Governments across the world are grappling with a changing employment landscape where artificial
intelligence and automation threaten jobs across sectors, digitization facilitates outsourcing and shrinks
the tax base, traditional office spaces and stores become obsolete, societal inequality grows at alarming
levels, and workers increasingly engage in precarious ‘gig economy’ jobs.

While these trends are putting pressure on government revenues globally, municipalities in Canada face
an additional set of challenges as they operate in a unique context. Constitutionally, municipalities in
Canada are “creatures of the province.” In other words, provinces have exclusive authority over them. In
Ontario, municipalities are governed by the Municipal Act, which enumerates every power that they have.
Adapting to emerging realities is a challenge, as every power not explicitly granted through legislation,
including the ability to levy new taxes, requires provincial approval.

Revenue sources for Canadian municipalities are limited. Apart from provincial and federal transfers,
primary sources of revenue include residential and non-residential property taxes, development charges
and user fees. Over the years, municipal expenditure responsibilities have also increased, while revenue
growth has not kept pace. Municipalities continue to receive the smallest share of the economic pie – for
every household tax dollar paid in Ontario, they collect only 9 cents.

Like the rest of Ontario and Canada, Peel Region’s economy is in transition – there has been a shift
from goods production to goods movement, and many manufacturing plants have been replaced by
warehouses and distribution centres. E-commerce has reduced demand for retail spaces. The service
sector continues to expand, with a particular emphasis on knowledge-based jobs. Workplaces are
shrinking, and the average square footage per employee has declined significantly. At the same time,
mobile work options such as telecommuting and hot-desking are becoming increasingly popular.

These trends are likely to further strain municipal revenues, as municipal revenue tools are inordinately
reliant on land-based approaches to value that are becoming less relevant in the digital era. In Peel,
the share of revenue from industrial property is on a downward trend, in large part due to the decline
of the manufacturing sector. Growth in employment land consumption has also slowed. Furthermore,
                                                                                                               1 | THE MOWAT CENTRE

provincial growth forecasts have not been reflective of the actual pace of development, which has led to a
shortfall in expected development charge revenue. Reliance on the residential property-tax base has been
increasing, as non-residential property-tax revenue as a proportion of total tax-revenues declines. If these
trends continue, property taxes will become increasingly unaffordable for residents in the years ahead.
Rethinking Municipal Finance for the New Economy - BY SUNIL JOHAL, KIRAN ALWANI, JORDANN THIRGOOD & PETER SPIRO - Peel ...
Amidst the ongoing digital revolution and              »» Then look to new revenue tools specific to
                                                       changing employment landscape, how can                  particular uses and users.
                                                       municipalities adapt? This study suggests that
                                                                                                              »» Finally, explore general purpose revenue tools
                                                       municipalities must modernize their approaches
                                                                                                               (e.g., sales tax, share of income taxes).
                                                       to revenue generation and governance to meet
                                                       spending obligations. Less reliance on land-based      Municipalities should also look to review
                                                       tax bases is not only important to reflect the         their service-delivery frameworks and wring
                                                       new world of work, but also because changing           further efficiencies from existing expenditures.
                                                       demographics (such as an aging population,             Furthermore, they should explore ways to realize
                                                       increasing demand for social services, and             benefits from the digital economy as well as
                                                       challenges posed by climate change) will               utilize strategic foresight techniques to ensure
                                                       require municipalities to shoulder even more           that policies are robust and forward-looking.
                                                       responsibilities going forward.                        Finally, municipalities must recognize the value of
                                                                                                              collaboration with neighbouring municipalities to
                                                       The fiscal challenges facing the Region of Peel
                                                                                                              develop economic development approaches that
                                                       and other municipalities won’t be addressed
                                                                                                              promote shared prosperity. Taken together, these
                                                       through any single measure. Given the host of
                                                                                                              approaches will help place municipalities on surer
                                                       service pressures and tax base issues posed by
                                                                                                              footing in the years ahead.
                                                       demographic, technological and employment
                                                       shifts, municipalities must consider a range of
                                                       approaches and tactics to solidify their footing. To
                                                       deal with the ongoing and emerging changes, the
                                                       following hierarchy of approaches should guide
                                                       Peel’s thinking on the revenue side of the ledger:

                                                       »» Advocate for and explore a realignment of
                                                        existing revenues, with both the federal and
                                                        provincial governments and engage in a
                                                        meaningful dialogue with the public around how
                                                        Canada’s taxes and responsibilities are allocated
2 | RETHINKING MUNICIPAL FINANCE FOR THE NEW ECONOMY

                                                        amongst levels of government.

                                                       »» Explore opportunities to raise more revenues
                                                        from existing tools, including a comprehensive
                                                        definitional review of various property types
                                                        to ensure that misclassification isn’t leading
                                                        to tax leakage, as well as explore progressive
                                                        property taxes or hiking property taxes at rates
                                                        higher than historical patterns. This should also
                                                        include a review of planning and forecasting
                                                        assumptions to ensure that revenue projections
                                                        are realistic and reflect exogenous trends.
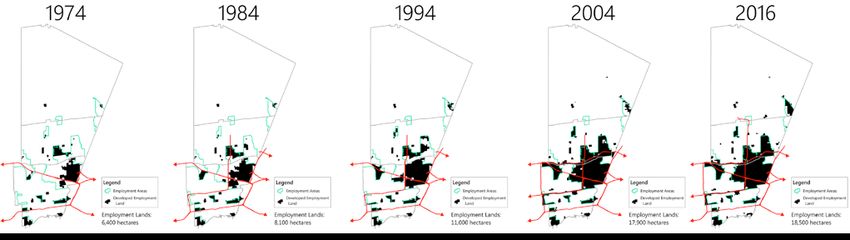
Rethinking Municipal Finance for the New Economy - BY SUNIL JOHAL, KIRAN ALWANI, JORDANN THIRGOOD & PETER SPIRO - Peel ...
1         INTRODUCTION
Canada’s economy and labour market are experiencing transformative shifts. Like many advanced
economies around the world, the population is aging while overall economic and labour market growth
is anticipated to slow down. Income inequality is at high levels and wages for many workers continue to
stagnate amidst rising costs of living. The nature of employment itself is also fundamentally changing,
as fewer people are engaged in full-time, permanent employment and many are increasingly working in
part-time, temporary or “gig” jobs. The sectors in which people work are also changing: industrial sectors
continue to shrink, while service sectors grow and the knowledge economy gains greater momentum.

It is anticipated that technological change will        ability to generate revenues and meet spending
further accelerate these ongoing trends and pose        obligations to provide core public services.
new challenges. In recent years, digitization has       Insufficient job growth and the shrinking physical
helped facilitate a more global marketplace for         space required for employment may erode the
goods and services. While this provides more            non-residential property-tax base and create a
choices for consumers, it also means that firms         shortfall in anticipated development-charges
are more mobile and better able to jurisdiction-        revenue. Growing service demands as a result of
shop for favourable taxation and regulatory             deteriorating job quality and an aging population
frameworks. Technology has also enabled more            may squeeze governments’ ability to manage
mobile labour, providing flexibility for workers,       expenditures. Greater urbanization may begin
but also increased digital outsourcing by firms         to upend regional planning priorities and the
to lower-cost jurisdictions. Workspaces are             expectations of local residents.
transforming as well, with decreased need for
                                                        Our federal structure and intergovernmental
traditional office spaces and an increased trend
                                                        relationships mean that local and regional
towards teleworking. Furthermore, automation and
                                                        municipalities in Canada face a unique set
adoption of artificial intelligence in the workplace
                                                        of opportunities and challenges. In Ontario,
threatens to disrupt multiple industries, potentially
                                                        municipal governments are heavily reliant on
leading to widespread job displacement and
                                                        three fiscal tools – property taxes, development
entirely new skills demands for the new economy.
                                                        charges and user fees – in addition to federal and
                                                                                                               3 | THE MOWAT CENTRE

This changing nature of work has real impacts on        provincial transfers. Yet, despite limited resources
the fiscal health of all levels of government. For      and taxation authority, local governments are
municipal governments reliant on property taxes,        increasingly at the forefront of tackling a number
changes in patterns of commercial and industrial        of complex policy and service-delivery issues.
land consumption have placed pressures on their
Municipalities are, to a far greater extent than
                                                       provinces and the federal government, equipped
                                                       with an outdated set of revenue tools inordinately
                                                       reliant on land that do not adequately capture the
                                                       economic value generated in today’s economy, and
                                                       that will become further antiquated as the digital
                                                       revolution continues to reshape work patterns.
                                                       As the economy and labour market evolve, how
                                                       can municipal governments modernize their
                                                       approaches to revenue generation and governance
                                                       to reflect the new world of work?

                                                       This study begins with an overview of the context
                                                       of municipal governance and taxation in Ontario,
                                                       the primary revenue sources available to municipal
                                                       governments, as well as the key characteristics
                                                       of the Regional Municipality of Peel. A number
                                                       of key macro-level economic and social trends
                                                       and drivers are explored, with consideration of
                                                       how these trends are reflected in Peel and other
                                                       municipalities. In addition, the implications of
                                                       these trends and resulting potential threats to
                                                       the revenue base are analyzed using a scenario-
                                                       testing exercise. Finally, a comprehensive set
                                                       of policy options in response to these trends is
                                                       presented and implementation challenges and key
                                                       success factors to overcome them are discussed
                                                       along with top-line short and medium-term
                                                       recommendations.
4 | RETHINKING MUNICIPAL FINANCE FOR THE NEW ECONOMY

                                                       This report is the result of extensive research,
                                                       stakeholder consultation and economic modelling.
                                                       This includes a literature review and jurisdictional
                                                       scan, as well as key informant interviews with
                                                       29 internal and external stakeholders from the
                                                       public and private sectors and academia. An
                                                       econometric forecasting model for Peel was also
                                                       developed to better understand the impacts of
                                                       the changing nature of work on the fiscal health
                                                       of the Region. While this report aims to inform
                                                       the strategic planning of the Region of Peel, the
                                                       findings are relevant to many municipalities across
                                                       Ontario and Canada which face similar challenges.
Municipal
  revenue tools
are inordinately
       reliant on
     land-based
 approaches to
  value that are
becoming less
 relevant in the
      digital era.
                     5 | THE MOWAT CENTRE
2                SETTING
                                                                        THE STAGE
                                                       Peel Region – Facts and Figures
                                                       Governance and Finance
                                                       The Regional Municipality of Peel is an upper-tier (regional) municipal government, with the lower-tier
                                                       (local) governments comprising the City of Mississauga, City of Brampton and Town of Caledon. The
                                                       responsibilities of the upper and lower tiers are described in Figure 1.

                                                        FIGURE 1
                                                       Responsibilities
6 | RETHINKING MUNICIPAL FINANCE FOR THE NEW ECONOMY

                                                       Source: Region of Peel
FIGURE 2
Region of Peel budget overview

Source: Region of Peel “2018 Budget Document.” https://www.peelregion.ca/budget/2018/2018-
budget.pdf.

According to the Region’s 2018 budget, the operating expenditures of
the Region are $2.4 billion and capital expenditures are $0.7 billion.
Property-tax revenue makes up around 44 per cent ($1.04 billion) of
the 2018 operating expenditure budget. Development-charges revenue
covers 33 per cent ($239 million) of the 2018 capital budget and 40 per
cent of the $2.7 billion ten-year capital plan.1

                                                                                             7 | THE MOWAT CENTRE

1 Region of Peel “2018 Budget Document.” https://www.peelregion.ca/budget/2018/2018-
budget.pdf.
Demography                                                            Economy and Labour Market
                                                       The Region of Peel has a total population of                          While manufacturing across Ontario and in Peel
                                                       1,481,400 spread across Mississauga (754,200),                        has been on the decline, Peel has consistently
                                                       Brampton (654,100) and Caledon (73,100),                              relied more on manufacturing employment than
                                                       occupying a total of 430,180 private dwellings. The                   Ontario as a whole.
                                                       Region saw an estimated 18,700 new residents
                                                       added between Q3 2017 and Q3 2018, and it is                                                      FIGURE 3
                                                       projected that the population will reach about 2
                                                                                                                             Peel relies more on manufacturing
                                                       million by 2041.2
                                                                                                                             employment than Ontario as a whole
                                                       For many years, population growth in Peel was
                                                       about 1.5 to 2 percentage points per year higher                                                                   25

                                                                                                                           Manufacturing as % share of total employment
                                                       than the provincial average. According to the
                                                                                                                                                                          20
                                                       2016 census, this growth has slowed sharply in
                                                       the latest five-year period, when Peel’s growth                                                                    15

                                                       averaged only 0.2 percentage points higher than                                                                    10

                                                       the provincial average.3                                                                                                         Peel
                                                                                                                                                                          5
                                                                                                                                                                                        Ontario
                                                       The Region’s population is considerably younger                                                                    0
                                                                                                                                                                               2001   2003     2005   2007   2009   2011   2013   2015   2017
                                                       than the province overall, with the median age at
                                                       38.1, compared to 41.3 years for the province.4                       Source: Created by Mowat based on Region of Peel data and
                                                       However, the population of seniors (65+) is                           Statistics Canada Table 14-10-0202-01.

                                                       expected to more than double, and increase by
                                                                                                                             A total of 172,999 businesses were established in
                                                       134 per cent by 2041.5
                                                                                                                             June 2018.7 The largest employers in Peel include
                                                       Peel has a large immigrant community: 706,835                         the Royal Bank of Canada, Suncor Energy, Rogers
                                                       people (51.5 per cent of population); 94,105 of                       Communications and Hewlett-Packard.8
                                                       which are recent immigrants (13.3 per cent of
                                                                                                                             Peel Region’s employment as a share of Ontario’s
                                                       population).6
                                                                                                                             total has held steady (around 12 per cent).9 In
                                                                                                                             2017, the Region had a labour force of 873,000
8 | RETHINKING MUNICIPAL FINANCE FOR THE NEW ECONOMY

                                                                                                                             people and an unemployment rate of 6.9 per
                                                                                                                             cent.10

                                                       2 Data from Peel Data Centre.                                         7 Data from the Region of Peel.
                                                       3 Mowat calculation based on Statistics Canada census data.           8 Region of Peel (2018) “Investor Presentation (Spring 2018).”
                                                       4 Peel Data Centre “General Facts (2016 Census).” https://www.        pp. 12. http://www.peelregion.ca/finance/_media/investor-
                                                       peelregion.ca/planning/pdc/data/quickfacts.htm.                       presentation-2018-spring.pdf.
                                                       5 Region of Peel (2017) “Peel’s Economic Overview Presentation.”      9 Mowat calculation based on Region of Peel data.
                                                       https://www.peelregion.ca/budget/2018/Peel-Economic-Overview.pdf.     10 Region of Peel (2018) “Investor Presentation (Spring 2018).” pp.
                                                       6 Peel Data Centre “General Facts (2016 Census).” https://www.        7. http://www.peelregion.ca/finance/_media/investor-presentation-
                                                       peelregion.ca/planning/pdc/data/quickfacts.htm.                       2018-spring.pdf.
Non-standard work11 led Peel’s employment                           »» Financial Vulnerability:
growth from 2007-2017, with above-average                             This indicates the level to which the Region
growth in self-employment, temporary and part-                        is dependent on external sources of funding
time positions, and below-average growth in full-                     that it cannot control, such as the changing
time and permanent positions. Growth in part-time                     nature of employment and its impact on the
employment was 48.3 per cent (compared to 17.1                        non-residential property-tax base, as well as
per cent for full-time) and temporary employment                      dependence on federal and provincial transfers
was 33.5 per cent (compared to 19.8 per cent                          which aren’t within the Region’s control. Such
for permanent employment). Growth in self-                            vulnerability can affect the Region’s ability
employment was 46.7 per cent.12                                       to fulfill its commitments and maintain an
                                                                      adequate level of services.15
Median private household after-tax income
is $75,667, although much higher in Caledon                         »» Financial Flexibility:
($96,009) than Brampton ($77,156) and                                 This shows the Region’s “ability to change
Mississauga ($72,657). Prevalence of low-income                       either debt levels or taxes to meet financial
(based on LIM-AT) is around 12.8 per cent of                          obligations.”16
the population, and similarly much higher in
                                                                    Based on these pillars, the Region developed nine
Mississauga (14.7 per cent) and Brampton (11.3
                                                                    financial principles. These include: respect the
per cent) than in Caledon (5.7 per cent).13
                                                                    tax and utility ratepayer, ensure the capital plan
                                                                    is sustainable, maintain assets, deliver value for
Overview of Peel’s                                                  money, users pay where appropriate, work with

Fiscal Health                                                       area municipalities to support the economic
                                                                    viability of the community, make prudent
Peel’s Pillars of Sustainability                                    investments, mitigate significant fluctuations
                                                                    in tax and utility rates, and borrow only for
The Region of Peel’s 2013 Long Term Financial
                                                                    substantial long-term assets at affordable levels.17
Planning Strategy outlines three pillars of
                                                                    Peel’s 2018 Financial Scorecard indicates that
sustainability that provide a holistic perspective
                                                                    the Region is on track with the majority of its
on the Region’s financial condition. These pillars
                                                                    targets, and has maintained its AAA credit rating.
include:
                                                                    At the same time, the Region has maintained a
»» Financial Sustainability:                                        satisfactory level of services with 75 per cent
  This can be defined as the “ability to provide                    of the residents saying that the programs and
  and maintain planned service and infrastructure                   services offered by the Region provide good value
  levels without resorting to unplanned increases                   for taxpayer money. The scorecard recommended
  in rates or disruptive cuts to services.”14                       collaborating with local municipalities to address
                                                                    the changing nature of employment in order to
                                                                    maintain adequate non-residential tax revenues.18
                                                                                                                                     9 | THE MOWAT CENTRE

11 Non-standard work includes temporary jobs, part-time jobs,
sub-contracting, multiple job-holding and self- employment.
12 Data from the Region of Peel.                                    15 Ibid.
13 Peel Data Centre “General Facts (2016 Census).” https://www.     16 Ibid.
peelregion.ca/planning/pdc/data/quickfacts.htm.                     17 Ibid.
14 Region of Peel (2013) “Long Term Financial Planning Strategy.”   18 Region of Peel (2018) “2018 Financial Condition Scorecard.”
https://www.peelregion.ca/finance/PDFs/Long-Term-Financial-         https://www.peelregion.ca/finance/pdfs/2018/2018-financial-
Planning-Strategy.pdf.                                              scorecard.pdf.
Historical Growth of Peel’s                                              The lower-tier municipalities (the combined
                                                                                                                                 total of Mississauga, Brampton and Caledon),
                                                        Upper and Lower Tier
                                                                                                                                 increased their spending over this period at a
                                                        Expenditure and Revenue                                                  slightly faster rate. It increased from about $1.1
                                                        Both levels of municipal government in Peel have                         billion to about $1.6 billion. This increase by the
                                                        had fairly rapid spending growth, as compared                            lower-tier governments represents an annual
                                                        to the average of all Ontario municipalities. Over                       growth rate of about 1.4 per cent in real per capita
                                                        the historical period for which consistent data                          spending.
                                                        is available, the Peel upper tier’s total current
                                                                                                                                 Both of these growth rates considerably exceeded
                                                        expenditures increased from about $1.2 billion to
                                                                                                                                 the provincial average for all municipalities, which
                                                        about $1.7 billion.19 When inflation and population
                                                                                                                                 was only 0.2 per cent (note that the province-
                                                        growth are factored out, this represents an annual
                                                                                                                                 wide average may not be representative due to
                                                        growth rate of about 1.2 per cent in real per capita
                                                                                                                                 significant differences in the expenditure growth
                                                        spending over the period.
                                                                                                                                 rate of municipalities; for example, the City of
                                                                                                                                 Toronto had an average annual real per capita
                                                            FIGURE 4                                                             spending change of -0.6 per cent over the period).
                                                                                                                                 The growth of spending in Peel was considerably
                                                        Growth in real per-capita spending,                                      more than the growth in real personal disposable
                                                        annual average, 2010-2017                                                income. This implies that the cost of municipal
                                                                   1.6                                                           government, in the form of taxes and user fees,
                                                                   1.4
                                                                                                                                 is occupying a growing share of the household
                                                                                                                                 budget. In Ontario as a whole, property tax has
                                                                   1.2
                                                                                                                                 increased by about 23 per cent more than the
                                                                    1
                                                                                                                                 overall Consumer Price Index between 2002
                                                        Per cent

                                                                   0.8
                                                                                                                                 and 2017. In the Region of Peel, real per capita
                                                                   0.6
                                                                                                                                 property-tax revenue increased nearly 2 per cent
                                                                   0.4                                                           per year from 2001 to 2017.20
                                                                   0.2
                                                                                                                                 It is challenging to restrain the growth of costs.
10 | RETHINKING MUNICIPAL FINANCE FOR THE NEW ECONOMY

                                                                    0
                                                                         Ontario Municipal   Peel Lower Tier   Peel Upper Tier   Municipal services are labour intensive and tend to
                                                                             Average
                                                                                                                                 have relatively little productivity growth. In fact, the
                                                        Source: Created by Mowat based on data obtained from the                 inflation rate for municipal services is higher than
                                                        Ministry of Municipal Affairs and Housing’s “Financial Information
                                                        Return” website.                                                         the general inflation rate. It could be argued that,
                                                                                                                                 if real per capita spending grows only at a zero
                                                                                                                                 rate, using the general inflation rate, in reality the
                                                                                                                                 quantity or quality of services is being cut.
                                                        19 Data obtained from the Ministry of Municipal Affairs and
                                                        Housing’s “Financial Information Return” website: https://efis.
                                                        fma.csc.gov.on.ca/fir/Welcome.htm. The spending figures are
                                                        obtained from Table 40 of each municipality’s Return; the amounts
                                                        for transfers received are deducted, as these are items that do
                                                        not have to be covered by current own-source revenue. The quote          20 Mowat calculation based on Statistics Canada and Peel Region
                                                        figures refer to spending in 2009 and 2017, respectively. With 2009      data; Statistics Canada (2018) “Consumer Price Index, annual
                                                        as the base year, the percentage growth can be calculated for the        average, not seasonally adjusted.” https://www150.statcan.gc.ca/
                                                        period from 2010 to 2017, inclusive.                                     t1/tbl1/en/tv.action?pid=1810000501.
Whatever the reasons may have been for the rapid                                               Composition and Sources
         growth in spending, the past rate of growth is likely
                                                                                                        of Revenue
         to be unsustainable. Continued real per capita
         growth in spending at such a rapid rate would                                                  The composition of revenue in Peel has also
         create a substantial upward trend in property tax                                              changed somewhat, as seen in Figure 6. In 2001,
         as a percentage of household income in the long                                                the lower-tier municipalities obtained about 40 per
         term, as depicted in Figure 5. In order to maintain                                            cent of their revenue from user fees, license fees
         property tax at a constant share of household                                                  etc., rather than from property tax. By 2017, they
         income, real per capita spending would need to be                                              were getting about 70 per cent of their revenue
         reduced to a growth rate of 0.5 per cent per year.                                             from property tax. By contrast, the upper-tier
                                                                                                        government increased its reliance on fee revenue
                        FIGURE 5                                                                        between 2001 and 2017. Peel’s reliance on user
                                                                                                        and license fees as a percentage of revenues is
         Residential property tax % of income,                                                          now slightly below the provincial average. To the
         alternative scenarios of spending                                                              extent that there is room for increasing reliance on
                                                                                                        those fees, it may be desirable to do so.
                                   6.00
% of household disposable income

                                                    Continued growth of spending at
                                   5.50             historic rates
                                                                                                         FIGURE 6
                                                    Real per capita spending grows 0.5
                                                    per cent per year
                                   5.00
                                                                                                        Per cent share of current revenue from
                                   4.50                                                                 user fees, license fees, etc.
                                                                                                                                           Upper Tier
                                   4.00                                                                 45                                 Lower Tier
                                                                                                        40                                 Ontario average
                                   3.50
                                                                                                        35
                                   3.00                                                                 30
                                          2018 2020 2022 2024 2026 2028 2030 2032 2034 2036 2038 2040
                                                                                                        25
                                                                                                        20
         Source: Created by Mowat based on Region of Peel data.                                         15
                                                                                                        10
                                                                                                         5
                                                                                                         0
                                                                                                                        2001                        2017

                                                                                                        Source: Created by Mowat based on Region of Peel data.

                                                                                                        As a result of the reduced reliance of the lower-tier
                                                                                                        governments on fees relative to 2001, the share
                                                                                                        of the municipal property-tax revenue in Peel
                                                                                                        going to the lower-tier municipalities increased
                                                                                                        substantially. In 2001, the lower-tier municipalities
                                                                                                                                                                 11 | THE MOWAT CENTRE

                                                                                                        combined were receiving less than $300 million
                                                                                                        of property-tax revenue, compared to almost $500
                                                                                                        million for the upper tier. By 2018, the property-tax
                                                                                                        revenue received by each level was almost equal,
                                                                                                        at about $1 billion.
Context of Municipal                                              public utilities, economic development services
                                                                                                                          and business licensing. The Act also outlines
                                                        Governance and Taxation                                           in detail the authority and limits to municipal
                                                        The following section provides a broad overview                   taxation, primarily in relation to property taxes –
                                                        of municipal governance and revenue sources in                    the only major taxation tool available to municipal
                                                        Canada and Ontario, as the Region of Peel faces                   governments in Ontario.22 Finally, the Act sets out
                                                        a similar set of challenges to other municipalities               the requirement that municipalities, unlike federal
                                                        in the country due to high-level macroeconomic                    and provincial governments, must balance their
                                                        trends as well as identical legislative barriers.                 annual budgets (i.e. they cannot run deficits).23
                                                                                                                          From a fiscal health perspective, all of this means
                                                        Municipal governments in Canada operate in                        that autonomy in decision-making and revenue
                                                        a rather different context than municipalities                    generation is significantly constrained.
                                                        elsewhere in the world. As a result of our federal
                                                        structure and intergovernmental relationships,                    All municipal governments in Ontario operate
                                                        local and regional municipalities in Canada face                  under the Municipal Act with the exception of
                                                        a unique set of opportunities and challenges that                 the City of Toronto, which in recognition of its
                                                        impact their current fiscal health. Discussions                   size and unique demands, has its own municipal
                                                        around municipal governance cannot be had                         statute. The City of Toronto Act, 2006 similarly
                                                        without addressing the fact that decision-making                  outlines the responsibilities of Toronto’s municipal
                                                        powers for local governments were not enshrined                   government, with additional powers and unique
                                                        in the Canadian Constitution. Section 92 of the                   revenue tools that have not, to date, been granted
                                                        Constitution Act, 1867 outlines the division of                   to other municipalities in the province.
                                                        powers for the federal and provincial governments,                Over the years, there has also been a shift in
                                                        granting provincial legislatures exclusive                        responsibilities, and municipal governments
                                                        responsibility over laws relating to municipal                    have witnessed significant downloading of
                                                        institutions. Thus, local governments are legally                 responsibilities from the federal and provincial
                                                        subordinate to their provincial counterparts, which               governments (discussed in greater detail in the
                                                        have a “largely unfettered” scope of control over                 following section). While local governments in
                                                        municipal affairs.21 This means that any authority                Canada have been increasingly burdened with
12 | RETHINKING MUNICIPAL FINANCE FOR THE NEW ECONOMY

                                                        – including taxation authority – must be explicitly               new responsibilities, the revenue tools available to
                                                        provided to local governments through provincial                  them have not changed to reflect this.24
                                                        legislation.

                                                        In Ontario, the Municipal Act, 2001 sets out the
                                                        responsibilities of local governments in the
                                                        province. The Act outlines broad authority for
                                                                                                                          22 Municipal Act, 2001, S.O. 2001, c. 25. https://www.ontario.ca/
                                                        lower and upper-tier municipalities to pass by-laws               laws/statute/01m25#BK348.
                                                        in relation to specific spheres of jurisdiction, such             23 Bruce Ratford “Legislated Budget Requirements – The
                                                                                                                          Balancing Act.” PSAB/Asset Management Newsletter No. 49,
                                                        as transportation systems, waste management,                      AMCTO and MFOA. http://www.mfoa.on.ca/MFOA/webdocs/
                                                                                                                          PSAB_Newsletter_No_49.pdf.
                                                                                                                          24 Robert Duffy, Gaetan Royer and Charley Beresford (2014)
                                                        21 Erin Tolley and William R. Young (2001) “Municipalities, the   “Who’s picking up the tab? Federal and provincial downloading
                                                        constitution, and the Canadian federal system.” Government        onto local governments.” Columbia Institute, Centre for Civic
                                                        of Canada. http://publications.gc.ca/Collection-R/LoPBdP/BP/      Governance. http://www.civicgovernance.ca/wordpress/wp-content/
                                                        bp276-e.htm#Legislative.                                          uploads/2014/09/Whos-Picking-Up-the-Tab-FULL-REPORT.pdf.
It can be argued that the way we approach local
governance is generally outdated. While we still
use the Constitution’s initial division of powers,
municipalities must now deal with complex emerging
issues – some of which were inconceivable 150 years
ago. Consider the municipal responses to issues
such as having to regulate fast-moving technology
and platform service delivery (e.g. Uber), as well as
climate change mitigation and adaptation measures
that require significant capital investments to
address extreme weather events. Today, however,
municipalities remain “creatures of the province” and
have limited authority and resources to respond to the
growing pressures and emerging challenges they face.

Shift in Responsibilities
and Revenues
During the 1990s, revenue pressures increased on
municipalities due to increased responsibilities as
a result of downloading. At the federal level, the
1995 budget ended the Canada Assistance Plan and
Established Programs Financing, and replaced them
with the Canada Health and Social Transfer. This
meant significant cuts to provincial transfers in the
areas of social assistance, post-secondary education
and healthcare funding. This further translated into
cuts for municipalities. While the federal government
introduced a series of programs targeting urban
issues, these were not sufficient to offset the impacts
of downloading.25 This downloading resulted in
increased municipal reliance on property taxes for
revenue generation. Further, due to inadequate means
of raising revenues, many municipalities became
forced to rely on urban growth as a way of increasing
their property-tax base.26
                                                                       13 | THE MOWAT CENTRE

25 Carlo Fanelli (2014) “Under Pressure: How Public Policy is
Constraining Ontario Municipalities.” Canadian Centre for Policy
Alternatives, Ontario. pp. 12-15. https://www.policyalternatives.ca/
sites/default/files/uploads/publications/Ontario%20Office/2014/10/
Under%20PressureFINAL.pdf.
26 Ibid.
FIGURE 7
                                                        The effects of Local Services Realignment (LSR), 1998

                                                        Source: André Côté and Michael Fenn (2014) ‘Provincial-Municipal Relations in Ontario: Approaching an Inflection Point.’ Institute on
                                                        Municipal Finance and Governance. pp. 10. https://munkschool.utoronto.ca/imfg/uploads/275/1560_imfg_no_17_online_full_colour.pdf.
14 | RETHINKING MUNICIPAL FINANCE FOR THE NEW ECONOMY

                                                        At the provincial level, during the late 1990s                         several essential social services.27 The change
                                                        and early 2000s, the Ontario government                                in responsibilities prior to and after the LSR are
                                                        introduced three major reforms – realigning                            described in Figure 7.28
                                                        responsibilities between the provincial and
                                                                                                                               For every household tax dollar paid in Ontario,
                                                        local levels, halving the number of municipal
                                                                                                                               municipalities collect only 9 cents, while 44
                                                        governments through restructuring and
                                                        amalgamations, and comprehensively reforming
                                                        the property-tax system. In January 1998, the                          27 André Côté and Michael Fenn (2014) “Provincial-Municipal
                                                                                                                               Relations in Ontario: Approaching an Inflection Point.” Institute on
                                                        Local Services Realignment (LSR) – often referred                      Municipal Finance and Governance. pp. 9-10. https://munkschool.
                                                        to as downloading – took effect that required                          utoronto.ca/imfg/uploads/275/1560_imfg_no_17_online_full_
                                                                                                                               colour.pdf.
                                                        municipalities to take responsibility for funding                      28 Note that funding responsibilities have further shifted over the
                                                                                                                               years. For example, Ontario Works benefits costs were phased out
                                                                                                                               between 2010 and 2018, and fully uploaded to the province last year.
cents go to the province and 47 cents go to the                         The research found that while the revenue tools
federal government.29 Despite receiving the lowest                      available to municipalities remained the same,
share of the economic pie, municipalities across                        expenditures rose steadily during this period.
Canada face a number of significant expenditure                         In particular, expenditure on social services
responsibilities. Ontario municipalities in particular                  increased significantly in Ontario after the LSR in
are responsible for a broad suite of services (see                      1998. The largest proportionate increase in the
Figure 8).                                                              expenditure was on housing.30

The Institute on Municipal Finance and                                  In the period from 1988 to 2004, property taxes
Governance conducted an assessment of trends                            and user fees increased in relative importance as
in the levels of expenditures and revenues for all                      revenue sources for Canadian municipalities, while
three orders of government from 1988 to 2004 to                         intergovernmental transfers – particularly from the
understand whether there is a fiscal imbalance.                         provincial government – decreased significantly.

 FIGURE 8
Municipal expenditure responsibilities across Canada, 2005

Source: Association of Municipalities of Ontario (2015) “What’s Next Ontario? Imagining a prosperous future for our communities: A fiscal
                                                                                                                                             15 | THE MOWAT CENTRE

overview.” pp. 42. https://www.amo.on.ca/AMO-PDFs/Whats-Next-Ontario/Whats-Next-Ontario-Fiscal-Overview-Accessible-2015.aspx.

29 Association of Municipalities of Ontario (2015) “What’s Next
Ontario? Imagining a prosperous future for our communities: A fiscal    30 Harry M. Kitchen and Enid Slack (2006) “Trends in Public
overview.” pp. 25. https://www.amo.on.ca/AMO-PDFs/Whats-Next-           Finance in Canada.” pp. 2-14. https://munkschool.utoronto.ca/imfg/
Ontario/Whats-Next-Ontario-Fiscal-Overview-Accessible-2015.aspx.        uploads/102/trends_in_public_finance_in_canada___june_1.pdf.
While revenues grew at an annual rate of 0.7 per                        federal and provincial/territorial revenues was also
                                                        cent, expenditures grew at an average rate of 0.9                       considerably higher than municipalities. During
                                                        per cent.31 Further, while federal revenues have                        the twenty-year comparison period, the average
                                                        been increasing, federal expenditures in constant                       annual increase (in per capita constant dollar
                                                        dollars per capita have been declining. For the                         terms) in federal revenues was 0.8 per cent while it
                                                        provincial government, while expenditures were                          was 1.9 per cent for provincial revenues. Municipal
                                                        increasing, they were increasing at a slower rate                       revenues grew at a rate of 1.5 per cent (see Figure 9).
                                                        than revenues. Only for the municipal governments
                                                                                                                                The Federation of Canadian Municipalities
                                                        were expenditures increasing at a faster rate than
                                                                                                                                (FCM) also looked at revenues for each order
                                                        revenues.32
                                                                                                                                of government as a proportion of consolidated
                                                        The Federation of Canadian Municipalities                               revenues for all governments. This has stayed
                                                        conducted a study comparing revenues for                                pretty much the same over the years with
                                                        all three orders of government from 1989 to                             provincial/territorial governments accounting
                                                        2009 which found similar results. Provincial/
                                                                                                    33
                                                                                                                                for the largest proportion, while municipal
                                                        territorial governments in Canada raised the most                       governments account for the smallest proportion
                                                        revenues on a per capita basis. The share of                            (See Figure 10). These facts point towards the

                                                         FIGURE 9
                                                        Federal, provincial and municipal government revenues per-capita, 1989-2009,
                                                        constant (1988) dollars
16 | RETHINKING MUNICIPAL FINANCE FOR THE NEW ECONOMY

                                                        Source: Federation of Canadian Municipalities (2012) “The State of Canada’s Cities and Communities 2012.” Chapter 1. pp. 11. https://
                                                        suma.org/img/uploads/documents/FCM%202012%20State%20of%20Cities%20and%20Communities.pdf.

                                                        31 Ibid.
                                                        32 Ibid.
                                                        33 See: Federation of Canadian Municipalities (2012) “The State of
                                                        Canada’s Cities and Communities 2012.” Chapter 1. https://suma.
                                                        org/img/uploads/documents/FCM%202012%20State%20of%20
                                                        Cities%20and%20Communities.pdf.
FIGURE 10
Total government revenue as percentage of consolidated revenue, 1988-2008

Source: Federation of Canadian Municipalities (2012) “The State of Canada’s Cities and Communities 2012.” Chapter 1. pp. 12. https://
suma.org/img/uploads/documents/FCM%202012%20State%20of%20Cities%20and%20Communities.pdf.

increasing fiscal burden on municipalities – while                      and provincial governments, which make up on
their expenditure responsibilities have increased                       average over 20 per cent of municipal revenues
substantially, they continue to receive the smallest                    in Ontario.34 The bulk of these transfers come
share of overall government revenues, which has                         from the provincial government – some of which
stayed constant over the years. Further, revenue                        are unconditional, although most are conditional.
growth has not kept pace with expenditure growth                        This means that funds are earmarked to be
for municipalities.                                                     spent on specific programs or services such as
                                                                        public health, social services and transportation.
Primary Municipal                                                       Conditional transfers, while an important

Revenue Sources                                                         revenue source, can have negative implications
                                                                        for a municipality’s fiscal management and
Local and regional municipal governments in                             accountability.35
Ontario have a limited set of tools to use for
revenue generation. A large portion of operating                        Property taxes, development charges and user
and capital expenditures are financed from three                        fees are the focus of analysis in this report. Each
primary sources: residential and non-residential                        have their benefits and drawbacks in the municipal
property taxes, development charges, and user                           context, which are described below.
                                                                                                                                               17 | THE MOWAT CENTRE

fees. In addition to these sources, municipalities
derive revenue from licensing and permits,
although these consist of considerably smaller                          34 André Côté and Michael Fenn (2014) “Provincial-Municipal
sums. A much larger portion of funds comes                              Relations in Ontario: Approaching an Inflection Point.” Institute on
                                                                        Municipal Finance and Governance. https://munkschool.utoronto.
from intergovernmental transfers from the federal                       ca/imfg/uploads/275/1560_imfg_no_17_online_full_colour.pdf.
                                                                        35 Ibid.
class. Generally speaking, when revenues decline
                                                                                                                          from one portion of the tax base, the burden
                                                        Property Taxes                                                    is shifted elsewhere in the tax base (e.g. from
                                                        Property taxes remain the primary revenue source                  non-residential to residential). Alternatively,
                                                        for municipalities in Ontario and across Canada:                  municipal governments would need to make cuts
                                                        on average, property taxes (including payments                    in spending to balance their budgets in spite of the
                                                        in lieu of property taxes) account for 45 per cent                lower revenue.
                                                        of municipal revenues across Canada and 46
                                                                                                                          Most municipalities in Ontario rely heavily on
                                                        per cent in Ontario.36 The property tax in Ontario
                                                                                                                          the property-tax base for funding public services
                                                        has two components – a municipal portion and
                                                                                                                          – particularly from the residential base. In the
                                                        a provincial education portion. Both municipal
                                                                                                                          Region of Peel, for example, the reliance on
                                                        and education property taxes are based on the
                                                                                                                          residential tax base has been growing over time
                                                        assessed value of a property as determined by
                                                                                                                          and currently sits at around 63.6 per cent of the
                                                        the Municipal Property Assessment Corporation
                                                                                                                          total property-tax revenue. This is picking up the
                                                        (MPAC), and this value is updated every four years.
                                                                                                                          slack from declines in non-residential revenues:
                                                        Property-tax rates are applied to this value, and
                                                                                                                          the share of revenue from industrial property is on
                                                        are set autonomously by municipal governments
                                                                                                                          a downward trend (falling from around 9 per cent
                                                        within provincial constraints – for those operating
                                                                                                                          in 2000 to 5 per cent in 2018), in large part due
                                                        within a two-tiered structure, both the local and
                                                                                                                          to the decline of manufacturing. The share from
                                                        regional governments set their own rate and
                                                                                                                          commercial and office buildings has remained
                                                        neither can influence the other’s rate-setting.
                                                                                                                          relatively stable over this time period, at around 20
                                                        Property owners pay this combined amount, in
                                                                                                                          per cent (see Figures 11, 12 and 13).38
                                                        addition to the provincial education tax, to their
                                                        local municipality.37 Tenants pay property taxes                  As a revenue tool, the property tax has its
                                                        indirectly to their landlord through rent.                        proponents and critics. From an economic
                                                                                                                          efficiency standpoint, the property tax is a good
                                                        There are multiple classes and subclasses of
                                                                                                                          tax – particularly for local governments. Relative
                                                        property with various rates. For the purposes of
                                                                                                                          to other taxes on income and sales for example,
                                                        this report, it is important to make a distinction
                                                                                                                          property is inelastic, which means there is a
                                                        between residential and non-residential property-
18 | RETHINKING MUNICIPAL FINANCE FOR THE NEW ECONOMY

                                                                                                                          relatively small impact on economic behaviour
                                                        tax classes. While residential property-tax rates
                                                                                                                          compared to other taxes.39 Property is also
                                                        are applied to homeowners, non-residential
                                                                                                                          immovable: since property cannot be hidden and
                                                        property-tax rates are applied to businesses, which
                                                                                                                          the base cannot shift location as a result of the
                                                        can further be broken down into commercial
                                                                                                                          tax, it is difficult to evade property taxes.40 This
                                                        (including office) and industrial properties. While
                                                                                                                          results in a relatively stable base and consistent
                                                        the rates vary depending on the property class,
                                                                                                                          source of revenue for municipalities.
                                                        the taxes are flat – meaning that the same rate
                                                        is applied to all properties that fall within that

                                                        36 Calculations from Enid Slack based on 2016 data.               38 Mowat calculation based on Region of Peel data.
                                                        37 The education tax is applied to properties across Ontario as   39 Enid Slack and Richard M. Bird (2015) “How to Reform the
                                                        a means to help fund the elementary and secondary education       Property Tax: Lessons from around the World.” Institute on
                                                        system. These rates are determined by Ontario’s Minister of       Municipal Finance and Governance. https://munkschool.utoronto.
                                                        Finance under the Education Act and apply to multiple property    ca/imfg/uploads/325/1710_imfg_no.21_online_sept17.pdf.
                                                        classes. See: https://www.fin.gov.on.ca/en/tax/pt/index.html.     40 Ibid.
FIGURE 11
                                                                                                                                                                                                                                However, the property
                                         The share of revenue from industrial property is on a                                                                                                                                  tax is often criticized for
                                         downward trend                                                                                                                                                                         being regressive as lower-
                                                                                                                                                                     10.0                                                       income households are
                                                                                                                                                                      9.0
                                                                                                                                                 total tax revenue

                                                                                                                                                                      8.0
                                                                                                                                                                                                                                disproportionately burdened.
                                                                                                                                                                      7.0
                                                                                                                                                                     10.0                                                       This has become a particular
                                                                                                                                                                      6.0
                                                                                                                                                                      9.0                                                       challenge for seniors living on
                                                                                                                                             of revenue

                                                                                                                                                                      5.0
                                                                                                                                                                      8.0
                                                                                                                                                                      4.0
                                                                                                                                                                      7.0                                                       a fixed income but residing
                                                                                                                                                                      3.0                                                       in homes which have had
                                                                                                                                      sharetax

                                                                                                                                                                      6.0
                                                                                                                                                                     10.0
                                                                                                                                                                      2.0
                                                                                                                                                                      5.0
                                                                                                                                   % total

                                                                                                                                                                      9.0                                                       property values soar over time
                                                                                                                            tax revenue

                                                                                                                                                                      1.0
                                                                                                                                                                      4.0
                                                                                                                                                                      8.0
                                                                                                                                                                                                                                (i.e., asset-rich but income-
                                                                                                                                  of

                                                                                                                                                                      0.0
                                                                                                                                                                      3.0
                                                                                                                                                                      7.0 2000 2002 2004 2006 2008 2010 2012 2014 2016 2018
                                                                                                                         % share

                                                                                                                                                                      2.0
                                                                                                                                                                      6.0                                                       poor households), and must
                                                                                                                                                                      1.0
                                                                                                                                                                      5.0                                                       pay significantly higher
                                                                                          total tax revenue% share of total

                                                                                                                                                                      0.0
                                                                                                                                                                      4.0 2000 2002 2004 2006 2008 2010 2012 2014 2016 2018
                                                                                                  FIGURE 12                                                           3.0                                                       property taxes as a result
                                                                                                                                                                     71.0
                                                                                                                                                                      2.0                                                       despite limited income.41 For
                                         Peel is increasingly reliant on residential property tax                                                                    70.0
                                                                                                                                                                      1.0
                                                                                                                                                                      0.0
                                                                                                                                                                                                                                this reason and others, it is
                                                                                                                                                                     69.0
                                                                                                                                                                     71.0 2000 2002 2004 2006 2008 2010 2012 2014 2016 2018
                                                                                                                                                                                                                                politically unpopular, and most
                                                                                                                                                                     68.0
                                                                                                                                                                     70.0
                                                                                                                                                                                                                                provincial-level governments
                                                                                                                                                                     67.0
                                                                                      of revenue

                                                                                                                                                                     69.0
                                                                                                                                                                                                                                offer tax deferrals or some other
                                                                                                                                                                     66.0
                                                                                                                                                                     68.0
                                                                                                                                                                     71.0
                                                                                                                                                                     65.0
                                                                                                                                                                                                                                programs to address regressivity
                                                                               sharetax

                                                                                                                                                                     67.0
                                                                                                                                                                     70.0                                                       at the low end of the income
                                                                                                                                                                     64.0
                                                                            % total

                                                                                                                                                                     66.0
                                                                     tax revenue

                                                                                                                                                                     69.0                                                       spectrum, especially for seniors.
                                                                                                                                                                     63.0
                                                                                                                                                                     65.0
                                                                           of

                                                                                                                                                                     68.0
                                                                                                                                                                                                                                Furthermore, it is highly visible,
                                                                  % share

                                                                                                                                                                     62.0
                                                                                                                                                                     64.0
                                                                                                                                                                     67.0   2000 2002 2004 2006 2008 2010 2012 2014 2016 2018
                                                                                                                                                                                                                                and it is difficult to reform or
                                                                                                                                                                     63.0
                                                    % share of total

                                                                                                                                                                     66.0
                                                                                                                                                                                                                                increase rates.42 In fact, some
                                                                                                                                                                     62.0
                                                                                                                                                                     65.0   2000 2002 2004 2006 2008 2010 2012 2014 2016 2018   municipal governments in
                                                                                                                                                                     64.0
                                                                                                                                                                     25.0                                                       Ontario do not raise property
                                      total tax revenue

                                                                                                                                                                     63.0
                                                                                                  FIGURE 13                                                          20.0                                                       taxes sufficiently to keep pace
                                                                                                                                                                     62.0
                                                                                                                                                                     25.0 2000 2002 2004 2006 2008 2010 2012 2014 2016 2018     with the rate of inflation (most
                                         Commercial and office buildings have remained                                                                               15.0
                                  of revenue

                                            20.0
                                                                                                                                                                                                                                notably Toronto in the last few
                                         fairly
                                            10.0steady at around 20%
                                                                                                                                                                                                                                years) – resulting in a loss of
                           sharetax

                                                                                                                                                                     15.0
                                                                                                                                                                      5.0
                                                                                                                                                                     25.0                                                       revenue in real terms.
                        % total
                 tax revenue

                                                                                                                                                                     10.0
                                                                                                                                                                      0.0
                                                                                                                                                                     20.0
                       of

                                                                                                                                                                            2000 2002 2004 2006 2008 2010 2012 2014 2016 2018
              % share

                                                                                                                                                                      5.0                                                       41 Michael Bradfield (2013) “Policy Points:
                                                                                                                                                                     15.0                                                       An alternative to property taxes.” Canadian
                                                                                                                                                                      0.0                                                       Centre for Policy Alternatives, Nova
% share of total

                                                                                                                                                                                                                                                                              19 | THE MOWAT CENTRE

                                                                                                                                                                     10.0   2000 2002 2004 2006 2008 2010 2012 2014 2016 2018
                                                                                                                                                                                                                                Scotia. https://www.policyalternatives.ca/
                                                                                                                                                                                                                                publications/commentary/policy-points-
                                                                                                                                                                      5.0                                                       alternative-property-taxes.
                                                                                                                                                                                                                                42 Enid Slack (2011) “The Property Tax
                                                                                                                                                                      0.0                                                       – in Theory and Practice.” Institute on
                                                                                                                                                                            2000 2002 2004 2006 2008 2010 2012 2014 2016 2018
                                                                                                                                                                                                                                Municipal Finance and Governance. https://
                                                                                                                                                                                                                                munkschool.utoronto.ca/imfg/uploads/173/
                                         Source: Created by Mowat based on Region of Peel data.                                                                                                                                 enidslack_imfg_no._2_online.pdf.
Development Charges                                       development (e.g. office space) and developments
                                                                                                                  that drive social objectives (e.g. affordable
                                                        Development charges are one-time fees that
                                                                                                                  housing). Exemptions may also be provided as a
                                                        municipal governments can levy for infrastructure
                                                                                                                  result of successful appeals made on a case-by-
                                                        in new developments or redevelopment in their
                                                                                                                  case basis.
                                                        jurisdictions. These charges are collected from
                                                        developers at the time that a building permit is          While exemptions may be of strategic importance
                                                        issued, and are designed to help recover growth-          or are otherwise unavoidable, they can result in
                                                        related capital costs required to service new             significant sums of lost revenue for municipal
                                                        developments.                                             governments. Furthermore, when some properties
                                                                                                                  are exempt from development charges, it means
                                                        Ontario’s Development Charges Act outlines the
                                                                                                                  that they are not paying their portion of the
                                                        process whereby municipal governments can
                                                                                                                  infrastructure necessitated by the development.
                                                        impose development charges, and on which
                                                                                                                  This invariably means that someone else is paying
                                                        eligible development they can be levied – namely
                                                                                                                  for it – and therefore the rationale behind these
                                                        “hard services” such as water, wastewater
                                                                                                                  exemptions must be thoroughly considered.
                                                        and roads; and “soft services” such as social
                                                        housing and police services. Local and regional           The most significant criticism of the development-
                                                        governments can introduce the levies through              charges concept is that while they are designed
                                                        municipal by-laws and set their own rates after           to pay for growth in theory, this is rarely the case
                                                        completing a mandatory background study that              in practice. Many municipalities in Ontario –
                                                        provides details on the growth projections as well        particularly in Southern Ontario – have indeed
                                                        as capital expenditure forecasts used to inform           benefitted from development-charges revenues
                                                        their decisions. Municipalities must revisit their        during population and housing booms, even
                                                        development charges with a new background                 though the charges levied did not result in full cost
                                                        study every five years.                                   recovery of capital investments. This is due in part
                                                                                                                  to the fact that growth has not necessarily kept
                                                        Development charges are typically applied to both
                                                                                                                  pace with forecasts used to make decisions for
                                                        residential and non-residential developments,
                                                                                                                  infrastructure investments – particularly provincial
                                                        although these are calculated somewhat
                                                                                                                  projections used through the Places to Grow Act.
                                                        differently. Peel currently derives the majority of its
20 | RETHINKING MUNICIPAL FINANCE FOR THE NEW ECONOMY

                                                        $247.5 million development-charges revenue from           When local and regional governments begin
                                                        residential development – making up 80 per cent           making investments in infrastructure that are
                                                        of the total with the remaining 20 per cent coming        not met with anticipated growth, municipalities
                                                        from non-residential development. This make-up            are left with unexpected costs. Like many other
                                                        was more or less consistent between 2002 and              municipalities, this has been the case in Peel for
                                                        2017.                                                     both residential and non-residential projections.
                                                                                                                  While non-residential development makes up a
                                                        Municipalities may decide to grant exemptions
                                                                                                                  smaller proportion of total revenues, its shortfall
                                                        or deferrals for development charges in some
                                                                                                                  from planned revenues is more substantial (see
                                                        instances for strategic reasons. Exemptions
                                                                                                                  Figures 14 and 15).
                                                        are common for places of worship for example,
                                                        as well as non-residential developments that
                                                        could attract investment and drive economic
Furthermore, not all infrastructure is eligible
 FIGURE 14
                                                                                                                              for development charges, and some types of
Residential DC revenues, planned vs.                                                                                          infrastructure must have a 10 per cent discount
actual, Peel Region, 2002-2017                                                                                                rate applied.

400,000,000                                                                                                                   Other concerns around the sustainability of
350,000,000                        Planned
300,000,000                         Actual
                                                                                                                              development charges as a revenue source
250,000,000                                                                                                                   centre on its emphasis on constant growth
200,000,000
150,000,000
                                                                                                                              and development – particularly greenfield
100,000,000                                                                                                                   development. The current model places high
400,000,000
 50,000,000
350,000,000
          0
                                   Planned                                                                                    value on greenfield developments (i.e. those that
300,000,000                         Actual
                                                                                                                              lack constraints imposed by prior work), which
              2002
                     2003

                                   2005
                                          2006
                                                 2007
                                                        2008
                                                               2009
                                                                      2010
                                                                             2011
                                                                                    2012
                                                                                           2013

                                                                                                         2015
                                                                                                                2016
                                                                                                                       2017
                            2004

                                                                                                  2014
250,000,000
200,000,000                                                                                                                   inevitably slows down as a city urbanizes and
150,000,000
250,000,000
                                                                                                                              reaches capacity (e.g. Mississauga). Brownfield
100,000,000
 FIGURE 15
 50,000,000                        Planned                                                                                    developments (i.e. land previously used or built
200,000,000                         Actual
          0
Non-residential    DC revenues, planned vs.                                                                                   upon; structures needing to be demolished or
              2002
                     2003

                                   2005
                                          2006
                                                 2007
                                                        2008
                                                               2009
                                                                      2010
                                                                             2011
                                                                                    2012
                                                                                           2013

                                                                                                         2015
                                                                                                                2016
                                                                                                                       2017
                            2004

                                                                                                  2014

150,000,000

actual,                                                                                                                       renovated) generally result in less revenue.
100,000,000Peel Region, 2002-2017

 50,000,000
250,000,000
                                                                                                                              Furthermore, from a planning perspective,
          0                        Planned                                                                                    development charges can often provide perverse
200,000,000                         Actual
                                                                                                                              incentives to develop. Since it’s a significant
              2002
                     2003
                            2004
                                   2005
                                          2006
                                                 2007
                                                        2008
                                                               2009
                                                                      2010
                                                                             2011
                                                                                    2012
                                                                                           2013
                                                                                                  2014
                                                                                                         2015
                                                                                                                2016
                                                                                                                       2017

150,000,000
                                                                                                                              revenue generator in some instances, there might
100,000,000
                                                                                                                              be an inclination for municipalities to build and
 50,000,000
                                                                                                                              approve developments – even if they are not
          0
                                                                                                                              ultimately in the public interest. This misalignment
              2002
                     2003
                            2004
                                   2005
                                          2006
                                                 2007
                                                        2008
                                                               2009
                                                                      2010
                                                                             2011
                                                                                    2012
                                                                                           2013
                                                                                                  2014
                                                                                                         2015
                                                                                                                2016
                                                                                                                       2017

                                                                                                                              of incentives could, for example, be a contributor
Source: Created by Mowat based on Region of Peel data                                                                         to unnecessary sprawl at the expense of more
                                                                                                                              walkable, livable communities.

A striking example of how this might happen                                                                                   User Fees
is the previously proposed GTA West Corridor                                                                                  The other key revenue tool currently available to
– a highway from Vaughan to Milton that                                                                                       municipal governments is user fees. Province-
was projected to generate significant growth                                                                                  wide, municipalities on average derive slightly
and investment throughout Peel Region. The                                                                                    more than one-third of their revenues from fees.
assumption of its completion was included                                                                                     Fees are different from taxes in that they are
in growth forecasts – and its cancellation in                                                                                 effectively charges applied to individuals for the
2018 has left many scrambling to understand                                                                                   use of a particular public service, whereas taxes
its implications on the ability for Peel and other                                                                            are pooled and collectively spent in a broader
                                                                                                                                                                                     21 | THE MOWAT CENTRE

regions to meet their growth projections. There                                                                               manner. This distinction makes user fees easier
are other inherent problems with development-                                                                                 to implement for local and regional municipalities
charges revenue forecasts, including that rates                                                                               from a constitutional standpoint as they do not
are set based on historical data of service levels,                                                                           require approval from the province, although they
which tend not to capture more recent changes.                                                                                still face some restrictions.
You can also read