Rethinking retirement: The impact of demographic change and the pandemic on retirement planning in the 2020s - February 2021 - ASFA
←
→
Page content transcription
If your browser does not render page correctly, please read the page content below
Rethinking retirement:
The impact of demographic
change and the pandemic on
retirement planning in the 2020s   February 2021
Contents

      1. Introduction                                    3

      2. The demographics of ageing                      4

      3. The rise of older workers                       6

      4. Accommodating retirees and the frail elderly    9

      5. Impact of the baby bust                        12

      6. Outlook for retiree personas                   15

      7. Summary points                                 17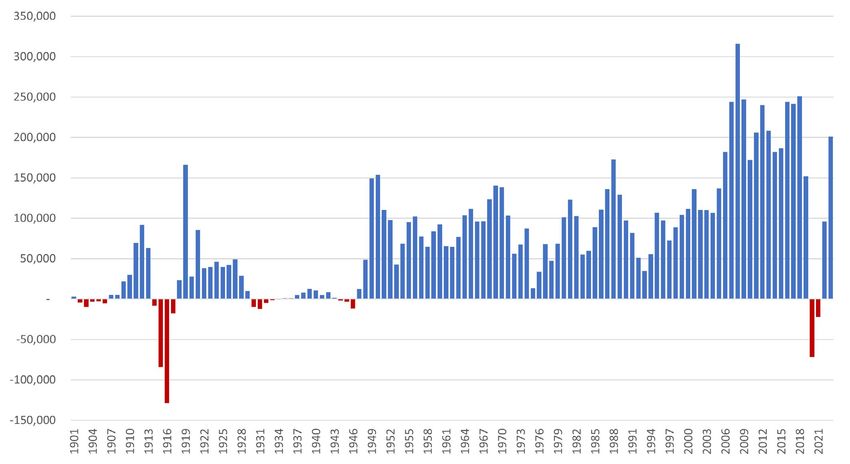
Introduction
1
        This report has been prepared as part of a broader contribution by The
        Demographics Group to the ASFA Conference 2021. (See also “Personas”
        presentation.)

        The coming of COVID-19 has coincided with a number         expectancy, the rise of a super retirement class (that
        of demographic and cultural changes in Australia           is, retiree Baby Boomers), the societal impact of the
        prompting the question of what retirement might look       baby bust, changes in the way the retirement years
        like later in the decade. The 2020s was always going       are perceived (for example, more people choosing to
        to be a period of transition as Baby Boomers retreated     work), trends in accommodation for the elderly, for
        from the workforce placing pressure on resources.          retirees, for active seniors as well as a review of the
                                                                   (occasionally outrageous) lifestyle expectations of the
        However, the pandemic has pressed the reset button –       next generation of retirees.
        not just with regard to the retirement plans for many,
        but also in the way Australians work, in the kind of       There is also a chapter on various retirement
        businesses that prosper, and even in matters like trade    ‘personas’ developed to showcase the lifestyles of
        and alliance relationships.                                those in retirement or planning for their retirement in
                                                                   the 2020s and beyond.
        It also appears that the pandemic has accelerated
        the widespread acceptance of digital transformation.       The report concludes with a summary of main points
        Indeed, it is fair to say that the retiree of the future   and observations.
        will be more technologically proficient in matters like
        customer interactions.

        The balance of this report looks at the change in life

    3 | RETHINKING RETIREMENT: THE IMPACT OF DEMOGRAPHIC CHANGE AND THE PANDEMIC ON RETIREMENT PLANNING IN THE 2020S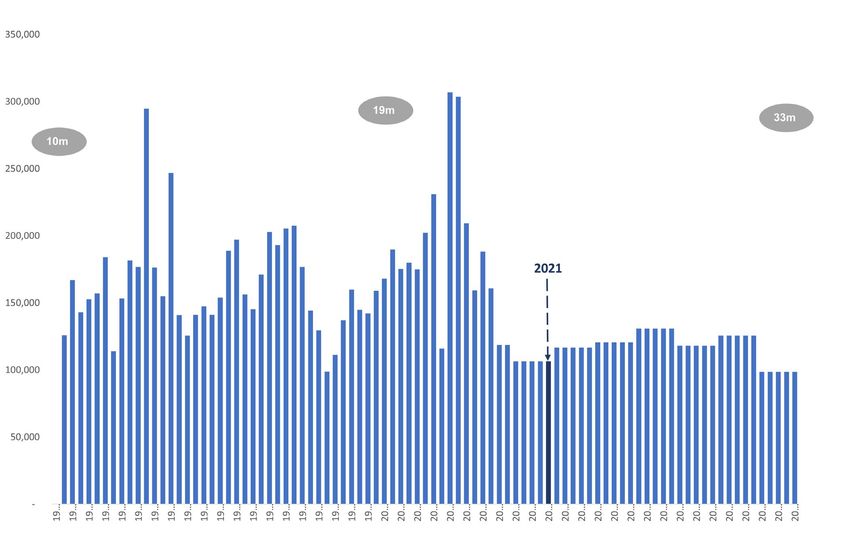
The demographics of ageing
2
        There is no great revelation about the ageing of modern Australia. It is a
        demographic process that has been underway for more than a century.
        Improved public health and medical support have extended the life cycle and
        especially in the developed world. In 1940 the life expectancy of the average
        Australian was 63 years: a bit more for women and a bit less for men.

        Eighty years later and life expectancy has extended to     More significant, however, is the fact in 1980 the
        an average of 83 years. The grandparents of today’s        1.4 million Australians aged 65+ were supported
        Millennial generation got 20 fewer years of life, on       (indirectly via work and taxation) by 9.6 million people
        average. The issue is that the extra years gifted to the   aged 15-64. In broad terms this converts to a ratio of
        lifecycle for today’s Australians aren’t added to youth    almost seven ‘workers’ per ‘retiree’.
        or even to middle age. No, the extra years of life are
        added to the end of life creating, for the first time in   Today the number of workers per retiree is closer to
        history, an extensive retiree class.                       four and by 2040 it will be three. And the reason
                                                                   is that Australians are living longer, the retirement
        Australians have had access to an Age Pension for          cohort is surging because Baby Boomers (born 1946-
        more than a century. But when it was introduced (in        1964) are retiring. Indeed the first Baby Boomer
        1911) access was set at age 65 for men and at age 60       turned 65 in 2011 as an initial step towards a so-
        for women. Men typically died before getting access to     called baby bust of the 2020s (see Section 5).
        a retirement pension. And in many respects this was a
        sensible arrangement given the modest pre-income-tax       The use of terms like Baby Boomer, Generation X,
        tax-base of the Australian economy.                        Millennial and others is somewhat controversial in
                                                                   that it is illogical to ascribe common behaviours to
        Fast forward to 2021 and Australians aged 65+              a cohort based solely on birthyear. However, the
        comprise 4.2 million or 16 per cent of the national        reason why “generations” is such a popular term
        population. Just over 40 years ago in 1980 the number      is that many in business (and the media) find these
        of people aged 65+ (and largely eligible for an Age        “handles” convenient ways of referring to different
        Pension) was 1.4 million or barely 10 per cent of the      markets defined by age or life stage.
        population (see graphic 1).

        Graphic 1: Increasing the burden: Australian population by life stage 1980-2040

                  Year                           0-14                    15-64                             65+

                 1980                          3,710,994               9,571,085                        1,413,277

                 2000                          3,943,342               12,721,200                       2,364,260

                 2020                          4,880,412               16,847,793                       4,145,275

                 2040                          6,070,021               21,186,984                       6,346,371

        Data source: ABS Population Estimates and Projections

    4 | RETHINKING RETIREMENT: THE IMPACT OF DEMOGRAPHIC CHANGE AND THE PANDEMIC ON RETIREMENT PLANNING IN THE 2020S
The demographics of ageing

    Plus, there is an element of truth to so-called            Retirement in the 2020s for example will be shaped
    generational traits in that consumer behaviour that        by the coming of COVID-19, by the surge in Baby
    is often learnt by common experience with, say, the        Boomer numbers, by the pressures effected by the
    Great Depression or with post-war austerity. The           baby bust (that is, more workers leaving than entering
    parents of Baby Boomers, for example, were necessarily     the workforce) and perhaps by the rapid uptake in
    frugal. When they retired in the 1980s many in this        technology.
    generation adapted to their straitened circumstances.
                                                               Retirement in the 2030s on the other hand will be
    The opposite is sometimes said to apply to the             shaped by an easing of demographic pressures,
    Millennial generation (1984-1998) who matured              perhaps by the diversion of public spending towards,
    to adulthood in small, dual-income, families during        say, defence, as opposed to, say, retiree support.
    Australia’s long boom (1992-2020).
                                                               Retirement in the 2040s might be redefined entirely
    The Baby Boomers first breached the retirement cohort      as life expectancy by that time pushes well into the
    during the 2010s and will come to dominate this later      90s.
    stage of the lifecycle during the 2020s.

    Generation-X (1965-1983) will trip across the 65-line
    in 2030 and eventually this generation will come to
    dominate the retirement cohorts during the 2030s and
    2040s. (Note that there isn’t consensus agreement
    on the precise years that relate to each generation;
    definitions can vary by a few years.)

    The issue is that the very foundations of the retirement
    industry, accommodation, funding (including
    superannuation) and consumer behaviour are set in
    place by the values and the demographic weight of the
    preceding generation. At any point in time it is up to
    the newcomers, to the new retirement class, to impose
    their values, to leverage their demographic and cultural
    influence to create a new version of the retirement
    lifestyle.

5 | RETHINKING RETIREMENT: THE IMPACT OF DEMOGRAPHIC CHANGE AND THE PANDEMIC ON RETIREMENT PLANNING IN THE 2020S
The rise of older workers
3
                   One of the responses to the ageing population has been the rise of older
                   workers.

                   The idea of retiring with a pension at the age of 65                             tertiary education, present to the post-65 stage of the
                   was regarded as a goal, as a reward for working hard,                            lifecycle from 2020 onwards.
                   by the generations that preceded the Baby Boomers
                   (that is, collectively ‘pre-boomers’). And especially                            The concept of retirement in the 2020s will be
                   for workers working in an economy dominated by                                   shaped, in part at least, by a surge in university
                   manufacturing and agriculture: the bodies of working                             educated retirees and/or workers, the so-called Work-
                   men and women simply ‘wore out’ by their early 60s.                              on Baby Boomers. (I am tempted to extend this to
                   Working-on wasn’t an option.                                                     “Work-on Baby Boomers Looking for Extra Savings”
                                                                                                    purely in order to create the acronym WOBBLES, but
                   But with the transition of the Australian economy                                maybe that’s a step too far.)
                   to skilled knowledge work a new kind of worker
                   emerged: the office worker or, more recently, the                                The number of Australians aged 65+ still in the
                   knowledge worker. The Baby Boomer generation was                                 workforce in November 2020 was 616,000 or 4.8 per
                   the first cohort of Australians to have had wide access                          cent of the entire workforce. This number comprised
                   to a university education (literally from 1972 onwards).                         more men (369,000) than women (247,000).
                                                                                                    Some 40 years earlier, in November 1980, the 65+
                   The back-half of the boomers (that is, those born 1954-                          workforce numbered 90,000 including 69,000 men
                   1964), including those who had access to fee-free                                (see graphic 2).

    Graphic 2: Pandemic reshapes workforce: employment by age group February-November 2020

                             Male                       Female                        Total                    Change Feb-20 to Nov-20         Change Feb-20 to Nov-20 (%)
     Age group
                   Feb-20           Nov-20     Feb-20            Nov-20     Feb-20             Nov-20       Male       Female        Total    Male       Female        Total

      15-19        326,644          313,497   348,658        340,213       675,301            653,710     -13,146      -8,445      -21,591   -4.0%       -2.4%        -3.2%
      years
      20-24        651,280          617,874   623,582        568,427      1,274,862           1,186,302   -33,406      -55,155     -88,560   -5.1%       -8.8%        -6.9%
      years
      25-29        795,545          805,718   739,283        701,705      1,534,828           1,507,423    10,173      -37,578     -27,405   1.3%        -5.1%        -1.8%
      years
      30-34        839,769          809,079   733,972        718,716      1,573,741           1,527,796   -30,690      -15,255     -45,945   -3.7%       -2.1%        -2.9%
      years
      35-39        811,171          808,552   685,527        708,229      1,496,697           1,516,782    -2,619      22,703      20,084    -0.3%       3.3%         1.3%
      years
      40-44        704,208          715,667   622,768        625,878      1,326,975           1,341,545    11,460       3,110      14,569    1.6%        0.5%         1.1%
      years
      45-49        721,504          709,363   671,357        657,026      1,392,861           1,366,389   -12,142      - 14,331    -26,473   -1.7%       -2.1%        -1.9%
      years
      50-54        647,295          645,798   603,116        612,643      1,250,411           1,258,441    -1,497       9,526       8,029    -0.2%       1.6%         0.6%
      years
      55-59        585,734          581,503   542,609        538,422      1,128,343           1,119,925    -4,231      - 4,187      -8,417   -0.7%       -0.8%        -0.7%
      years
      60-64        436,875          438,122   358,891        376,740       795,766            814,862      1,247       17,849      19,097    0.3%        5.0%         2.4%
      years
     65 years      354,749          368,618   243,694        247,256       598,443            615,873      13,869       3,562      17,431    3.9%        1.5%         2.9%
     and over
       Total      6,874,773     6,813,792     6,173,456     6,095,256     13,048,229      12,909,048      -60,981      -78,200    -139,181   -0.9%       -1.3%        -1.1%

    Data source: ABS Labour Force

               6 | RETHINKING RETIREMENT: THE IMPACT OF DEMOGRAPHIC CHANGE AND THE PANDEMIC ON RETIREMENT PLANNING IN THE 2020S
The rise of older workers

    The rising contribution to the workforce made by         remaining in, or returning to, the workforce (see
    those who, theoretically, “could retire” seems to have   again graphic 2).
    reached an (upward) inflection point around 2006 (see
    graphic 3).                                              Job losses over the eight months to November applied
                                                             to all cohorts under the age of 35. Indeed, there was
    And women do indeed seem to be closing the               a net loss of 89,000 jobs alone in the 20-24 cohort
    ‘workforce participation gap’ in the 65-and-over         and a further net loss of 46,000 in the 30-34 cohort
    cohort. In November 1986 female workers aged 65+         between February and November. The pandemic has
    comprised 0.8 per cent of the national workforce as      taken the jobs of the young and appears to have
    compared with 1.7 per cent for men. However by           encouraged older workers to remain in the workforce.
    November 2020, older female workers accounted for
    4.1 per cent of the workforce as compared with 5.4       This raises the question of the kind of jobs that
    per cent for men.                                        support older workers. The Australian Bureau of
                                                             Statistics provides estimates of the number of workers
    The impact of COVID-19 on workforce participation        by gender and age at quarterly intervals. The top
    has been patchy although most job losses have applied    ten jobs held by male and female workers aged
    to the young and especially to young women. Between      65+ in November 2020 show that men and women
    February and November 2020 (covering the first eight     dominate roughly half these ‘big occupations’ and
    months of the pandemic), there was an increase in        that the other half is shared (see graphic 4).
    the number of older Australians (regardless of gender)

    Graphic 3: Inflection towards older workers: percentage total workforce aged 65+ by gender,
    November 1978-November 2020

    Data source: ABS Labour Force

7 | RETHINKING RETIREMENT: THE IMPACT OF DEMOGRAPHIC CHANGE AND THE PANDEMIC ON RETIREMENT PLANNING IN THE 2020S
The rise of older workers
Older male workers for example dominate the Older women seem to find work in clerical and
occupations of Road and Rail Drivers (26,491 caring roles whereas older men find work in farming,
jobs), Design, Engineering, Science and Transport construction and management.
Professionals (14,180) and Other Labourers (13,649).
It seems logical that as more tertiary-educated Baby
Older women on the other hand dominate the Boomers reach the so-called retirement age of 65
occupations of Numerical Clerks (21,652 jobs), General later in the 2020s, there will be greater workforce
Clerical Workers (18,172) and Carers and Aides participation by this expansive age group. Indeed the
(12,915). Work-on Baby Boomer is likely to gather momentum
within the workforce and culturally in post-pandemic
Jobs that support older workers of both genders Australia.
include Farmers and Farm Managers (40,297 males,
16,750 females), Educational Professionals (22,071
females, 10,657 males) and Business, Human Resources
and Marketing Professionals (20,640 males, 10,701
females).
Graphic 4: Jobs for older workers: top 10 occupations (4-digit) for males and females, November 2020
65+, Male 65+, Female
Total persons Total persons
Rank Occupation Rank Occupation
employed employed
1 Farmers and Farm Managers 40,297 1 Education Professionals 22,071
2 Specialist Managers 29,446 2 Numerical Clerks 21,652
3 Road and Rail Drivers 26,491 3 General Clerical Workers 18,172
Business, Human Resource and
4 20,640 4 Farmers and Farm Managers 16,750
Marketing Professionals
Hospitality, Retail and Service
5 17,473 5 Health Professionals 15,642
Managers
Design, Engineering, Science and
6 14,180 6 Carers and Aides 12,915
Transport Professionals
Hospitality, Retail and Service
7 Health Professionals 13,681 7 12,299
Managers
Business, Human Resource and
8 Other Labourers 13,649 8 10,701
Marketing Professionals
Automotive and Engineering Trades
9 13,366 9 Sales Assistants and Salespersons 10,025
Workers
10 Sales Representatives and Agents 13,238 10 Inquiry Clerks and Receptionists 9,991
Data source: ABS Labour Force
8 | RETHINKING RETIREMENT: THE IMPACT OF DEMOGRAPHIC CHANGE AND THE PANDEMIC ON RETIREMENT PLANNING IN THE 2020SAccommodating retirees and the frail
4 elderly
The number of Australians aged 65+ in 2021 is estimated to be 4.3 million, up
from 2.4 million at the turn of the 21st Century. This number has increased at
roughly 100,000 per year for the last decade (see graphic 5a).
The vast majority of this growth is shaped by cohort • 57,000 live in accommodation for the aged that
progression. In fact, in any single year over the age of is not self-contained which means that residents
65 the number of immigrants (mostly family reunion) share some facilities such as common living and
contributes less than one per cent to that cohort eating areas. This kind of facility accommodates 2
population (see graphic 5b). per cent of the 65+ population and appears to be
growing at a rate of 10,000 per year.
In other words, the demand for retiree accommodation
in any decade isn’t significantly affected by the rise or
fall in immigration in that year or even in that decade. The census suggests that just over one million
The impact of such change is more likely to be felt over (that is 1.009 million) Australians, or 27 per cent
the course of a generation. of all Australians aged 65+ at this time, lived in
some form of defined retirement accommodation.
The coming of COVID-19 may well negatively impact The vast majority lived in assisted living (640,000)
the demand for (young people’s) housing (that is, accommodation (requiring assistance with a core
fewer immigrants) in the 2020s, however within this activity), while a further 184,000 made the choice
timeframe it will only marginally impact demand for to live in self-contained accommodation within a
retirement accommodation. retirement village.
The 2016 Census shows the accommodation choices However, this still leaves 2.7 million or 73 per cent
made by older Australians (see graphic 6). Other who lived in private accommodation of some sort at
than private dwellings the most popular forms of this time.
accommodation for Australians aged 65+ at this time
were as follows: It may be said that up to the coming of COVID-19
three out of four Australians aged 65+ had chosen to
• 640,000 lived in assisted living accommodation remain in the family home or some kind of equivalent.
which equates to 17 per cent of the 65+ population.
However I suspect this reflects the young skew of 65+
This market appears to be growing at a rate of
population at the time of the last census. In 2016
20,000 per year based on intercensal calculations
Baby Boomers largely clustered in the 65-69 cohort
• 184,000 lived in a self-contained retirement village. and so were more likely to have been “in work” and
This equated to 5 per cent of the 65+ population. indeed “at home”, whereas progressively throughout
This market seems to be growing at a rate of about the 2020s as this cohort ages further into their 70s
10,000 per year other accommodation (and care) options are sure to
emerge.
• 128,000 live in nursing homes. This is about 4 per
cent of the 65+ population. There was very little
growth in the nursing home population between
the last two censuses. (Generally the modern
preference is for extended in-home care.)
9 | RETHINKING RETIREMENT: THE IMPACT OF DEMOGRAPHIC CHANGE AND THE PANDEMIC ON RETIREMENT PLANNING IN THE 2020SAccommodating retirees and the frail elderly
Graphic 5(a): Predictable increases: annual growth in 65+ population 2000-2030
Year 65+ Annual change (#) Annual change (%)
2000 2,364,260 42,634 1.8%
2001 2,419,070 54,810 2.3%
2002 2,465,669 46,599 1.9%
2003 2,511,327 45,658 1.9%
2004 2,558,857 47,530 1.9%
2005 2,611,879 53,022 2.1%
2006 2,664,064 52,185 2.0%
2007 2,736,610 72,546 2.7%
2008 2,805,167 68,557 2.5%
2009 2,890,566 85,399 3.0%
2010 2,986,675 96,109 3.3%
2011 3,087,911 101,236 3.4%
2012 3,213,853 125,942 4.1%
2013 3,330,378 116,525 3.6%
2014 3,442,148 111,770 3.4%
2015 3,554,304 112,156 3.3%
2016 3,672,251 117,947 3.3%
2017 3,790,842 118,591 3.2%
2018 3,912,975 122,133 3.2%
2019 4,038,131 125,156 3.2%
2020 4,145,275 107,144 2.7%
2021 4,271,505 126,230 3.0%
2022 4,397,463 125,958 2.9%
2023 4,526,677 129,214 2.9%
2024 4,656,293 129,616 2.9%
2025 4,788,483 132,190 2.8%
2026 4,925,741 137,258 2.9%
2027 5,059,231 133,490 2.7%
2028 5,188,776 129,545 2.6%
2029 5,310,524 121,748 2.3%
2030 5,415,563 105,039 2.0%
Data source: ABS Population Estimates and Projections
10 | RETHINKING RETIREMENT: THE IMPACT OF DEMOGRAPHIC CHANGE AND THE PANDEMIC ON RETIREMENT PLANNING IN THE 2020SAccommodating retirees and the frail elderly
Graphic 5(b): Recent older arrivals: Percentage population recent (last 12 months) immigrants by single
year of age over 65, 2016 Census
Data source: ABS Census, 2016
Graphic 6: Accommodating older Australians: 65+ population in retirement accommodation, 2011 & 2016
Accommodation Accommodation
Retirement Retirement
for the retired or for the retired or Nursing home Assisted living
Year 65+ population Nursing home Assisted living village (self- village (self-
aged (not self- aged (not self- (%) (%)
contained) contained) (%)
contained) contained) (%)
2011 3,012,281 46,763 1.6% 123,024 4.1% 537,281 17.8% 137,470 4.6%
2016 3,676,762 57,282 1.6% 127,896 3.5% 640,291 17.4% 184,236 5.0%
Change
664,481 10,519 0.0% 4,872 -0.6% 103,010 -0.4% 46,766 0.4%
2011-16
Data source: ABS Census, 2016
11 | RETHINKING RETIREMENT: THE IMPACT OF DEMOGRAPHIC CHANGE AND THE PANDEMIC ON RETIREMENT PLANNING IN THE 2020SImpact of the baby bust
5
The baby bust of the 2020s will be one of the three biggest demographic
issues impacting Australia in 80 years. The other two were women ‘returning to
the workforce’ in the 1970s and the baby boom of the 1950s. A baby bust is
said to follow a baby boom by 70 years: it occurs when more workers exit the
workforce at age 65 than enter the workforce at age 15. Australia has been on
a baby bust trajectory for decades.
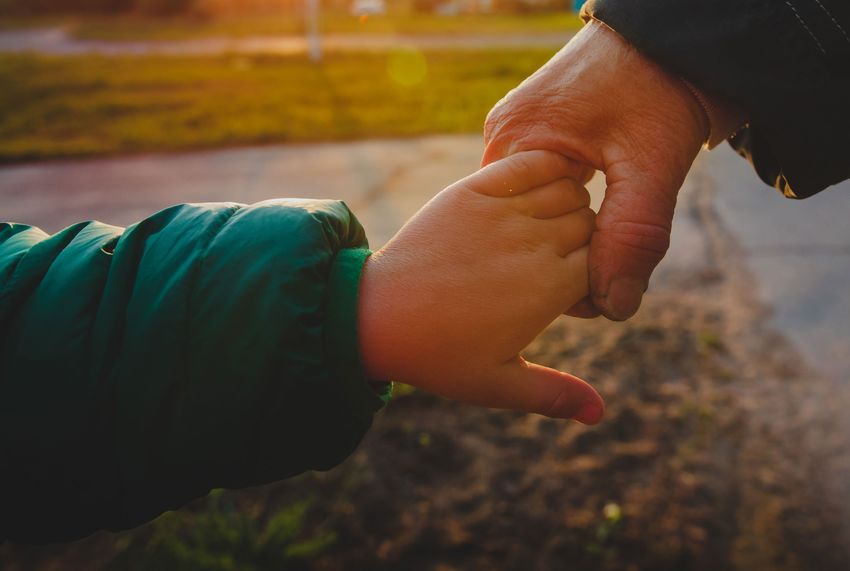
Indeed, demographers have been warning of a baby Net annual growth in the retirement (65+) population
bust for many years including Australian educated lifted from an average of 40,000 over the 40 years to
Canadian academic David K Foot who wrote a best- 2010 and rises to an average of 120,000 during the
selling book on the topic Boom, Bust & Echo (1996). early 2020s. Indeed, peak growth in the ‘retirement
The argument being that a post-war baby boom cohort’ is expected in 2026. The federal budget will
inevitably will lead to a baby bust in the 2020s. be stretched for another two election cycles before
pressure eases on the demand for retirement funding
The baby bust thesis is that the tax base of countries and services.
like Canada, the United States, Australia and others
expanded as a generation of Baby Boomers entered The problem is that the strong growth during the
the workforce in their early 20s (over 1966-1984) at a productive years (say, 1980-2020), when more
faster rate than 60-somethings exited the workforce. Baby Boomers poured into the productive taxpaying
stage of the lifecycle, is now being replaced by
The net effect of the baby boom was an increase in the weaker growth (say, 2020-2040) as boomers exit the
tax base in the late-20th and early-21st centuries as workforce and transition into their long retirement.
developed-world workforces swelled.
In simple terms the baby boom of the 1950s is being
The baby bust issue (in Australia at least) officially followed by a baby bust (and a pandemic) of the
starts from 2011 when the first Baby Boomer (born 2020s.
1946) turned 65. The so-called bust has continued as
boomers (born late 1940s) exited the workforce at a This demographic trajectory is partially offset
faster rate than Millennials (born mid-1980s to late- in Australia by a relatively high birth rate (for a
1990s) could enter the workforce in their early 20s. developed nation), by strong levels of overseas
immigration aimed at skilled youth, and by a program
As a consequence of the baby bust the rate of growth of importing guest workers.
in the workforce decelerates during the 2020s (see
graphic 7). The coming of COVID-19 is expected to block the
traditional avenues by which the effects of the baby
However, the baby bust in Australia was moderated bust are moderated.
by an uptick in international migration from the mid-
2000s onwards and which was largely focused on The great challenge for Australia, and for other
skilled migration and foreign student programs (see nations shaped by the post-war baby boom, is to
graphic 8). maintain service delivery to retirees including the Age
Pension and healthcare support despite a slowdown
Indeed, net annual growth in the working age (15-64) in workforce growth.
population had hovered around the 150,000-mark for
40 years prior to 2020, but over the following 40 years The alternative is to redefine community expectations
(based on pre-Covid projections) net annual growth in about the lifestyle that can be expected in retirement.
this cohort reduces to 100,000 or less (see graphic 9).
12 | RETHINKING RETIREMENT: THE IMPACT OF DEMOGRAPHIC CHANGE AND THE PANDEMIC ON RETIREMENT PLANNING IN THE 2020SImpact of the baby bust
Graphic 7: Step change in workforce: net annual growth in Australian population 15-64, 1966-2066
Data source: ABS Historic, Estimated and Projected population
Graphic 8. The longest boom: net overseas immigration to Australia, 1901-2024
Data source: ABS; Australian Federal Budget 2020; The Demographics Group
13 | RETHINKING RETIREMENT: THE IMPACT OF DEMOGRAPHIC CHANGE AND THE PANDEMIC ON RETIREMENT PLANNING IN THE 2020SImpact of the baby bust
Graphic 9. Boomer’s retirement mountain: net annual change in Australian population 65+, 1966-2066
Data source: ABS Historic, Estimated and Projected population
14 | RETHINKING RETIREMENT: THE IMPACT OF DEMOGRAPHIC CHANGE AND THE PANDEMIC ON RETIREMENT PLANNING IN THE 2020SOutlook for retiree personas
6
There are structural factors that shape planning for retirement including
the capacity of the nation to support a retirement cohort and community
expectations about the quality of life expected in retirement.
Add to this the effects of the pandemic (including always managed and they’ll “get by” in retirement
the drawdown on superannuation), the prospects with a bit of super and the pension.
of diminished immigration, the changing ethnicity • Meet first-wave Baby Boomers David & Linda both
and culture of Australian society, and the outlook for in their late 60s who sold their family home and
retirement can vary from different perspectives. business in Queensland’s Roma and “did a bit of
a seachange” by retiring to Brisbane’s Cleveland
We have developed five “personas” to consider
a few years ago. They shuttle between Cleveland
how retirement might be reimagined from different
and their kids interstate, visiting grandkids, and
perspectives in 2021 (see graphic 10). pursuing their hobbies and interests. They are
concerned that the value of their nest egg, and the
• Meet young professional couple Matt & Natasha,
quality of their retirement, could be whittled away
Millennials in their mid-30s currently renting in
by constant changes to benefits and concessions.
the inner suburbs of Sydney. They have one child
and would like another. They need a family home • Meet Franco & Maria, both in their early 70s living
not too far from their city workplaces. They have in the family home in Adelaide. Franco is a semi-
drawn down on their super balances and are retired accountant. Maria says he’ll never stop
looking to buy a family home. They argue they need working. Franco is determined that his kids and
a house now not superannuation later. They see grandkids will be left a legacy. He is concerned
“home ownership” as a more important part of that the rules around which he has developed his
achieving financial independence than investing in retirement plan could be changed. Franco wants
superannuation that may benefit their lifestyle in 30 everything to remain just as it is today.
years.
• Meet middle-aged Michelle a recently divorced The five personas must plan for retirement lifestyles
mother of two (aged 17 & 19) living in Melbourne’s that range from the here and now and 30 years into
Burwood. Michelle is a contractor with the Victorian the future.
Government and is concerned about job security
Those currently in retirement (David & Linda and
going forward. She still has a mortgage and
Franco & Maria) are concerned about sovereign
doesn’t feel she has enough in superannuation. The
risk, about the possibility of change to existing
pandemic has shaken her self-confidence; she is
arrangements.
concerned that if she loses her job she may not get
another job at the same level (she’s thinks the world
Michelle is fearful about the uncertainty of the future
has “moved on”); she wants reassurance about the
and about the demand for her skillset. The pandemic
quality of life that awaits her in retirement (in 2035).
has unsettled her sense of security.
• Meet Aussie battlers Justin & Jennifer both in
their mid-50s with three adult kids living nearby Like Michelle, Justin & Jennifer are also looking at
in Melbourne’s western suburbs. Justin works at a retirement next decade, but they have a much more
warehouse while Jennifer works at a supermarket. relaxed attitude towards the future. Maybe they’re
They still have a mortgage on their family home. too relaxed?
They want to retire at 65, which means 2030. They
have a modest super balance, but they also have a Young Matt & Natasha have relegated retirement
strong “she’ll be right” attitude. They say they have planning to a low priority in their lives.
15 | RETHINKING RETIREMENT: THE IMPACT OF DEMOGRAPHIC CHANGE AND THE PANDEMIC ON RETIREMENT PLANNING IN THE 2020SOutlook for retiree personas
Graphic 10: Five personas rethinking retirement during 2021
Five personas showcase the super realities of Middle Australia
Matt (37) & Michelle (52) Justin (56) & David (69) & Franco (72) &
Natasha (33) Jennifer (55) Linda (66) Maria (70)
Both engineers by Divorced, two kids Their three adult kids Born in 1951 & 1954 Franco is a semi-
training (17 & 19) at home live nearby Sold their business retired accountant
Born 1983 & 1987 Contractor at VIC He works at a and sea-changed Maria was a
Retirement planned State Government warehouse, she at Retired from farming homemaker
for early 2050s Born 1968 the local supermarket a few years ago 2 adult children and 4
Likely retirement at Born 1964 & 1965 Bought a 3 BR house grandkids
Renting 2 BR 67 in 2035 Plan to retire as early in Cleveland Qld Norwood, Adelaide,
apartment in Surry as possible Adult kids live in SA
Hills NSW but are 3 BR house with Renters in 3 BR Brisbane, Melbourne Still live in the 4 BR
looking to buy a mortgage in Burwood house in Hoppers & Sydney family home
family home Covid has prompted Crossing David fishes, Linda Maria active in church
her to rethink her Proud first-time volunteers community
situation including grandparents
super arrangements Care for parents
She’s more engaged
in the process
Data source: The Demographics Group
16 | RETHINKING RETIREMENT: THE IMPACT OF DEMOGRAPHIC CHANGE AND THE PANDEMIC ON RETIREMENT PLANNING IN THE 2020SSummary points
7
This report considers how retirement planning might be reimagined during the
2020s from the perspective of 2021 following the coming of COVID-19 and as
Baby Boomers press more fully into the retirement years. The main findings are
as follows:
1. Life expectancy rising: Life expectancy is extending 4. 84,000+ additional ‘older workers’ by 2030: The
the post work stage of the lifecycle otherwise proportion of the workforce comprised of workers
known as ‘retirement’. It is only in the post-war era aged 65+ was 4.8 per cent or 616,000 workers
that the Australian life expectancy has exceeded 65 in November 2020. The number of Australians
(the year at which men have been eligible for the aged 65+ will lift from 4.1 million in 2020 to 5.4
Age Pension since it was introduced in 1911). Prior million in 2030. It is possible if not likely that the
to WWII most Australians died in their early 60s. proportion of the workforce comprised by the 65+
Retirement planning let alone retirement funding cohort will lift over the coming decade to, say,
is an issue that has gathered momentum as the five per cent (if not more). This share of a 2030
Australian lifespan has expanded. workforce of, say, 14 million equates to 700,000
workers aged 65+ which is an extra 84,000 ‘older
workers’ than was the measured in November
2. Retiree population rising: The 2020s was always
2020.
going to be a period of intense pressure on
retirement funding due to the effects of the
so-called baby bust. The baby boom of the 5. More retirement accommodation required: The
1950s converts into a baby bust in the 2020s as 2016 census shows that 73 per cent of the
Baby Boomers exit the workforce. Without an population aged 65+ lives in some form of private
offsetting boost to births or a program of youthful accommodation. The remaining 27 per cent live in
immigration, the rate of growth in the tax base various forms of retirement housing or in assisted
subsides (with the baby bust) placing pressure care or assisted living arrangements. The most
on the national capacity to maintain retirement common non-private accommodation is assisted
concessions and support. The number of Australians living (17 percentage points) followed by those
aged 65+ will continue to rise every year to 2026 who live independently within a retirement village
before subsiding. (5 percentage points) and the remainder being
cared for in a nursing home (4 percentage points).
A 27-per-cent share of the 2020 population aged
3. Work-on Baby-Boomers rising: The coming of
65+ equates to 1.1 million; the same share applied
COVID-19 has increased the national debt, reduced
to the 2030 population aged 65+ equates to 1.5
the superannuation savings of many, threatened (if
million. During the 2020s underlying demographic
not eliminated) businesses in hospitality and tourism,
change can be expected to lift demand for
and changed many aspects of consumer behaviour
‘retirement accommodation’ (as defined in the
(such as greater focus on security; more comfortable
census) by an average of 40,000 residents per year.
with technology). The pandemic has also changed
the way we work and triggered a realignment of
trade arrangements and alliances. It has stopped
overseas immigration and has severely dented the
international education industry. It is likely that
skilled labour will be in even greater demand in the
2020s prompting many Baby Boomers to remain in
the workforce.
17 | RETHINKING RETIREMENT: THE IMPACT OF DEMOGRAPHIC CHANGE AND THE PANDEMIC ON RETIREMENT PLANNING IN THE 2020SSummary points
6. Retirement planning must navigate priorities and 7. Forget the Fokkers, meet the WOBBLES: Finally,
risk: Consideration of how retirement planning this work has thrown up a new lifeform that is
might be reimagined during the 2020s from the sure to gather momentum during the 2020s: this
perspective of five “personas” shows a number of refers to the rise of the Work-on Baby Boomer
consistent themes. Those within retirement are likely Looking for Extra Savings otherwise known as
to be most concerned about retaining existing rules the WOBBLES. There are two factors driving the
and concessions. Those approaching retirement are WOBBLES: (a) the rise of tertiary-educated Baby
likely to be concerned about job security and having Boomers from the mid-1970s now pushing into
sufficient funds although others can be disengaged retirement and keen to boost super balances by
taking a “she’ll be right” approach. Young working on; and (b) the impact of COVID-19 in
Australians not looking to retire for three decades stymieing the inflow of skilled workers (including
or more could well question the rationale of the foreign students) from 2020 onwards leading to
entire superannuation system. Indeed, rethinking heightened demand for older knowledge workers
retirement in the 2020s very much depends on the to ‘work on’. The 2020s could well be the decade
vantage point of those doing the rethinking. of the WOBBLES.
18 | RETHINKING RETIREMENT: THE IMPACT OF DEMOGRAPHIC CHANGE AND THE PANDEMIC ON RETIREMENT PLANNING IN THE 2020SYou can also read