REVIEW & French Property Markets - Knight Frank
←
→
Page content transcription
If your browser does not render page correctly, please read the page content below

2020-2021

REVIEW &
OUTLOOK
French Property Markets

1           2          3

INVESTMENT   OFFICES   R E TA I L

2020 REVIEW
AND 2021 OUTLOOK

INVESTMENT

1   2   3
INVESTMENT

            WHAT WE SAID A YEAR AGO
            WHAT ACTUALLY HAPPENED
            RESILIENCE OF THE FRENCH INVESTMENT MARKET
            LESSER ROLE OF VERY LARGE TRANSACTIONS
            THE GREATER PARIS REGION LOSES SOME OF ITS SHINE
            RESPECTABLE PERFORMANCE FOR THE REGIONS
            OFFICES HOLD ONTO THEIR SHARE
            OFFICES: SEVERAL MARKETS ARE HOLDING UP
            OPPORTUNITIES TO BE SEIZED
            TYPES OF INVESTORS: UNCHANGED HIERARCHY
            FOREIGNERS: LESS PRESENT, BUT STILL ACTIVE
            GERMANS TAKE CENTRE STAGE
            RETAIL: AT A CROSSROADS
            SHOPPING CENTRES: INCREASE IS MISLEADING
            HIGH STREETS: STILL ON TOP, BUT...
            LOCAL AND FOOD SHOPS ARE VERY POPULAR
            LOGISTICS: STILL VERY MUCH IN DEMAND
            STRONG COMEBACK OF RESIDENTIAL
            YIELDS: CONTINUED PRESSURE
            THE OUTLOOK FOR 2021…AND BEYOND

1   2   3
KNIGH T FR A NK 2020 REVIEW AND 2021 O UT LO O K                                                                             INV ESTM E N T

                                                                 WHAT WE SAID A YEAR AGO

               ECONOMIC SITUATION: STILL UNCERTAIN
               • Economic slowdown
               • Risks still numerous (Brexit, elections in the USA, social tensions in France, etc.)

               SUPPORT FOR ACTIVITY
               •   Growing interest in the future hubs of the Grand Paris Express and in regional cities
               •   Interest rates: durably low
               •   Dynamism of international capital flows
               •   Raising of funds: from record to record?
               •   Investors' search for diversification

               QUESTIONS
               •   Continued decrease of prime yields?
               •   Shortage of office space: what will the impact be on sums invested and investors' acquisition criteria?
               •   Will investors take more risk?
               •   Confirmation of renewed interest in retail?

       1   2        3
                                                                                                                                              5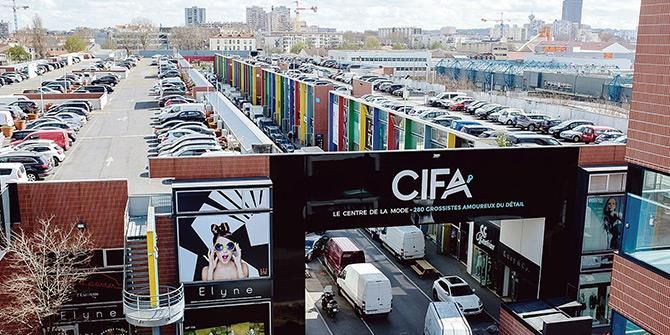
KNIGH T FR A NK 2020 REVIEW AND 2021 O UT LO O K                                                                                                INV ESTM E N T

                                                              WHAT ACTUALLY HAPPENED

               ECONOMIC SITUATION: EVEN MORE UNCERTAIN
               • Covid-19: one of the worst crises in recent history
               • Global economic recession
               • Risks still numerous (social tensions in France and around the world, new outbreaks of diseases, etc.)

               FEWER SUPPORTS
               •   Continued interest in the future hubs of the Grand Paris Express and in regional cities
               •   Interest rates: durably low
               •   Dynamism of international capital flows but some investors are less present
               •   Fund-raising slowed down by the crisis
               •   Increased investors' search for diversification

               QUESTIONS
               •   Continued decrease of prime yields in the logistics sector
               •   Continued competition for the best assets, keeping pressure on prime yields
               •   Will investors take more risk? Increased selectivity of investors... but some are seizing opportunities for value creation
               •   Decrease in retail volumes after an excellent year in 2019

       1   2        3
                                                                                                                                                                 6
KNIGH T FR A NK 2020 REVIEW AND 2021 O UT LO O K                                                                                                                                           INV ESTM E N T

                                   RESILIENCE OF THE FRENCH INVESTMENT MARKET
   Prior to 2020, the French commercial property market remained                has broken this momentum, but has not stopped activity. With        performance of 2019, but are still slightly higher by 8% than
   on a six-year upward trend, which peaked in 2019 with an                     25.2 billion invested in 2020, investment volumes in France         the ten-year average.
   investment volume of almost €40 billion. The Covid-19 epidemic               have therefore dropped by 33% compared with the record

   Above the ten-year average                                                                                                         Change in investment volumes year-on-year
   Change in investment volumes in France,
   All asset types (offices, retail, industrial), in billions of euros

                                                                                     €37.6

                                                            2015-2019                                                                                            Europe
                                                             €29.7 billion/year
                                                                                          €25.2
                                                                                                                                   USA                        -29%
                                                                                                                               -34%
                           2010-2019
                           €23.2 billion/year                                                                                                                                                 Asia Pacific
                                                                                                                                                                                              -29%
                                                                                                                                                  Global
                                                                                                                                               - 39%
    2007 2008       2009 2010 2011 2012      2013 2014 2015 2016 2017 2018 2019 2020
                               Amounts invested in France          10-year average     5-year average
  Source: Knight Frank                                                                                                                                                             Sources: RCA / Knight Frank

         1      2      3
                                                                                                                                                                                                                    7
KNIGH T FR A NK 2020 REVIEW AND 2021 O UT LO O K                                                                                                                     INV ESTM E N T

                                      LESSER ROLE OF VERY LARGE TRANSACTIONS
 In 2019, the dynamism of large transactions directly contributed to the   Partially mitigated by the year-end signing by SWISS LIFE to buy the
 exceptional performance of the French market. In 2020, there were         future ENGIE campus at La Garenne-Colombes, the decrease was
 fewer such transactions: 66 transactions over €100 million and
 totalling €15.1 billion were recorded in France, compared with 88
                                                                           particularly significant in the largest transactions category
                                                                           (those in excess of €500 million). Similarly, portfolio sales played a
                                                                                                                                                    700
                                                                                                                                                    transactions
 totalling almost €24 billion in 2019.                                     less decisive role, accounting for 19% of volumes invested in France
                                                                                                                                                    (920 in 2019)
                                                                           in 2020 compared with 24% a year earlier.

 A slightly more balanced market
                                                                                                                                                    27 > €200 M
 Breakdown of investment volumes in France by amount category                                                                                       (37 in 2019)
                                                                                                                                                    =
       100%

                                         22%
                                                                                                                                                    €9.5 B
                                                                                                   27%                                              (16.8 in 2019)
        80%
                                          15%                                                                                                       =
                                                                                                   13%
        60%
                                          18%                                                                                                       38%
                                                                                                   22%                                              of volumes
        40%
                                                                                                                                                    (45 % in 2019)
                                         45%
        20%                                                                                        38%                                              19%
         0%
                                                                                                                                                    Share of investment
                                           2019                                                     2020                                            volumes in
                           More than €200 M              €100 - 200 M           €50 - 100 M              Less than €50 M
                                                                                                                                                    portfolios
   Source: Knight Frank                                                                                                                             (24 % in 2019)

         1     2     3
                                                                                                                                                                                      8
KNIGH T FR A NK 2020 REVIEW AND 2021 O UT LO O K                                                                                                                                     INV ESTM E N T

                          THE GREATER PARIS REGION LOSES SOME OF ITS SHINE
   The Greater Paris Region,        Return to less extraordinary levels
   which usually accounts for the   Change in investment volumes in the Greater Paris Region, all asset types
   vast majority of transactions    In billions of euros
   in excess of €100 million, has
                                     € 30                                                                                                                                                        80%
   logically suffered a greater
   drop in activity than the
   regional markets.
                                                                                                                                                2015 – 2019                                      78%

   Consequently, 18.2 billion
                                     € 25                                                                                                    €22.3 billion/year              75%
   euros were invested in the                                                                                                                                                                    76%
   Greater Paris Region in                                                                2010 – 2019
                                     € 20
   2020, a 36% decrease year-                                                          €17.4 billion/year                                                                                        74%
   on-year compared with -24%
   in the regions.                   € 15
                                                                                                                                                               73%
                                                                                                                                                                                                 72%

                                                                                                                                                                                      72%
                                                                                                                                                                                                 70%
                                     € 10

                                                                                                                                                                                                 68%

                                                                                                                                                                            €28.30

                                                                                                                                                                                        €18.20
                                                                                                                                                                 €22.10
                                      €5
                                                                                                                                                                                                 66%

                                      €0                                                                                                                                                         64%
                                             2007       2008      2009       2010       2011       2012         2013   2014     2015       2016       2017       2018       2019        2020

                                                               Investment volumes in the Greater Paris Region            5-year average
   Source: Knight Frank                                        10-year average                                           Greater Paris Region share in French investment volumes

         1     2     3
                                                                                                                                                                                                       9
KNIGH T FR A NK 2020 REVIEW AND 2021 O UT LO O K                                                                                                                                INV ESTM E N T

                                  RESPECTABLE PERFORMANCE FOR THE REGIONS

Lyon achieves its 2nd best year ever                           With a decrease of 24% compared with 2019, the regional               Investment volumes remain much lower in the other regions
Change in investment volumes in the regions, all asset types   markets record a more limited correction than the Greater             of France, with a reduced number of large transactions and a
In billions of euros                                           Paris Region. The Rhône-Alpes region remains the most                 lesser presence of foreign investors, even if a few large
                                                               sought-after: almost €1.7 billion was invested there in 2020, a       transactions of offices or retail properties have been recorded
                                                               volume that has fallen over the year but which is still the           in cities such as Lille, Marseille or Toulouse.
                                                               second best performance in its history.

                                                                                                             Breakdown of investment volumes by asset type
                                                                                                                       Rhône-Alpes region, in 2020

                                                                                            24%                                                                     24%
                                                                          Offices
                                                                                                                                 2020 vs 2019
                                                                          Retail                                 57%                                                                  58%
                                                                                          19%                                                                     18%
                                                                          Industrial

                                                                                                                                                                                   Source: Knight Frank

          1    2    3                                                                                                                                                                                     10
KNIGH T FR A NK 2020 REVIEW AND 2021 O UT LO O K INV ESTM E N T
OFFICES HOLD ONTO THEIR SHARE
In 2019, offices smashed their record, with €26.2 billion As a result, volumes fell sharply by 34% last year: 17.4
invested in France. In 2020, this market sector was billion euros were invested in this asset type, representing
particularly impacted by the health crisis, which exacerbated 69% of the entire French market. Despite this decrease, the Breakdown of investment volumes in France,
investors' caution due to the deterioration of the lettings share of office space is almost the same as the previous year, by asset type
market and questions related to the boom in remote working. and is even slightly higher than its ten-year average.
100%
End of the upward cycle 10% 14% 14%
90%
Change in investment volumes in offices in France, in billions of euros
80% 22% 16% 17%
Regions Greater Paris Region 70%
60%
50%
40%
68% 70% 69%
30%
20%
10%
0%
10-year average 2019 2020
Offices Retail Industrial
Source: Knight Frank
1 2 3
11KNIGH T FR A NK 2020 REVIEW AND 2021 O UT LO O K INV ESTM E N T
EXAMPLES OF OFFICE TRANSACTIONS IN 2020
Swiss Life | Harmony, La Garenne-Colombes Allianz | CityLights (1 & 3), Boulogne-Billancourt DTZ Investors | Aquarel, Issy-les-Moulineaux La Française REP | 173-175 bd Haussmann, Paris 8
Ivanhoé Cambridge | Joya, Fontenay-sous-Bois Primonial | M Campus, Meudon La Française REM | 55 bd Charles de Gaulle, Malakoff Amundi | #Curve, Saint-Denis
Source: Knight Frank
1 2 3
12KNIGH T FR A NK 2020 REVIEW AND 2021 O UT LO O K INV ESTM E N T
OFFICES:
SEVERAL MARKETS HOLDING UP Paris CBD
Inner Suburbs
€5.32
Paris is about average
La Défense
Office investment volumes by geographical
€3.48
sector, in billions of euros
€3.56 €3.49 €3.54 €2.86
While the decrease in volumes concerned almost all the office sectors, the
€2.13
only exception was the Southern Loop, with a net increase of 50% year-
on-year as a result of 7 transactions worth over €100 million, involving assets Western
that were secured or due to be upgraded, such as "Espace Lumière", recently Crescent €1.87
Paris non CBD
acquired by TISHMAN SPEYER.
€5.99
Other sectors recorded a limited decrease in volumes. This is the case
of the Inner Northern Suburbs, with a 7% drop year-on-year but a 22% €4.24
increase compared to the ten-year average. In Paris, activity also
€4.58 €3.69
slowed, even if the completion in the 4th quarter of some large
transactions, such as the sale by INVESCO of 173-175 boulevard Outer €2.48
Haussmann, limited the decrease in investment volumes (-13% year-on-
€3.23 Suburbs
year, all Parisian sectors included).
€1.70
Record investment over the decade
€0.78
2020
10-year average €0.32
1 2 3 Source: Knight Frank 13KNIGH T FR A NK 2020 REVIEW AND 2021 O UT LO O K INV ESTM E N T
OPPORTUNITIES TO BE SEIZED
A decrease in core, reflecting the lack of products
Breakdown of investment volumes in offices by risk type in the Greater Paris Region
Transactions ≥ €20M
11%
Investor caution has increased as a result of the health
16% Core
crisis, explaining the appetite for quality assets Including pre-let forward funding sales
1%
52%
secured by long leases. As in 2019, however, activity
Core Plus
was hampered by the limited number of core
properties available for sale. The latter accounted for
59% of office investment volumes in the Greater Paris 16% Including partially let forward funding sales
Region, a slight decrease compared with the previous Value Added / speculative
year (63%). 2019
4% Including speculative forward funding sales
15%
Some players are willing to take more risk due to
the readjustment of values or strong fundamentals
12%
44%
in some markets. In Paris, for example, vacancy
rates are much lower than in most other Greater Paris
Region office hubs, and a significant proportion of
projects under construction are pre-let, enabling
investors to plan more comfortably for the future and
to embark on major value creation projects. For
example, TISHMAN SPEYER recently acquired the
21%
"Carré Saint-Germain" in Paris' 6th district, and the
"Tour Cristal" in the 15th district.
2020 8% Source: Knight Frank
1 2 3
14KNIGH T FR A NK 2020 REVIEW AND 2021 O UT LO O K INV ESTM E N T
TYPES OF INVESTORS: HIERARCHY UNCHANGED
Although sums invested and fund-raising fell sharply from France in 2020, after 24% in 2019 and 19% in 2018. Leading French insurers (CNP, UNOFI, COVEA, etc.) have
one year to the next, SCPIs and OPCIs were very active, Nevertheless, investment funds remain the leading players also stood out by completing large transactions in the
accounting for 26% of total investment volumes in in the market (33%). office and retail market.
€13.9
Funds still in the lead, but SCPI/OPCIs and insurers are narrowing the gap
Investment volumes in France by investor type
All asset types, in billions of euros
€8.9
€8.3
€6.6 €7.2
€6.2
€2.9 €1.4 €2.1
€1.1 €1 €1.2 €1.9
Funds Property companies SCPI/OPCIs Private Insurance Sovereign funds Others
investors companies
Source: Knight Frank
2019 2020
1 2 3
15KNIGH T FR A NK 2020 REVIEW AND 2021 O UT LO O K INV ESTM E N T
FOREIGNERS: LESS PRESENT, BUT STILL ACTIVE
The French market remained the target of many foreign It should be remembered that South Koreans accounted for The French, for their part, have increased their dominance,
players in 2020. The latter accounted for a significant nearly 10% of the volumes invested in 2019, whereas they with a share of 59% compared to 56% in 2019.
proportion of the sums committed in France, even if their were virtually absent in 2020. Other nationalities, by
share decreased (41% compared with 44% in 2019) due, in contrast, were at the origin of several major transactions,
particular, to the withdrawal of Asian investors, who were like the Americans in the logistics and office sector, or
directly impacted by travel restrictions. the Germans who are still fond of secure assets.
Breakdown of investment volumes by nationality
The French increase their dominance slightly Out of the total volume invested in France, all asset types
Change in the share of French and foreign investors
Out of the total volume invested in France, all asset types 8%
10%
2019 2020 56%
59%
100%
90% Outside € zone
13%
12% 13%
80% 8% 13%
70%
60%
61% 56% 59% French 3%
Europeans (€)
50% North Americans
Asia / Middle East
40%
30%
20%
10%
39% 44% 41%
2% 3%
0%
10-year average 2019 2020
Others
Share of foreign investors Share of French investors
Source: Knight Frank
1 2 3
16KNIGH T FR A NK 2020 REVIEW AND 2021 O UT LO O K INV ESTM E N T
GERMANS TAKE CENTRE STAGE
German investors are a historical player in the 2019. While Greater Paris Region offices remain
French investment market, and in 2020 they a prime target, the Germans significantly
achieved their highest level of investment increased their allocations to the logistics 2020 10-year average
volume since 2007. German investors acquired sector, with several large transactions including
Asset type
more than €2.6 billion of assets in France last the recent purchase by REAL IS of a logistics
55% 67%
year, a sharp increase of 51% compared with portfolio near Orleans.
Offices
Volumes at their highest level since 2010
Volumes invested by Germans in France
All asset types, in billions of euros
Retail
17% 26%
Industrial
28% 7%
Geographic
sector
Paris
44% 44%
Greater Paris Region 29% 34%
Regions 27% 22%
Source: Knight Frank
1 2 3
17KNIGH T FR A NK 2020 REVIEW AND 2021 O UT LO O K INV ESTM E N T
RETAIL: AT A CROSSROADS
Volumes invested in the French retail market totalled almost the ADEO portfolio and the sale of 54.2% of the shares in a of certain retail assets. As a result, investment suffered from a
€4.3 billion in 2020, down 29% year-on-year and 12% shopping centre portfolio belonging to UNIBAIL-RODAMCO- shallower market, due to the smaller number of potential
compared with the ten-year average. This decrease was due to WESTFIELD - accounted for almost a third of the total amount buyers and tighter financing conditions. Faced with a lack of
the sharp drop in the total number of transactions, which was invested in retail. Although investors were already cautious visibility and less favourable negotiating conditions for sellers,
offset by the completion of nine transactions in excess of €100 before the health crisis, it has accelerated the ongoing large offers were also withdrawn from the market.
million. Two of these - the sale to BATIPART and COVEA of transformations and exacerbated the questions about the future
Relatively stable share
Change in retail investment volumes in France
In billions of euros, all retail formats included
-29%
Year-on-year
-12%
10-year average
Source: Knight Frank
Source: Knight Frank
1 2 3
18KNIGH T FR A NK 2020 REVIEW AND 2021 O UT LO O K INV ESTM E N T
EXAMPLES OF RETAIL TRANSACTIONS IN 2020
Crédit Agricole Assurances / La Française | URW Batipart / Covéa | ADEO portfolio, France BMO REP | 71-73 av. des Champs-Élysées, Paris 8 Invesco RE | 6-12 rue du Faubourg St-Honoré, Paris 8
portfolio, France
Mata Capital | CIFA, Aubervilliers Tishman Speyer / PSP | Carré Saint Germain, Paris 6 AEW Ciloger | Portfolio of 4 Monoprix shops, France Unofi | Printemps, Lille
Source: Knight Frank
1 2 3
19KNIGH T FR A NK 2020 REVIEW AND 2021 O UT LO O K INV ESTM E N T
SHOPPING CENTRES: INCREASE IS MISLEADING
The shopping centre sector was driven exclusively by some specialist investors for properties in need of assets in the regions. Sales have been rarer in the retail park
acquisitions from French investors, with volumes up 18% year- repositioning. For example, SOCIETE DES GRANDS market. Despite relatively low volumes, this market sector will
on-year due to the disposal of the URW portfolio. Other centres MAGASINS bought the "SQY Ouest" centre in Montigny-le- continue to be closely watched by investors in the coming
were sold, but for smaller amounts, confirming the interest of Bretonneux from HAMMERSON, as well as a portfolio of eight months due to being well adapted to the consequences of the
health crisis and to consumer expectations.
No upheaval The leading role of portfolios
Retail investment volumes in France Share of volumes in portfolios
Breakdown by asset type Out of all retail investment volumes in France
6% 8%
2020 2019
14%
35% 20% 35%
14%
18% 12%
44%
55%
52% 45%
41%
10-year average 2019 2020
High Street Retail parks Shopping centres Others* Share of portfolios
Source: Knight Frank *Outlet centres, hypermarkets and supermarkets, non-divisible portfolios
1 2 3
20KNIGH T FR A NK 2020 REVIEW AND 2021 O UT LO O K INV ESTM E N T
HIGH STREETS: STILL ON TOP, BUT…
The greatest drop was in the high street retail
Less exceptional year for high streets
sector. The sums invested there fell by 37%
High street investment volumes in France, in billions of euros
compared to 2019, in a context that is currently
unfavourable to prime streets as a result of the
sharp decrease in the number of foreign tourists. At
the end of the year, however, the sale of two large € 3.50 70%
mixed-use Parisian assets - 71-73 avenue des TRANSACTIONS
Champs-Élysées bought, by BMO REP, and 6-12 € 3.00 60% > €100 M
rue du Faubourg Saint-Honoré bought by
INVESCO - helped boost volumes. These
transactions also demonstrated the confidence of
major international investors in the long-term
€ 2.50
€ 2.00
50%
40%
7
appeal of the Paris market. In 2019
€ 1.50 30%
Outside of Paris, the largest sale of a single
asset was completed in Lille, with the sale to € 1.00 20%
6
UNOFI of the PRINTEMPS on rue Nationale for
almost €100 million. € 0.50
€ 3.11
€ 1.95
10%
€ 0.00 0%
In 2020
2010 2011 2012 2013 2014 2015 2016 2017 2018 2019 2020
Investment volumes - High streets
Share of high streets (%) in total retail investment volumes
Source: Knight Frank
1 2 3
21KNIGH T FR A NK 2020 REVIEW AND 2021 O UT LO O K INV ESTM E N T
CONVENIENCE AND FOOD SHOPS ARE VERY POPULAR
Highly sought-after in recent years, local Covid-19 pandemic. Following those have thus boosted the French market in
shops have also enjoyed increased undertaken in 2018 and 2019, new 2020, bringing the retail chain's total AMOUNT OF THE CASINO
interest since the outbreak of the CASINO and MONOPRIX shop sales asset sales over the past five years to GROUP'S ASSET SALES
more than €3 billion. OVER THE PAST 5 YEARS IN FRANCE
Total, all asset types combined
Market enthusiasm
Change in food shops investment volumes in France, in millions of euros
All retail formats included
€ 1,200 30%
€ 1,000 25% €3.2
€ 800 20%
B
€ 600 15%
€ 400 10%
€ 200 5%
€0 0%
2009 2010 2011 2012 2013 2014 2015 2016 2017 2018 2019 2020
Amounts invested – food shops Share of food in total retail investment volumes (%)
Source: Knight Frank
1 2 3
22KNIGH T FR A NK 2020 REVIEW AND 2021 O UT LO O K INV ESTM E N T
LOGISTICS: STILL VERY MUCH IN DEMAND
With almost €3.5 billion invested, investment volumes in the from an exceptional sale: the sale of the CARREFOUR portfolio number of large transactions: 8 transactions in excess of
industrial premises market in 2020 fell by 35% year-on- to ARGAN for almost €900 million. In the light of the impact of €100 million were recorded, compared with 10 in 2019. The
year, but needs to be put into perspective given the record level the health crisis, the 2020 result is more than respectable. It is large transactions in 2020 exclusively involved logistics assets,
recorded in 2019 (€5.4 billion), which benefited in particular 116% higher than the ten-year average and is based on a high most of which were sold to North American, British or German
funds.
A very respectable result 9%
Change in industrial investment volumes
In France, in billions of euros 4% 15%
Volumes invested in
logistics by nationality 24%
In France, in 2020
31%
17%
France € zone
Europe outside € zone North America
Asia/Middle East Others
Source: Knight Frank
1 2 3
23KNIGH T FR A NK 2020 REVIEW AND 2021 O UT LO O K INV ESTM E N T
STRONG COMEBACK OF RESIDENTIAL
With uncertainty at an all-time high, the heralds an acceleration of the
health crisis will have a lasting impact on diversification strategies already Investors accelerate their diversification strategy
Breakdown of property investment volumes by type in Europe
allocation strategies, raising investors' implemented in recent years in favour of
awareness of the need to focus on logistics and, above all, residential
adaptation to new uses and the reversibility properties (traditional or managed), 2020
of buildings. Furthermore, investors will whose share of total investment volumes is
increasingly target those assets that are growing steadily in Europe.
assumed to be the most resilient. This trend 4% 3%
14% 7% 1%
9% Offices
40% 41%
Retail
Residential
16% 2015 Industrial
Hotel trade
Hotel
Healthcare
Health
23%
27%
15%
RESIDENTIAL CLINICS / EPHAD* DATA CENTRE
*Residential facility
for dependent elderly persons Source: RCA / Knight Frank
1 2 3
24KNIGH T FR A NK 2020 REVIEW AND 2021 O UT LO O K INV ESTM E N T
YIELDS: CONTINUED PRESSURE
In 2020, the correction of prime yields Change in prime yields 2009-2020 change
was relatively limited and mainly seen
in the retail sector. In the logistics
sector, strong competition from 10.00%
investors and a lack of prime supply LOGISTICS
even led to a further compression
of yields, which fell below the
8.00% - -48%
symbolic threshold of 4.00%.
6.00%
In 2021, investors will remain very
HIGH STREET
selective, favouring the most
established geographical sectors 4.00% 3.90% -37%
and assets offering stable and
3.00%
secure rental income, which will 2.75%
sustain pressure on prime yields. In 2.00%
the Paris office market, prime yields
OFFICES
could consequently remain below
3.00%. 0.00%
-0.34% - -50%
-2.00%
2000
2001
2002
2003
2004
2005
2006
2007
2008
2009
2010
2011
2012
2013
2014
2015
2016
2017
2018
2019
2020
Offices (Paris CBD) High street (Paris)
Logistics (Greater Paris Region) 10-year OAT rate
Source: Knight Frank
1 2 3
25KNIGH T FR A NK 2020 REVIEW AND 2021 O UT LO O K INV ESTM E N T
THE OUTLOOK FOR 2021…
AND BEYOND
• LIMITED ACTIVITY IN THE 1ST HALF OF 2021
• WAIT-AND-SEE APPROACH BY INVESTORS
• DISCREPANCY BETWEEN THE EXPECTATIONS OF SELLERS AND BUYERS
• LACK OF CORE PRODUCTS AND DIVERSIFICATION ASSETS
• FUND-RAISING COULD DECREASE... BUT LIQUIDITY REMAINS HIGH
• NO OR VERY FEW FORCED SALES
• EVER INCREASING ATTENTION PAID TO ENVIRONMENTAL AND SOCIAL ISSUES (ESG)
1 2 3
262020 REVIEW AND 2021 OUTLOOK OFFICES 1 2 3
OFFICES
            WHAT WE SAID A YEAR AGO
            WHAT ACTUALLY HAPPENED
            AT IT LOWEST LEVEL FOR 20 YEARS
            LARGE TRANSACTIONS: TAKE-UP VOLUME FELL BY MORE THAN HALF
            THE EXCEPTION OF LA DEFENSE
            PRIME RENT: NEW RECORD
            IMMEDIATE SUPPLY: 5 YEARS OF DECREASE WIPED OUT
            FUTURE SUPPLY: SHARP INCREASE IN THE SHORT TERM
            BUT BALANCE IN THE LONGER TERM
            VARYING IMPACTS DEPENDING ON THE AREA
            WHAT SUPPORTS THE DEMAND
            BREXIT: FEWER MOVEMENTS IN 2020
            BREXIT: ALMOST 100 MOVEMENTS IN PARIS
            COVID-19: CHANGE OF REVOLUTION ?
            MORE COMPLEX ORGANISATION
            COWORKING: THWARTED DYNAMICS
            COWORKING: SUPPLY STILL LIMITED IN THE SUBURBS
            WHAT IS THE IMPACT ON OFFICE GEOGRAPHY?
            A SOURCE OF CONVERSION INTO HOUSING?
            SUMMARY MAP
            THE OUTLOOK FOR 2021…AND BEYOND

1   2   3
KNIGH T FR A NK 2020 REVIEW AND 2021 O UT LO O K OFFIC ES
WHAT WE SAID A YEAR AGO
ECONOMIC SITUATION: STILL UNCERTAIN
• Slowdown in global growth
• Resilience of the French economy?
• Risks still numerous (Brexit, elections in the USA, social tensions in France, etc.).
THE MAIN DRIVERS OF DEMAND
• New ways of working
• Increased search for flexibility and services
• Attracting and retaining talent (accessibility, wellness, etc.)
• Continued expansion of digital companies
• Continuation of streamlining initiatives for more "traditional" occupiers
FUTURE SUPPLY AND MAIN AREAS OF DEVELOPMENT
• Renewal of office stock in established office hubs (Paris, Western Crescent)
• Dynamism of areas on the edge of the capital (Parisian address, accessibility, quality of supply)
• Development of the Grand Paris hubs (Saint-Denis, Saint-Ouen, Fontenay-sous-Bois, Villejuif, etc.)
1 2 3 29KNIGH T FR A NK 2020 REVIEW AND 2021 O UT LO O K OFFIC ES
WHAT ACTUALLY HAPPENED
ECONOMIC SITUATION: STILL UNCERTAIN
• Covid-19: one of the worst crises in recent history
• Global economic recession
• Resilience of the French economy thwarted by the health crisis
• Risks still numerous: new waves
( of the pandemic, companyBrexit,
debt, social tensions in France and around the world , etc.),
but vaccines give hope
THE MAIN DRIVERS OF DEMAND
• New ways of working
• Increased search for flexibility and services
• Attracting and retaining talent (accessibility, wellness, etc.) : something that needs to be put into perspective given the deterioration of the job market?
• Expansion of digital companies in question
• Acceleration of streamlining initiatives for more "traditional" occupiers
FUTURE SUPPLY AND MAIN AREAS OF DEVELOPMENT
• Renewal of office stock in established office hubs (Paris, Western Crescent)
• Dynamism of areas on the edge of the capital (Parisian address, accessibility, quality of supply)
• Development of the Grand Paris hubs (Saint-Denis, Saint-Ouen, Fontenay-sous-Bois, Villejuif, etc.)
• Increases in future deliveries, but building permits and building starts are beginning to decrease
1 2 3 30KNIGH T FR A NK 2020 REVIEW AND 2021 O UT LO O K OFFIC ES
AT ITS LOWEST LEVEL FOR 20 YEARS
After a 9% year-on-year fall in
2019, take-up fell by 42% in Take up change in the Greater Paris Region
2020, with barely 1.38 million sq m
of office space let or sold to
3,000,000 100
occupiers in the Greater Paris
Region. This result, down 40% 90
compared with the ten-year 2,500,000
-42%
average, is the worst in the last 80
20 years.
1,383,601
70
2,000,000
This downturn is obviously linked year-on-year
60
to the Covid-19 pandemic and the
lack of visibility on the health and 1,500,000 50
economic situation. Companies
have been very cautious since the 40
first lockdown, and remain 1,000,000
30
focused on preventing health
risks and preserving their
activity rather than redefining and 500,000
21
20
-40%
implementing a real estate 10 10-year average
strategy.
0 0
Take-up (m²) Average take-up (2010/2019)
Number of deals > 5,000 m²
Source: Knight Frank
1 2 3 31KNIGH T FR A NK 2020 REVIEW AND 2021 O UT LO O K OFFIC ES
LARGE TRANSACTIONS: VOLUME FELL BY MORE THAN HALF
Small areas ( < 1,000 sq m) have fared best, with a 27% Large transactions account for just 29% of total take-
decrease year-on-year compared with -42% for medium- up in 2020 compared with 40% on average over the last
21
sized areas (1,000 to 5,000 sq m). The fall is even more ten years. The decrease would have been much greater
marked for large areas, both in number, with 21 without two large transactions: TOTAL's lease of 125,000
transactions
transactions over 5,000 sq m (compared with 72 in 2019), sq m on "The Link" in La Défense and ENGIE's letting of a
and in volume, with take-up of 404,000 sq m in 2020 new 94,000 sq m campus in La Garenne-Colombes, which
compared with 887,000 sq m in 2019, and nearly one
million sq m in 2018!
together account for 55% of the take-up volumes over
5,000 sq m in 2020.
> 5,000 sq m
(72 in 2019)
Smaller areas fared better
Take-up by area category in the Greater Paris Region
Out of total volume in sq m =
404,000 SQ M
16% 15% 21% (887,000 sq m in 2019)
24% 22% 9%
35% =
30% 35%
30% 28% 35% 29%
of take-up
(37% in 2019)
10-year average 2019 2020
< 1,000 sq m 1,000 to 5,000 sq m 5,000 to 20,000 sq m > 20,000 sq m
Source: Knight Frank
1 2 3 32KNIGH T FR A NK 2020 REVIEW AND 2021 O UT LO O K OFFIC ES
2020 LARGE TRANSACTIONS
Examples of transactions > 5,000 sq m
PARIS
BOSTON CONSULTING | L1VE VYV | 62 RUE JEANNE D’ARC WEBHELP | TOKO GOLDMAN SACHS | 83 Av. MARCEAU MORNING | HÔTEL DE LA MARINE
PARIS 16th (20,000 sq m) PARIS 13th (9,700 sq m) PARIS 17th (7,400 sq m) PARIS 16th (6,500 sq m) PARIS 8th (6,100 sq m)
SUBURBS
TOTAL | THE LINK ENGIE | RUE DES FAUVELLES NEXITY | REIWA SOPRA STERIA | LATITUDE VERSPIEREN | #CURVE
LA DÉFENSE (125,000 sq m) LA GARENNE-COLOMBES (94,300 sq m) SAINT-OUEN (25,000 sq m) LA DÉFENSE (21,600 sq m) SAINT-DENIS (5,980 sq m)
Source: Knight Frank
1 2 3 33KNIGH T FR A NK 2020 REVIEW AND 2021 O UT LO O K OFFIC ES
THE EXCEPTION OF LA DÉFENSE
With just over 200,000 sq m let, up 33% year-on-year, La higher than its low point in 2002. The other office sectors effects of the health crisis on real estate demand were
Défense achieved an excellent performance, which needs show volumes down by 15 to 79% compared to 2019. In also cushioned by the wide diversity of Parisian
to be put into perspective by the weight of TOTAL's Paris, take-up fell by 43% in the CBD, but remains 29% occupier profiles.
letting of "The Link". Without this, the business district's higher than its low point in 2002. This relative resilience is
performance would have been negative, although 32% based on the continued letting of small areas. The
Virtually across-the-board decreases One of La Défense’s best years
Change in take-up, in volume of sq m Change in take-up, in volume of sq m
Between 2019 and 2020
350,000
216,572
-43% Paris CBD
300,000
-39%
Paris Non CBD 250,000
La Défense +33% 200,000
-49% Western Crescent
150,000
100,000
-60% Inner suburbs
50,000
The Link
Total
125,000 sq m
-48% Outer suburbs 0
2006 2007 2008 2009 2010 2011 2012 2013 2014 2015 2016 2017 2018 2019 2020
Source: Knight Frank Take-up (m²) Average take-up (2010/2019)
1 2 3 34KNIGH T FR A NK 2020 REVIEW AND 2021 O UT LO O K OFFIC ES
PRIME RENT: NEW RECORD
In 2020, several consulting and finance companies let The increase in prime rent contrasts with the stabilisation of growing distinction between exceptional assets and the
some of Paris’ finest assets, pushing up the prime rent. As a the average rent. While the latter remains high, the growing rest of the market.
result, the prime rent stands at €940/sq m/year and is 10% gap between prime and average rents provides a better
higher than its previous record of 2019. measure of the impact of the health crisis, and illustrates the
Continued high number of Increasing gap between prime and average
prime transactions Change in prime and average rents in the Greater Paris Region
In €/sq m/year
Number of transactions
≥ €800 /sq m/year
In Inner Paris,
on areas ≥ 500 sq m
1,000 € 865 940
900 €
800 €
700 €
600 €
500 € 411 413
400 €
300 €
200 €
100 €
0 €
2009 2010 2011 2012 2013 2014 2015 2016 2017 2018 2019 2020
Source: Knight Frank Average rent Prime Rent
Average rent: weighted average of all transactions over the last 12 months (all areas and qualities combined)
Prime rent: weighted average of 5 transactions >500 sq m at the highest rents for the last 12 months (of all grades)
1 2 3 35KNIGH T FR A NK 2020 REVIEW AND 2021 O UT LO O K OFFIC ES
IMMEDIATE SUPPLY: FIVE YEARS OF DECREASE WIPED OUT
The volume of immediate supply in the Greater Paris Region Supply doubled in Paris, pushing the vacancy rate from compared with 4.9% a year ago. Elsewhere, the volume of
totalled 3.57 million sq m at the end of the 4th quarter 2020, a 2.1% in the 4th quarter of 2019 to 4.1% one year later. The immediate supply is progressing more moderately, with an
vacancy rate of 6.5% and an increase of 31% year-on-year vacancy rate in the CBD rose from 1.4% to 4%. increase of between 18% in the Western Crescent and 31%
due to the acceleration in properties being vacated and the in the Inner Suburbs.
drop in demand. Nevertheless, availability remains 11% Outside of Paris, the immediate supply has increased
below the previous high point in 2014. the most in La Défense, with a vacancy rate of almost 10%
31% increase in immediate supply in 2020
Change in available supply and vacancy rate
In the Greater Paris Region, as a %
6.5%
Vacancy rate in the
4,500,000 9 Greater Paris Region
7.7 % End 2020
4,000,000 8
6.5 %
3,500,000 7
3,000,000
5.5 % 6
2,500,000 5
2,000,000 4 4.1%
1,500,000 3 Vacancy rate in
3,571,890
Inner Paris
1,000,000 2 End 2020
500,000 1
0 0
2008 2009 2010 2011 2012 2013 2014 2015 2016 2017 2018 2019 2020 Source: Knight Frank
Immediatesupply
Immediate supply (m²)
(sq m ) Vacancy
Greater rate
ParisinRegion
Greater Paris (%)
vacancy rate
1 2 3 36KNIGH T FR A NK 2020 REVIEW AND 2021 O UT LO O K OFFIC ES
FUTURE SUPPLY: SHARP INCREASE IN THE SHORT TERM
More than 130 projects > 5,000 sq m are currently under Southern Loop. Other office hubs are much better Paris Region market to return to balance. That said, the last
construction in the Greater Paris Region for a total of supplied, such as La Défense (more than 250,000 sq m of few months have already seen a decrease in building
2.5 million sq m, 63% of which is still available. Future office space still available) and the Inner Northern starts and building permit applications, as well as a
supply is fairly contained in Paris CBD, with a 55% pre- Suburbs (342,000 sq m). Given the current lack of visibility, scaling down of certain development projects.
letting rate, and in sectors such as Paris South or the it is difficult to predict how long it will take for the Greater
Delivery peak in 2021
Delivery of new or redeveloped areas Paris in balance
> 5,000 sq m in the Greater Paris Region Pre-letting rate by geographical sector
Available Delivered Office supply to be delivered by the end of 2023
Pre-let Postponements related to Covid-19 (building permits submitted / building permits accepted / under construction)
1,800,000 sq m²
1,800,000 m
1,600,000 sq m²
1,600,000 m
50%
1,400,000 sq m²
1,400,000 m
1,200,000 sq m²
1,200,000 m
1,000,000 sq m²
1,000,000 m
38%
Average take-up
˃ 5,000 sq m
800,000 sq m²
800,000 m
600,000 sq m²
600,000 m
400,000
400,000 sq m²
m
53%
200,000
200,000 sq m²
m
20%
8%
0 m²
0 sq m
2016 2017 2018 2019 2020 2021 2022 2023
18% 6%
Inner Paris
La Défense
Source: Knight Frank Western Crescent
Inner Suburbs
1 2 3 37KNIGH T FR A NK 2020 REVIEW AND 2021 O UT LO O K OFFIC ES
BUT BALANCE IN THE LONGER TERM
2021
Development areas 2022
Map of new/redevelopments projects > 5,000 sq m to be 2023
delivered in the Greater Paris Region between 2021 and 2023
Future trends:
Decrease in building starts
(with the exception of certain future Grand Paris
Express hubs)
Resizing of office projects
(growth in remote working, search for savings, etc.)
Stagnation of the Greater Paris Region office stock?
Source: Knight Frank
1 2 3 38KNIGH T FR A NK 2020 REVIEW AND 2021 O UT LO O K OFFIC ES
VARYING IMPACTS DEPENDING ON THE AREA
An analysis of the distribution of take- Supply/demand imbalance: sectors with varying degrees of exposure
up ˃ 5,000 sq m by activity makes it Share of each activity sector in take-up ˃ 5,000 sq m
possible to identify the sectors In the Greater Paris Region, by geographical sector, as a % of total volume between 2000 and 2020
Pre-letting rate Vacancy rate
potentially most exposed to
2021 - 2023 End Q4 2020
variations in business demand and
2e couronne
Outer suburbs 22 %
to the shock of the Covid-19 Industry-Distribution
0% to 5%
pandemic. Banking-Insurance Southern inner
1ere suburbs
cour. Sud 35 %
New Tech / Media 1ereinner
Northern cour. Nord
suburbs 4%
In addition to having a fairly limited 5% to 10%
future supply, Paris CBD is Public 1ere
Eastern cour.
inner Est
suburbs
22 %
characterised by the wide variety of its Consultancy/ Lawyers > 10%
Péri-Défense
Péri-Défense
32 %
occupiers, which protects it from
Services / Others
sectoral crises and should enable it to Neuilly-Levallois
Neuilly-Levallois 22 %
Coworking
maintain a certain appeal despite
Southern
Boucle bend
Sud
the health crisis. 53 %
Boucle Nord
Northern bend 81 %
The question of the absorption of
LaLaDéfense
Défense 6%
supply arises more for sectors with
less varied occupier profiles and Southern
Paris Paris
Sud 66 %
with a low proportion of pre-lettings
Paris Nord-Est
Northern Paris 0%
of new projects.
Paris Centre WestPéri-QCA
(exl. CBD) 26 %
Paris
ParisQCA
CBD 55 %
0% 20% 40% 60% 80% 100%
Source: Knight Frank
1 2 3 39KNIGH T FR A NK 2020 REVIEW AND 2021 O UT LO O K OFFIC ES
WHAT SUPPORTS THE DEMAND?
SEARCH FOR SAVINGS BREXIT EFFECT RESILIENT SECTORS
Immediate needs for streamlining New movements New technologies, finance,
Mergers / Consolidations Implementation of ongoing projects consulting, public sector, etc.
GRAND PARIS EFFECT SEARCH FOR FLEXIBILITY NEW LIFESTYLES
Project progress (L14, Eole, etc.) Coworking / Flex-office Bringing living and working places
Quality/price of the real estate supply Solutions offered by landlords closer together
New residential pathways
Source: Knight Frank
1 2 3 40KNIGH T FR A NK 2020 REVIEW AND 2021 O UT LO O K OFFIC ES
BREXIT: FEWER MOVEMENTS IN 2020
Following the peak in 2018, and a slight slowdown in 2019, 2019, many companies had already made arrangements to the uncertainty surrounding negotiations between London
Brexit-related movements were much rarer in 2020, with continue to access the European market after Brexit. The and the EU, forced some players to postpone their Brexit-
60 definite or potential projects. This sharp decrease is not decrease in the number of movements observed in 2020 can related setting-up or relocation projects.
surprising. Between the referendum in 2016 and the end of also be explained by the Covid-19 outbreak which, adding to
Sharp decrease in the number of movements Finance: two thirds of movements
Chronological changes in Brexit-related movements in Europe Breakdown of movements by activity sector in Europe
Announced, actual or potential movements Announced, actual or potential movements
Finance (Fintech)
Others
49%
2016
11 2017
12%
109 Fintech
Total Insurance 15%
11%
576
2018
228 Lawyers/
movements Pharmaceutical
Consulting
sector
2019 6%
3%
2020 168
60 Audio-visual
4%
Source: Knight Frank
1 2 3 41KNIGH T FR A NK 2020 REVIEW AND 2021 O UT LO O K OFFIC ES
BREXIT: ALMOST 100 MOVEMENTS IN PARIS
Paris has around thirty fewer Paris confirms its second place The CBD first and foremost
movements than Dublin but has Geographical distribution of Brexit-related movements in Europe Breakdown of movements by geographical sector
confirmed its second place and Announced, actual or potential movements, by city In number of movements in the Greater Paris Region
widened the gap with Luxembourg
in 2020. 18 new projects were
identified in 2020, bringing the total Western Crescent
number of Brexit-related movements Paris South
1%
129
since 2016 to 97.
La Défense
3%
6%
A traditional and almost exclusive Dublin Paris Centre West
target of international finance and 6%
(Outside CBD)
major Anglo-Saxon law firms, the CBD
remains the preferred destination
for Brexit-related movements in
97 Inner Paris
Paris/Greater Paris R.
France. This sector accounts for 84% 93%
of the number of relocation, setting-up
or expansion projects registered since
2016 in the Greater Paris Region, far
84
Luxembourg 84%
ahead of La Défense (6%) and other
Parisian districts outside the CBD. Paris CBD
66 20
Amsterdam Brussels
52 18
Source: Knight Frank Frankfurt Madrid
1 2 3 42KNIGH T FR A NK 2020 REVIEW AND 2021 O UT LO O K OFFIC ES
COVID-19: CHANGE OR REVOLUTION?
Before the outbreak of the health crisis, some major structural key role, bringing flexibility to companies and contributing to structural or cyclical factors also need to be taken into
changes had already begun to profoundly transform the growth of remote working and the emergence of more account. In the very short term, companies will thus be
companies' demand and expectations in terms of office space collaborative ways of working. The effects of this revolution focused on the continuity of their activity and streamlining
design. Among these factors, the digital revolution played a are likely to be amplified by the health crisis, even if other their real estate.
UNDERLYING
TRENDS
EFFECTS ON
COMPANY
DEMAND
EFFECTS ON
OFFICE
PROPERTY
Source: Knight Frank
1 2 3 43KNIGH T FR A NK 2020 REVIEW AND 2021 O UT LO O K OFFIC ES
COVID-19: CHANGE OR REVOLUTION?
UNDERLYING
TRENDS
EFFECTS ON
COMPANY
DEMAND
EFFECTS ON
OFFICE
PROPERTY
Source: Knight Frank
1 2 3 44KNIGH T FR A NK 2020 REVIEW AND 2021 O UT LO O K OFFIC ES
COVID-19: CHANGE OR REVOLUTION?
UNDERLYING
TRENDS
EFFECTS ON
COMPANY
DEMAND
EFFECTS ON
OFFICE
PROPERTY
Source: Knight Frank
1 2 3 45KNIGH T FR A NK 2020 REVIEW AND 2021 O UT LO O K OFFIC ES
MORE COMPLEX ORGANISATION
While the French remain attached to the office, many of them with, in favour of a more complex organisation offering some tasks would continue to be carried out at home or in
have been able to experiment with remote working on a large much more flexibility to employees. Within this new third places close to the employees' homes; other types of
scale, and it is likely that after the pandemic employees will framework, employees would alternate between different space – company headquarters, local or regional offices,
want to keep this flexibility in their daily lives. Such a work settings, adapted to different roles and professional coworking areas, etc. – being favoured for tasks or moments
development would signal the end of the "one size fits all" relationships, and to more blurred boundaries between the involving more social interaction (training, work in project
office, a standardised space that all employees have to live "professional" and "personal". Once the crisis is over, mode, etc.).
PRE COVID-19 POST COVID-19
90%
OFFICES
10%
REMOTE WORKING
More choices
offered to employees
Workplace as a service
One size fits all, or nobody ?
Working from home Local co-
working/café or
branch working
Meeting or education Innovation or
centre client/community
engagement hub
Local or regional office
Source: Knight Frank / Images: Freepik
1 2 3 46KNIGH T FR A NK 2020 REVIEW AND 2021 O UT LO O K OFFIC ES
COWORKING: THWARTED DYNAMICS
While long-term trends are quite Decrease in volumes absorbed Sharp decrease in areas
favourable to flex-offices, the areas Change in take-up by coworking space providers Average area of coworking space providers leases
In the Greater Paris Region In the Greater Paris Region
rented by coworking space
providers fell sharply in 2020 (-81%
year on year), following a record year
in 2019. In addition to the difficulties
250,000
250,000 m²
sq m 80
associated with the health situation,
market players have had to "digest" 70
the large number of square metres
200,000 sq m
200,000 m²
leased in recent years. 60
1,341 sq m
Only one movement > 5,000 sq m 150,000 sq m 50
150,000 m²
was recorded in 2020 in the Greater
40
Paris Region (MORNING in the Average area let in 2020
“Hôtel de la Marine”), compared with 100,000 sq m
100,000 m²
30
11 in 2019. Small and medium-sized
areas therefore accounted for the 20
50,000 sq m
50,000 m²
bulk of coworking transactions in the
Greater Paris Region, explaining the 10
sharp 52% decrease in the average 0 sq0 m
m² 0
-52% year-on-year
size of let space. 2015 2016 2017 2018 2019 2020
Take-up (m²) Transactions > 5,000 m²
Number of deals
Source: Knight Frank
1 2 3 47KNIGH T FR A NK 2020 REVIEW AND 2021 O UT LO O K OFFIC ES
COWORKING: SUPPLY STILL LIMITED IN THE SUBURBS
Paris accounts for 73% of the volumes let by coworking exception of La Défense and a few Western Crescent reversed and see the development of third spaces as
operators since 2015, including a dominant share (40%) in towns, the other markets remain for the time being relatively close as possible to where employees live?
Paris CBD. The trend remained the same in 2020 due in unaffected by the coworking phenomenon. With the health
particular to several DESKEO leases in the capital. With the crisis and the boom in remote working, could the trend be
A very Parisian phenomenon
Map of coworking space providers leases since 2015 Geographical distribution of coworking space
providers leases since 2015
Paris CBD
40%
% of total volume in the Greater Paris Region Paris non CBD
33%
Western
La Crescent
Défense
12%
11%
Inner
suburbs
3%
Outer
Areas ˃ 5,000 sq m suburbs
Areas < 5,000 sq m
1%
Source: Knight Frank
1 2 3 48KNIGH T FR A NK 2020 REVIEW AND 2021 O UT LO O K OFFIC ES
WHAT IS THE IMPACT ON OFFICE GEOGRAPHY?
The expansion of coworking outside the most central very concentrated in Paris and the major office hubs of the geography of the Greater Paris Region (growth of remote
areas of the conurbation would be a sign of the beginning Hauts-de-Seine department. In the long term, other factors working, improved public transport in the suburbs,
of a decentralisation of the office market, which is still could encourage a moderate rebalancing of the office demographic growth in the Inner and Outer Suburbs, etc.).
From a very polarised market... …to a more balanced situation?
Share of Paris and Hauts-de-Seine in the Greater Paris Region, all areas combined
PRE-COVID SITUATION POST-COVID TRENDS
57% of office stock • Rise of remote working / more autonomy given to employees
• New aspirations (flexibility, local, etc.)
• Demographic dynamics of the peri-urban area
73% of 2000-2020 take-up •
•
Traffic restrictions in Paris
Public transport improved in the suburbs
• Search for cost reduction by companies
• Development of third places outside Paris
61% of future new and refurbished available supply
Projects started or not started, with or without building permit (2021-2025)
Source: Knight Frank
1 2 3 49KNIGH T FR A NK 2020 REVIEW AND 2021 O UT LO O K OFFIC ES
A SOURCE OF CONVERSION INTO HOUSING?
While the health crisis is driving up the vacancy rate, the new Average demand
Vacancy Demographic
market context seems more favourable to the transformation Office stock (> 5,000 sq m)
rate change*
2015-2019
of obsolete offices into housing. This type of project seems
particularly appropriate in towns that are less central or less Paris 16,937,516 sq m 4.1% 314,530 sq m 5% and +
well connected to public transport, which have a large office Nanterre 1,389,981 sq m 12.4% 50,630 sq m
stock that is partly unsuited to the needs of companies. Saint-Denis 1,371,120 sq m 8.9% 33,091 sq m 0% to 5%
Boulogne-Billancourt 1,180,600 sq m 7.1% 39,420 sq m
Issy-les-Moulineaux 969,700 sq m 7.5% 81,680 sq m -5% to 0%
Levallois-Perret 929,600 sq m 8.3% 13,390 sq m
Rueil-Malmaison 805,180 sq m 11.8% 24,040 sq m
Guyancourt 674,200 sq m 4.4% 11,100 sq m
Vélizy-Villacoublay 660,000 sq m 14.9% 7,340 sq m
NEW RESIDENTIAL PATHS HOUSING CRISIS
Montreuil 639,100 sq m 2.5% 13,010 sq m
Neuilly-sur-Seine 596,920 sq m 3.5% 15,750 sq m
Montrouge 575,600 sq m 6.1% 27,500 sq m
Clichy 538,200 sq m 13.2% 10,445 sq m
Massy 452,200 sq m 12.9% 12,380 sq m
Montigny-le-Bretonneux 433,800 sq m 16.2% 12,371 sq m
Tremblay-en-France 395,200 sq m 10.3% 3,688 sq m
Sources : Knight Frank / INSEE (*Average population change between 2012 and 2017)
GROWTH IN REMOTE WORKING
1 2 3 50KNIGH T FR A NK 2020 REVIEW AND 2021 O UT LO O K OFFIC ES
Summary map
Triangle de Gonesse
Le Bourget
Aéroport
Vers
Mantes-la-Jolie
Saint-Denis
Pleyel
Mairie de
Grand Paris Express network Saint--Ouen
Clichy
Extension of existing lines Montfermeil
Under construction or planned
Future Grand Paris Express / Eole Chelles
New stations
Saint-Lazare
Number of housing units envisaged Champigny
per project by 2022 Olympiades Centre Noisy
Champs
Less than 50
50 to 100 Pont de
Sèvres
100 to 200 Villiers
sur-Marne
More than 200
Versailles
Projects > 5,000 sq m of offices (new or Chantiers
redeveloped) available by 2022
Less than 10,000 sq m
Between 10,000 and 30,000 sq m
CEA Saint-Aubin
More than 30,000 sq m
Aéroport d’Orly Tournan
Sources: Knight Frank / Grecam
1 2 3 51KNIGH T FR A NK 2020 REVIEW AND 2021 O UT LO O K OFFIC ES
THE OUTLOOK FOR 2021…
AND BEYOND
• COMPANIES GIVE PRIORITY TO THE CONTINUITY OF THEIR ACTIVITY
• SUSTAINED SLOWDOWN IN TAKE-UP
• EMPLOYEES STILL WANT TO RETURN TO THE OFFICE, BUT WANT MORE FLEXIBILITY
• WHAT DOES THE FUTURE HOLD FOR THE 3/6/9 LEASE?
• NO REVOLUTION, BUT AN INTENSIFICATION OF THE TRENDS ASSOCIATED WITH THE DIGITALISATION OF WORK
• COST-CUTTING STRATEGIES FAVOURING CERTAIN SUBMARKETS IN THE INNER SUBURBS
• CUSHIONED SHOCK IN PARIS (DIVERSITY OF COMPANIES, MORE RESISTANT SECTORS OF ACTIVITY, “FLAGSHIP BUILDINGS”, ETC.)
• MODERATE REBALANCING OF THE OFFICE GEOGRAPHY
• HEALTH CRISIS: NEW OPPORTUNITIES FOR OFFICE TRANSFORMATION?
1 2 3 522020 REVIEW AND 2021 OUTLOOK R E TA I L 1 2 3
R E TA I L
            WHAT WE SAID A YEAR AGO
            WHAT ACTUALLY HAPPENED
            MACRO-ECONOMIC CONTEXT
            TOURISM AT A STANDSTILL
            WHEN WILL TOURISTS RETURN?
            LUXURY: A MODERATE DECREASE
            LUXURY: PRIORITY GIVEN TO HISTORICAL STREETS
            FOCUS ON SOME PARISIAN STREETS
            RENTAL VALUES: DOWNWARD PRESSURE
            MAJOR OPENINGS
            A LANDSCAPE IN TURMOIL
            KEY STREAMLINING FACTORS
            FEWER NEWCOMERS
            FEWER NEW SQ M OF RETAIL
            SUPPLY IS BEING RENEWED
            THE OUTLOOK FOR 2021…AND BEYOND

1   2   3
KKNIGH
N I G H T FTR AN
FRKA NK 2020 REVIEW AND 2021 O UT LO O K BILAN 2019 ET PERSPECTIVES 2020 C OR
M ETA
M E R CIL
ES
WHAT WE SAID A YEAR AGO
A CONTEXT THAT REMAINS UNCERTAIN
• Social tensions
• Economic slowdown
• Increase in purchasing power: consumption potential limited by consumer choices?
RETAILERS / LETTINGS MARKET
• Winning sectors: catering, sport and leisure (climbing, virtual reality, etc.), low-price retailers, second-hand, urban formats, etc.
• Dynamism of the luxury market
• A street to watch: rue de Rivoli
• Continued arbitration of the least profitable sites
• Moderate correction of rental values
RETAIL PROJECTS
• Mixed uses
• Continued slowdown in the creation of new shopping centres
• Start of a slowdown in deliveries of retail parks?
• Municipal elections, moratoriums and retail bashing: what are the impacts on developments?
1 2 3KKNIGH
N I G H T FTR AN
FRKA NK 2020 REVIEW AND 2021 O UT LO O K BILAN 2019 ET PERSPECTIVES 2020 C OR
M ETA
M E R CIL
ES
WHAT ACTUALLY HAPPENED
A CONTEXT THAT REMAINS UNCERTAIN
• Social tensions exacerbated by the health crisis
• Economic slowdown exacerbated by the health crisis
• Decrease
Baisse in purchasing power: a consumption potential limited by consumer choices, the downturn in the job market and household caution
RETAILERS / LETTINGS MARKET
• Winning sectors: fast food, sport and leisure (climbing, virtual reality, etc.), low-price retailers, second-hand, urban formats, etc.
• Luxury: virtual disappearance of the international clientele and a decrease in the number of openings
• A street to watch: rue de Rivoli, awaiting the opening of IKEA and the Samaritaine
• Continued arbitration of the least profitable sites, exacerbated by the health crisis
• Sometimes significant correction of rental values in all market categories
RETAIL PROJECTS
• Mixed uses
• Continued slowdown in the creation of new shopping centres
• Marked slowdown in deliveries of retail parks
• Municipal elections, moratoriums and retail bashing: increasing impact on developments
1 2 3KKNIGH
N I G H T FTR AN
FRKA NK 2020 REVIEW AND 2021 O UT LO O K BILAN 2019 ET PERSPECTIVES 2020 C OR
M ETA
M E R CIL
ES
MACRO-ECONOMIC CONTEXT
The current pandemic and economic
Consumer confidence: halting change Savings: a key factor in the recovery
forecasts do not point to a rapid and
Consumer opinion Household consumption and gross disposable income
general recovery of retail activity. Synthetic indicator - CVS-CJO data As a %, annual average
Nevertheless, there are signs of a Household consumption
gradual improvement, starting with the Savings rate
launch of vaccination campaigns, the 130 As a % of gross disposable income
125
success of which could help to restore
household confidence which was 120
shaken at the end of 2020 by the
108
22.20%
increase in the number of infections. 110
Indeed, improved consumer
19.50%
confidence and a significant drop in 100
Covid-19 cases are the prerequisites 95
14.90%
14.60%
14.50%
for any lasting recovery in 90
consumption, which could be
87
boosted by the use of savings 80 8.1%
accumulated by the French in 2020. 80
70 4.1%
juil-01
juil-03
juil-05
juil-07
juil-09
juil-11
juil-13
juil-15
juil-17
juil-19
mars-00
mars-02
mars-04
mars-06
mars-08
mars-10
mars-12
mars-14
mars-16
mars-18
mars-20
nov-00
nov-02
nov-04
nov-06
nov-08
nov-10
nov-12
nov-14
nov-16
nov-18
nov-20
1.5% 1.4%
2019 2020e 2021f 2022f 2023f
Source: INSEE -8.2% Sources: INSEE / Banque de France
1 2 3KKNIGH
N I G H T FTR AN
FRKA NK 2020 REVIEW AND 2021 O UT LO O K BILAN 2019 ET PERSPECTIVES 2020 R ETA IL
TOURISM AT A STANDSTILL
A clientele has been missing Sharp drop in international tourism No improvement in the short term
since the outbreak of the health Number of tourist overnight stays in the Greater Paris Forecasts of flight bookings at Paris airports, by origin, January to March 2021
crisis: that of foreign visitors, Region in 2020 Year-on-year change as a %
In millions
who accounted for nearly half
of the tourists in Paris in 2019
and often generate the majority International clientele
6.9
of sales for retailers in the French clientele
centre of the capital. 6.0
Russia
Non-Europeans, who are
usually the most high-spending
-98.6%
Italy
tourists, have accounted for a
-95.4%
particularly significant loss of USA China Japan
Spain
income for the luxury sector, -95.4% -99.5% -91.7%
which will still have to do
-96.1%
2.5 2.7
2.3 India
without a good part of this 2.1 2.1 1.9
-98.9%
lucrative income in 2021.
1.5 1.6 1.6 1.7 1.6
1.0 1.5 Brasil
0.7 0.9 1.3 -96.1%
0.6
0.2
March
February
June
August
July
October
May
September
April
January
1 2 3 Sources: Flux Vision Orange, Comité régional du Tourisme d’Île-de-France Source: ForwardKeys (données mises à jour le 30 novembre 2020)KKNIGH
N I G H T FTR AN
FRKA NK 2020 REVIEW AND 2021 O UT LO O K BILAN 2019 ET PERSPECTIVES 2020 C OR
M ETA
M E R CIL
ES
WHEN WILL TOURISTS RETURN?
A very gradual recovery
Change in international tourist arrivals in Europe
Difference with 2019 level as a %
11.2%
5.2%
2019
-4.0% -2.5%
-9.0%
-15.8%
-18.0%-17.0%
-22.0%
-35.7%
-68.8%
2014 2015 2016 2017 2018 2020e 2021f 2022f 2023f 2024f 2025f
Source: UNWTO Source: Oxford Economics
1 2 3You can also read