Revisiting digital inclusion: A survey of theory, measurement and recent research
←
→
Page content transcription
If your browser does not render page correctly, please read the page content below
Revisiting digital inclusion: A survey of
       theory, measurement and recent research
                                              Matthew Sharp∗

                                               31 March 2022

                                                   Abstract

        Focusing on the internet as a foundational technology, this paper begins by summarising
        recent developments in digital inclusion theory, particularly as this relates to developing
        countries. It sets out a framework of core components of digital inclusion - including ac-
        cess/use, quality of access/use, affordability, and digital skills - and briefly considers policy
        implications. The paper then surveys the ways these components are currently measured
        in household and firm surveys and by international organisations, highlighting some of the
        often-overlooked weaknesses of current measures, and suggesting possible improvements.
        The paper also reflects on potential applications of (and risks associated with) new ways of
        measuring digital inclusion using big data. Lastly, building on the framework developed,
        the paper reviews the empirical literature on ‘digital divides’ in developing countries, and
        makes suggestions for how future research could become more rigorous and useful.

   ∗
     Global Development Institute, University of Manchester and Blavatnik School of Government & Centre for the
Study of African Economies, University of Oxford. Email: matthew.sharp@manchester.ac.uk. Martina Querejeta
provided excellent research assistance. The majority of this research was undertaken while I was at the Blavatnik
School of Government, University of Oxford. Thank you to Stefan Dercon, Richard Heeks and Elizabeth Stuart
for useful comments and to participants at seminars organised by the Blavatnik School of Government, Research
ICT Africa and UNU-WIDER.

DOI: https://doi.org/10.35489/BSG-DP-WP_2022/04
1       Introduction

Digital transformation – across trade, production, labour and service delivery – is occurring

at a rapid pace, and is increasingly being recognised as central to development (World Bank,

2016). A critical question has been how to achieve digital inclusion – that is, how to ensure that

everyone can benefit from digital technologies in a substantive way. The long-standing literature

on digital inclusion has undergone two important shifts: First, while the initial focus was on

differential access/usage rates, this has widened to include quality of access/use, affordability

and digital skills; second, while much of the earlier emphasis, at least in the case of developing

countries, was on mobile phones, the focus has shifted to the internet, which has been called ‘the

single most important general purpose technology of recent times’ (Bauer and Latzer, 2016).1

There has been much speculation in recent decades about the potential benefits of the internet

for development. Only recently, however, have credible estimates of the causal impacts of inter-

net connectivity in developing countries emerged in the economics literature. Recent studies on

developing countries have demonstrated significant positive effects on labour markets, democ-

racy, education, financial inclusion, poverty reduction, public service delivery and health (see

reviews in Hjort and Tian, 2021; Zhuravskaya et al., 2020). It has also become increasingly clear

that reliable and fast access to the internet is a prerequisite for developing countries to take ad-

vantage of digital technologies, trade in services and to be able to transition to knowledge-based

economies. China and India are pursuing industrial policies involving the promotion of their

digital economies, and many other developing countries are looking to follow suit. The World

Bank’s World Development Report 2016 ‘Digital Dividends’ concludes that improving digital

inclusion is one of the primary global policy priorities (World Bank, 2016).

The International Telecommunications Union (ITU) of the United Nations, the most highly-

cited source on internet statistics, estimates that, as of 2021, 63% of the world’s population uses

the internet (ITU, 2021). However, data on internet access at the country level for developing

countries are often of low quality. Moreover, disaggregated data on internet access within coun-

tries (for example, for different demographic groups or regions) is often non-existent. Much less

is known about the other aspects of digital inclusion related to the internet in developing coun-

tries. Yet, as will be argued in this paper, having accurate and detailed data on digital inclusion

1
    A general purpose technology is a technology that is pervasive, improves over time, and inspires innovation
    (Bresnahan and Trajtenberg, 1995).

                                                        1
is critical for informing government policy, for goal-setting and for being able to monitor and

evaluate the internet’s impacts on development.

This paper critically examines how digital inclusion related to the internet in developing countries

is measured in household and specialised surveys and with indicators designed by international

organisations. The paper finds that when it comes to currently available data on digital inclusion,

measurement issues - related to reliability and validity - are pervasive. It also argues that,

while (imperfect) efforts have been made to measure internet access/use and affordability, other

core components of digital inclusion - including quality of access/use and digital skills - have

not received the attention they deserve. Another central argument is that while important

attempts have been made to standardise questions related to digital inclusion to be be used

in representative surveys in developing countries, survey designers should be aware that the

internet may be used in particular ways in developing countries which are not captured well in

questions directly taken from high-income country surveys. Finally, the paper contends that

measurement efforts and progress goals related to digital inclusion should do more to consider

within-country inequalities in addition to cross-country inequalities.

The paper then assesses the empirical academic literature on ‘digital divides’ between and within

developing countries. It shows, that despite advances in theory related to digital inclusion, these

studies have tended to narrowly focus, for the most part, on access. It also argues that much

of the statistical research suffers from endogeneity issues, such that it provides an unreliable

picture of how socio-economic factors like gender, education, income and location affect digital

inclusion. The paper recommends a number of steps to improve on and extend this research,

providing relevant empirical examples.

To date, there has been no survey of measurement issues related to digital inclusion nor has there

been a survey of quantitative research on this topic. Moreover, recent surveys of the relationship

between the internet and development outcomes (Hjort and Tian, 2021; Zhuravskaya et al., 2020)

have focused exclusively on internet access and have not considered other aspects of digital

inclusion. This paper aims to fill these gaps. Though digital inclusion is occasionally thought

of in the context of firms (e.g. OECD, 2001), the focus is usually individuals, households and

countries, and will remain as such in this paper. Section 2 considers key theoretical dimensions

of digital inclusion and reflects on the need for government intervention in the digital inclusion

space. Section 3 analyses the ways digital inclusion is currently measured in developing countries,

                                                 2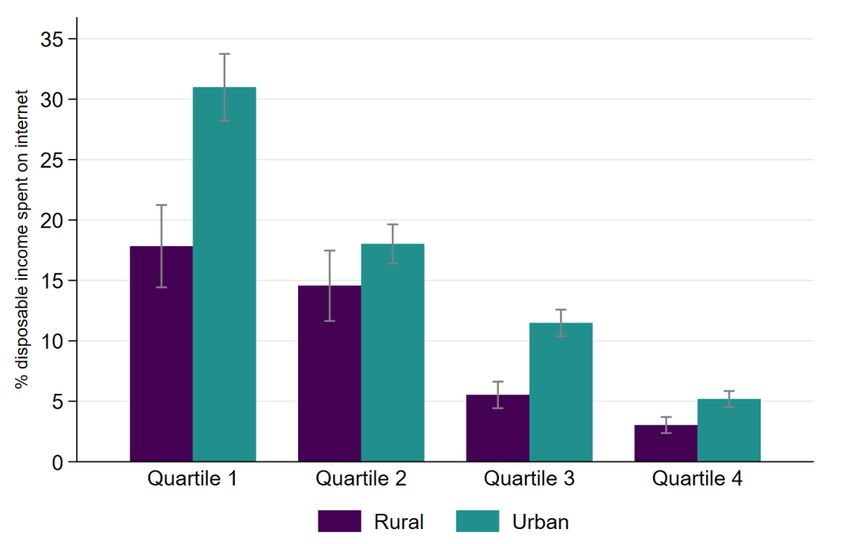
highlighting some of the often-overlooked weaknesses of current measures and suggesting possible

ways to improve on workable, standardisable measures. This section also reflects on potential

applications of new ways of measuring digital inclusion using ‘big data’, as well as some of

the safeguards that need to be in place to mitigate risks around data protection and privacy.

Section 4 surveys the recent literature on digital inclusion and ‘digital divides’ in developing

countries, and makes suggestions for future work.

2     Theory and public policy

2.1    Digital inclusion and digital divides theory

What is often referred to as the ‘digital revolution’ began with the automation and computeri-

sation of manufacturing, and was followed by the widespread use of personal computers, mobile

phones and the internet, all of which are constantly being improved, with new devices being

added (Cruz-Jesus et al., 2016). Because they are related to the diffusion of innovations, digital

divides - or digital inequalities - are often seen soon after a technology is developed (Rogers,

2010). Innovations do not penetrate society in a uniform and immediate fashion but diffuse over

social networks with time, which inevitably creates divides between different parties. Digital

inclusion received much attention in the late 1990s and early 2000s with extensive discussion on

the digital divides between countries (the so-called ‘global digital divide’), and within countries

between demographic groups and places. As well as the internet, the discussion also considered

mobile phones and digital television.

In the early years of its theorisation, the concept of a digital divide was commonly understood

as the gap between those who have access to an information and communications technology

(ICT) and those who do not (Dewan and Riggins, 2005; Van Dijk, 2005). It was implicit that

digital inclusion could be achieved by simply providing access to ICTs (DiMaggio et al., 2004;

Hsieh et al., 2008). Most of the quantitative research on inequalities associated with digital

development has focused on access, exploring how access divides are measured and studying

the determinants of ICT penetration and diffusion at micro, regional, and macro levels (Billon

et al., 2021). The more qualitative sociological literature has claimed that this focus is too

narrow. It has argued that the digital divide is ‘a multidimensional phenomenon that includes

a set of complex divides...caused by a variety of factors’ (Bruno et al., 2011, p. 27), and that

attention should be paid to how different social groups access and use technologies and how this

                                                3
contributes to offline advantages and disadvantages (Witte and Mannon, 2010; Helsper, 2012;
Van Deursen et al., 2017). This literature has argued that even if access divides are closed, there
are concerning second-level divides in skills and usage patterns (DiMaggio and Hargittai, 2001;
Hargittai, 1999; Van Deursen and Van Dijk, 2011; Helsper and Eynon, 2013). Other authors
then suggested that attention be paid to differential impacts of technologies (Helsper et al., 2016;
Wei et al., 2011). It is now common practice among theorists to distinguish between (1) access,
(2) effective usage, and (3) tangible impact of digital technologies. This framing has also been
adopted, at least notionally, in the reports of some international organisations (e.g. ITU, 2006;
World Bank, 2016; UNCTAD, 2017).
While these distinctions are important, they have also created confusion about which digital
inclusion metrics to adopt. This has led to influential academics arguing that there is no point
in standardising measures of digital inclusion (Hilbert, 2011b; Galperin, 2010). They argue that
measures are inherently ‘subjective’ and should be conditional on the desired impact. They also
contend that ‘since there are no common ends in the deployment of ICT, it is counterproductive
to pursue common means’ (Hilbert, 2011b, p. 733).
This paper argues that embracing a multifaceted conception of digital inclusion does not mean
giving up on high-level indicators related to the fundamental components of digital inclusion
and that much could be done to improve their accuracy and sophistication.
2.2 Digital inclusion related to the internet and development
There has been much debate about how much of a priority digital inclusion should be for
developing countries. While a theoretical case for the value of the internet for development is
straightforward, until recently there has been a lack of good evidence and many commentators
have questioned this view.
The theoretical benefits of the internet and related technologies are well-established in the eco-
nomics literature. Most importantly, these technologies reduce the time and money involved
in accessing and exchanging information – that is, they reduce transaction costs (Coase, 1937).
The internet has made many types of transactions much easier, faster and cheaper - for example,
those related to searching and exchanging information, enforcement, bargaining and decision-
making. Due to the magnitude of the improvement over previous communications tools, the
adoption of the internet could lead to a significant impact on economic growth through better
4functioning of markets and firms. These effects may be enhanced by network externalities, where
the value of a connection to a network rises as more people join. Through similar mechanisms,
the internet is expected to lead to improved public service delivery, political participation and
financial inclusion.
While the theoretical case was solid, empirical evidence based on careful identification of impacts
on development (or socioeconomic) outcomes was hard to come by (Deichmann et al., 2016).
There have been many claims of immediate and sizeable effects, particularly from technology
evangelists in industry and politicians. However, even if positive effects were anticipated in
high-income countries, developing countries have poorly functioning institutions and markets
and lower levels of skills, which could nullify these effects (Chen et al., 2020).
Given this uncertainty, many commentators questioned whether providing internet access to all
citizens of developing countries would reap any real benefits (e.g. Kenny, 2002; Fink and Kenny,
2003). Others claimed that scholars emphasising the digital divide as a major social problem
were most often driven by a kind of misplaced technological determinism (Van Dijk, 2002). Fink
and Kenny (2003) contended that to worry about the digital divide, we must believe that the
unequal availability of ICTs leads to systematic divergence in the growth trajectories of rich and
poor countries, and that there was insufficient evidence of this. They also argued that, even if
ICT access gaps increased in the short term, the comparative patterns of ICT diffusion since
the early 1990s suggested that poor countries experience faster growth in ICT access, pointing
the way to convergence in access over the long term.
Now there is much better evidence on the gains from the extension of the internet in developing
countries (see Section 4). Moreover, academics have pointed out that, just because there is sat-
uration of devices at the top of the market, which makes it inevitable that access gaps, narrowly
construed, will close, does not mean we should stop worrying about digital gaps (Van Dijk and
Hacker, 2003; Hilbert, 2014) (see also Section 4). The widely-reported success of other digital
technologies – for example, mobile phones, particularly as these have enabled mobile money
applications – has brought awareness to the development potential of the internet and other
digital technologies in policy-making circles.
52.3 Extending digital inclusion theory
It is clear now that policymakers and academics should be focusing on a richer, multifaceted
definition of digital inclusion. Figure 1 shows reasons people give for not using the internet in a
sample of countries in Sub-Saharan Africa, broken down by gender and reported income quartile.
Not having access to devices is not the only reason people give for not being connected: many
people do not use the internet because they simply do not know about the technology or how
to use it. Affordability also emerges as a major obstacle. It is also noticeable that the relative
importance of barriers may be different for men and women even within the same income group.
Figure 2 shows what this paper considers to be the key theoretical dimensions of digital inclusion.
The relevant background information and theory related to each are considered below. Of course,
there are many other possible dimensions of digital inclusion. While not generally considered a
component of digital inclusion per se, access to electricity is an important constraint to using the
internet in developing countries (Houngbonon et al., 2021). Online trust and safety could also be
viewed as elements of digital inclusion (ITU, 2019b). Also, relevance of content can be seen as a
constraint to digital inclusion in developing countries, as most application and website developers
are based in high-income countries and make products aimed at users in their own countries.
Language also poses a challenge for potential users in the developing world (World Economic
Forum, 2016). Yet, it is fair to assume that the internet, in its current form, has the potential
to provide substantial benefits to everyone with at least basic literacy in developing countries.
This paper focuses on the foundational dimensions of digital inclusion related directly to the
internet and ICTs, which are judged to come before online safety and trust, and empowerment.
2.3.1 Access/use
The most basic dimension of digital inclusion is access/use, which simply considers whether a
person has access to or uses a technology like the internet.
2.3.2 Quality of access/use
Even if two people have access to or use the internet, the quality of their internet access/use
may be very different. There are a few ways to think about this. First, there is the issue of how
a person is accessing the internet: whether they are doing so on a computer or on a basic feature
phone or a smartphone; whether they have a fixed broadband connection at home, a mobile
6Figure 1: Main reasons for not using the internet in selected low- and middle-income African
countries
Data from AfterAccess Surveys 2017/2018 undertaken by Research ICT Africa, broken down by gender and
disposable income quartile. Individuals without disposable income excluded. Countries include Ghana, Kenya,
Mozambique, Nigeria, Rwanda, South Africa, Senegal, Tanzania and Uganda.
Figure 2: Fundamental supply and demand components of digital inclusion related to the internet
7broadband connection or are connecting in a public library or internet café. Second, there
are varying technological capabilities or constraints related to bandwidth and caps on usage.
The interaction between how someone connects to the internet and the technical quality of the
connection will determine what they could potentially use it for: ranging from making a simple
phone call or sending a message, to watching educational videos or carrying out complicated
financial transactions.
In low- and middle-income countries, handheld wireless mobile devices are the primary means of
internet access: according to the GSMA (2019), in these countries, 57% of those who had used
the internet in the previous three months accessed it exclusively via a handheld mobile device. It
is also very common for people in developing countries to access the internet via internet cafes,
which are now not very common in high-income countries. As for technical quality, speeds are
on average much slower in developing countries. When commentators reflect on the dramatic
uptake of the internet in low-income countries, it is important to specify that 2G mobile networks
are still the most widely used in these countries, which only offer very limited narrowband
speeds of less than 256 kbps. While these have enabled voice communications and triggered the
development of applications such as mobile money and agricultural and health text messaging
services, 2G connections support only very basic internet. In recognition of the drawbacks of
measuring internet connectivity simply in terms of having an internet connection or not, in
2020 the Alliance for Affordable Internet called for a new focus on ‘meaningful connectivity’, a
condition which is met when a person has daily use of their own smartphone with (at least) a
4G internet connection and the have an unlimited broadband connection at home or at a place
of work or study (Alliance for Affordable Internet, 2021b).
To show the wide variation in internet speeds across income groups in a middle-income country,
Figure 3 shows the breakdown of internet speeds of home connections for people earning income
of different multiples of the minimum wage in Brazil in 2017/2018. Almost 60% of people in
the highest income group report accessing the internet at speeds greater than 10 mbps (which
is fast enough for most common internet use cases for 1-2 people), whereas only 30% of people
in the lowest income bracket do.
8Figure 3: Reported internet speeds for people of different income groups in Brazil
Data from CETIC 2017/2018 on reported internet speeds, broken down by income (different multiples of the
minimum wage).
2.3.3 Affordability
While the access and quality aspects of digital inclusion are supply-side factors, the affordability
of the internet is a demand-side constraint. Internet use can be expensive relative to household
income, particularly in developing countries. Often affordability measures only consider the
cost of recurring data plan purchases, but the cost of buying a device to access the internet is
also very important. If data or prices are high relative to income, then many people will be
conservative with their mobile internet use, even if access is technically available in their region.
Therefore, affordability is an important factor along both the extensive and intensive margins
of internet use (Bessone et al., 2020). While the ITU reports that fixed and mobile broadband
costs have decreased globally over the last ten years (Adam and Minges, 2018), they remain out
of reach for many at the lowest end of the income distribution.
2.3.4 Digital skills
Many internet uses require basic literacy to be able to participate online. Skills required to make
use of the internet can be classified in a number of ways. An important distinction has been
made between technical/operational skills - that is, the skills needed to operate hardware and
software - and information literacy - that is, the ability to recognise when information can solve
9a problem or fill a need and to effectively employ information resources (Mossberger et al., 2003;
Bawden, 2008).2 Operational digital skills are commonly divided into different categories – basic,
intermediate and advanced – although there is often disagreement on how these categories are
defined. Basic skills make it easier for people to communicate with others and to access and use
services (ITU, 2018a) – for example, completing basic online transactions or using software to
download applications. Intermediate skills enable people to use digital technology in ‘meaningful
and beneficial ways’ (Broadband Commission for Sustainable Development, 2017). Advanced
skills are those highly specialised skills used by ICT specialists.
As the internet and other digital technologies develop, the list of activities under each category
tends to get longer. The level of skill applied in using the internet also may be limited by the
quality of access to the internet.
2.4 Government intervention related to digital inclusion
A multi-factorial view of digital inclusion has potential implications for policy-making. This
paper does not attempt to review in detail all the types of interventions that government should
consider, but this section briefly reviews some of the possible market failures that may warrant
government action.
2.4.1 Regulation of infrastructure and services
Building on research related to industrial organisation and the economics of networks, large
economies of scale and high fixed costs in telecommunications markets complicate the roll out
of networks in regions where a critical mass of users is missing, such as in rural areas (Hilbert,
2015; Greenstein, 2020; Oughton et al., 2022). This may justify the involvement of government,
since the private sector may not be willing to provide last-mile infrastructure – whether mobile
broadband, fixed broadband or even low-earth orbit (LEO) satellites or high-altitude balloons –
on its own accord, unless costs fall dramatically or companies see the value of providing almost-
free services to consumers in exchange for their data.3 Governments can intervene in a range
2
Within information literacy, broadly defined, it is possible to distinguish ‘information navigation skills’ (the
ability to find, select, and evaluate sources of information on the internet), ‘social skills’ (the ability to use
online communication and interactions to understand and exchange meaning and acquire social capital) and
‘creative skills’ (needed to create different types of quality content and to publish or share this with others on
the internet) (Van Deursen et al., 2016).
3
As costs of providing access hardware decrease, some private sector companies are shifting their business models
to target under-served regions - for example, Mojo Networks venture with Reliance Jia, a wireless telecom
provider, in India.
10of ways: they can try to increase competition in the telecommunications sector via actions such
as selling (parts of) state-owned monopolies, infrastructure sharing, open and cost-based access
to wholesale facilities and a liberal spectrum policy (Marino Garcia and Kelly, 2015); they can
require that telecommunications companies cover underserved areas in order to win contracts
(e.g. Rosston and Wallsten, 2020); or they can provide subsidies to companies.
One important regulatory area related to the telecommunications sector in developing countries
is over-the-top (OTT) services and zero-rated services, where mobile web content is offered to
consumers by mobile internet service providers without counting against their data allowance
(Hoskins, 2019). These services are very important for low-income consumers to access the
internet, but they can result in loss of revenues for telecommunications providers, which can in
turn lead to reduced investment in fibre-based infrastructure and new mobile access technologies.
Therefore, there is an important question about whether, and to what extent, these services
should be regulated. Regulation is very challenging given that most of the main OTT players -
for example, Facebook, WhatsApp and Skype - are multinational companies without a presence
in developing countries (Dairo and Szűcs, 2021).
Taxation in the telecommunications sector is a balancing act: taxes on consumers or providers
create revenue – and may be justified to subsidise the cost of providing public infrastructure
related to the internet – but can also hamper adoption, given that affordability is a key barrier
to access and substantive use. Taxes can be applied to: telecommunication bills; handsets or
other telecommunication devices; the spectrum; social media (ITU, 2013); or to mobile financial
services (Ndung’u, 2019)4 , all of which may affect internet access and use.
2.4.2 Provision of digital skills education
Related to a long-standing debate in economics about whether education can be considered a
public good (e.g. Hüfner, 2003), a case can be made that governments should be involved in
ensuring that the general population attains a certain level of digital skills. One rationale could
be that network effects are very important for take-up of the internet: people may be more likely
to use the internet if their peers do (see Goolsbee and Klenow, 2002), which requires that their
peers have some level of digital skills. If using the internet has important development impacts,
4
Some countries have imposed taxes on social media use ostensibly to manage risk of harm, such as misinformation
campaigns. This can be problematic since social media may be an important entry-point to the internet for
many consumers.
11there may also be externalities to its take-up and use, which the market undervalues.
3 Measurement of digital inclusion
3.1 Why standardised and sophisticated measures of digital inclusion are
important
Contrary to arguments in Hilbert (2011b) and Galperin (2010) that digital inclusion is so complex
as to make standardised measurement unworkable, it is very important that we can measure
digital inclusion consistently and in a way such that we are able to disaggregate the data. Of
course there is a trade-off between complexity and standardisability: it may be difficult to
capture all possible aspects of digital inclusion related to the internet in a set of measures that
can be widely applied to developing countries, but this paper aims to put forward some ideas
for improving the measurement of core facets of digital inclusion. There are several reasons why
this is important, including goal-setting, policy design and evaluation.
Currently some of the most important development indicators regarding digital inclusion for
development leave much to be desired. For example, the importance of the internet (and ICTs
in general) is considered in Sustainable Development Goal (SDG) Target 9.c, where the interna-
tional community commits to ‘significantly increase access to information and communications
technology and strive to provide universal and affordable access to the Internet in least developed
countries by 2020’.
The official indicator selected to track SDG Target 9.c is the ‘proportion of population covered
by a mobile network, by technology’. The indicator, which is defined as ‘the percentage of
inhabitants living within range of a mobile-cellular signal, irrespective of whether or not they
are mobile phone subscribers or users’ (ITU, 2015) measures the possibility of subscribing to
and using mobile cellular services. By including the breakdown ‘by technology’, the indicator
is flexible in terms of internet quality, so basic narrowband (2G) mobile networks are treated
the same as emerging 5G networks. Moreover, this UN indicator does not seem to consider
whether people are actually able to access the internet, whether it is high quality, whether it
is affordable or whether they have the skills to use it. Of course, it was important for the UN
to balance relevance with feasibility (Hilbert, 2016), but an indicator for the internet based
only on a mobile-cellular signal is setting a low bar, and does not push governments towards
12meaningful digital inclusion. Likewise, standalone indicators that only reference the number
of internet subscriptions are increasingly obsolete due to technology diffusion and technological
progress (ibid.). Surprisingly, the World Bank has invested in measuring access to mobile money
allowing for breakdowns by demographic group (with its Global Findex Survey) but it has not
yet developed a global survey with standardised questions on internet access and use, which is
arguably more fundamental.
Inaccurate measures or the absence of data can lead to misguided public policy including un-
derinvestment in important infrastructure or poorly designed regulations or public-private part-
nerships (Aker and Mbiti, 2010). Too often, governments assess their actions and policies us-
ing systematically biased information because they lack data about people from disadvantaged
groups, including the poor, elderly, rurally located, and – particularly in developing countries –
women (ibid.). Only having information on internet access but not quality, for example, can lead
to policymakers underestimating challenges related to digital inclusion. If detailed information
is not collected, then it also becomes difficult to evaluate policies designed to improve digital
inclusion. Ultimately, this limits the body of knowledge that can enhance our understanding of
digital development.
3.2 Current approaches and ways to improve measuring digital inclusion
Having made the case for why the measurement of digital inclusion needs to be improved, this
section discusses how each of the key components of digital inclusion are currently measured and
the weaknesses thereof, suggesting potential ways to improve measures as well, in some cases,
additional metrics that should be considered.
3.2.1 Measuring internet access and use
Traditionally the international digital divide is assessed in terms of telecommunication subscrip-
tions (OECD, 2001; ITU, 2015). At the international level, the most commonly cited data
source is the ITU. The ITU has for several decades collected supply-side data from administra-
tive registries of national telecommunication authorities (NTAs), trying to do so in a harmonised
manner (Hilbert, 2016). In some cases, public entities own records on persons and households; in
other cases, they have to negotiate to gain access to these data from telecommunications service
providers, which is often complicated due to the presence of legal frameworks for the protection
of personal data.
13These data are imperfect. One well-known drawback is that there is a difference between mobile
cellular subscriptions and access to and use of the internet. A subscription can be used by
more than one person in a household, and one person may have more than one subscription.
In majority prepaid markets, it is difficult to track active subscriptions since maintenance of a
prepaid subscription does not necessarily imply a payment (ITU, 2016). Since in many countries,
individuals may have multiple sim cards or internet subscriptions, the official access statistics
for these countries are well over 100%. It is also common in developing countries for people to
have multiple active sim cards, which may allow them to take advantage of special offers on
data rates and overcome connectivity problems related to uneven network coverage of operators
across these countries. Also, private data owners may use different definitions and concepts, and
it may be difficult to harmonise or adapt these for statistical production. Telecommunications
authorities collect national aggregate data on telephone subscriptions, devices and connections,
but data by individual attributes are not usually collected (Hafkin and Huyer, 2007).
In general, systematic and regularly available quantitative data on disaggregated ICT use
have remained relatively limited (Broadband Commission for Sustainable Development, 2013;
Fatehkia et al., 2018). However, in recent times, modules on ICT access and use have been added
to general household surveys in developing countries. Population censuses may also provide in-
formation: many in developing countries ask basic questions related to the household availability
of the internet or mobile phones. Of course, it might be useful to measure digital inclusion at
the individual level since there may be considerable inequalities households. For the purpose of
cross-country comparisons, it is important that measures are defined and questions are asked
in a consistent way across countries, but this is often not the case. Researchers thus often turn
to nationally representative multi-country surveys that collect basic information on internet ac-
cess in developing countries including the Demographic and Health Surveys and Afrobarometer.
Many countries – mostly high-income – have also adopted standalone ICT surveys sometimes
at the individual level. When such data are available, inconsistencies across data sources and
measures make cross-national comparisons impossible (Fatehkia et al., 2018). However, some
research institutions – e.g. Research ICT Africa – have conducted standardised surveys across
a number of developing countries.
ITU presents statistics on individuals ‘using the internet (in the last three months)’ where the
data sources are listed as various statistical offices, NTAs or ‘estimated’. In recent years it has
14also started providing statistics broken down by gender, for young people (15-24 years) and by
urban and rural areas (e.g. ITU, 2021). The ITU seems to rely heavily on national statistics
offices filling out a detailed annual questionnaire requesting information on access rates, which
they could have collected either from surveys or from NTAs or telecommunications providers
(ITU, 2020a, p. 23). One obvious problem here is that national statistics offices will often not
have information at hand which corresponds with the highly specific questions on the survey
form. For example, even in the best case scenario where they have a nationally representative
annual household survey that asks detailed questions related to internet access (which is ex-
tremely rare), they may not have information on ‘the proportion of individuals, [by sex, by age
group and urban/rural location] who have used the internet from any location in the last three
months’ (for example, they may only have information at the household level on internet access
at the home for a different time period). The ITU also notes that it may draw on multi-country
surveys - including UNICEF’s Multiple Indicator Cluster Surveys, the Demographic and Health
Surveys (DHS), and the surveys of Research ICT Africa and LIRNEAsia - for its access statistics
(ITU, 2021). For many countries, no data on access are available, and so statistics have to be
imputed. There is limited information on the imputation models that ITU uses, although a
country’s income seems to be the main predictive variable employed (ITU, 2017b, 2021). When
disaggregated information is missing, ITU reports that it uses ‘comparable economies for which
disaggregated data are available...to estimate [data] for the country in question, filling the gap in
real data’ (see Appendix in ITU (2021)), but it does not explain how ‘comparability’ is defined.
It would be helpful if the ITU provided a detailed discussion of the challenges it faces in coming
up with harmonised access data across countries. While it may provide some guidance to
national statistics offices on how to fill out its annual questionnaire, it seems that, in practice,
it leaves many difficult harmonisation decisions to these offices. Also useful would be a detailed
description of the model it uses to predict data when these are missing.
Figure 4 compares estimates of internet access for developing countries from ITU surveys to
those from other often-cited sources of internet access data. There are substantial discrepancies
between sources. It is likely that ITU data are highly correlated with AfterAccess data because
ITU will have drawn on the latter source for many of the countries where data are available
in both sources. However, though ITU also states that it sometimes draws on DHS data, the
correlation between ITU and DHS access data is quite low. In general, it appears that the
15Figure 4: Comparing internet access statistics for developing countries across different data
sources
Data from International Telecommunications Union (ITU) (2016-2018), AfterAccess (2017-2018), Afrobarometer
(2016-2018), Demographic and Health Surveys (DHS) (2015-2019) and GSMA (2019). Graphs indicate country
income group classifications from World Bank and whether ITU data are ‘from statistics offices’ or ‘estimated’
(through cross-country imputations - see ITU (2017b). ITU reportedly measures the total population accessing
the internet during the previous three months. AfterAccess Surveys measure the population aged 15-65 who have
ever accessed the internet. Afrobarometer measures the voting age population (18 years and older) who have ever
accessed the internet. DHS measures the population aged 15-49 who have ever accessed the internet. GSMA mea-
sures the population over 18 years who have accessed mobile internet in the last three months. To ensure maximum
comparability between ITU (available for most countries for most years) and other data sources (where only one
data point is available per country, but it may have taken several years to collect data across all countries in the
sample) the following steps are taken: when comparing to AfterAccess data, 2018 ITU data are used if available
and otherwise 2017 or 2016 data; when comparing to Afrobarometer data, 2017 ITU data are used or otherwise
2018 or 2016 data; when comparing to DHS data, 2017 ITU data are used and otherwise 2018 or 2016 data; when
comparing to GSMA data, 2019 ITU data are used and otherwise 2018, 2017 or 2016 data. DHS and GSMA data
are presented separately by gender so the average access rates across genders was calculated to compare with ITU
data. Correlation parameters with 95% confidence intervals reported in brackets. Countries available for After-
Access: ARG-Argentina, BGD-Bangladesh, KHM-Cambodia, COL-Colombia, GHA-Ghana, GTM-Guatemala,
IND-India, KEN-Kenya, LSO-Lesotho, MOZ-Mozambique, NGA-Nigeria, PAK-Pakistan, PRY-Paraguay, PER-
Peru, RWA-Rwanda, SEN-Senegal, ZAF-South Africa, TZA-Tanzania, UGA-Uganda. Countries available for
Afrobarometer: BEN-Benin, BWA-Botswana, BFA-Burkina Faso, CPV-Cabo Verde, CMR-Cameroon, CIV-Côte
d’Ivoire, SWZ-Eswatini, GAB-Gabon, GMB-Gambia, GHA-Ghana, GIN-Guinea, KEN-Kenya, LSO-Lesotho,
LBR-Liberia, MDG-Madagascar, MWI-Malawi, MLI-Mali, MAR-Morocco, MOZ-Mozambique, NAM-Namibia,
NER-Niger, NGA-Nigeria, SEN-Senegal, SLE-Sierra Leone, ZAF-South Africa, SDN-Sudan, STP-São Tomé and
Príncipe, TZA-Tanzania, TGO-Togo, TUN-Tunisia, UGA-Uganda, ZMB-Zambia, ZWE-Zimbabwe. Countries
available for DHS: AGO-Angola, BEN-Benin, BDI-Burundi, CMR-Cameroon, ETH-Ethiopia, GMB-Gambia,
GIN-Guinea, HTI-Haiti, JOR-Jordan, LBN-Lebanon, MWI-Malawi, MDV-Maldives, MLI-Mali, NPL- Nepal,
NGA-Nigeria, PAK-Pakistan, PNG-Papua New Guinea, SEN-Senegal, SLE-Sierra Leone, TZA-Tanzania, TLS-
Timor-Leste, UGA-Uganda, ZAF-South Africa, ZMB-Zambia, ZWE-Zimbabwe. Countries available for GSMA:
DZA-Algeria, BGD-Bangladesh, BRA-Brazil, GTM-Guatemala, IND-India, IDN-Indonesia, KEN-Kenya, MEX-
Mexico, MOZ-Mozambique, MMR-Myanmar, NGA-Nigeria, PAK-Pakistan, SEN-Senegal, ZAF-South Africa,
UGA-Uganda.
16Figure 5: Gaps in access statistics for developing countries from various sources
(a) Gaps in access statistics from Afrobarometer and ITU data
(b) Gaps in access statistics from DHS and ITU data
Data sources as in Figure 4. Access gaps calculated using:
Non-ITU result − ITU result
Access gap = × 100.
ITU result
17variation between data sources is larger the lower the country’s income level.
Figure 5 depicts ‘access gaps’ between Afrobarometer and ITU sources and between DHS and
ITU sources, showing that ITU estimates are generally lower than those from these other sources
and that the gaps are indeed larger for countries on the lower end of the income spectrum. It
is not obvious why these huge discrepancies exist between ITU data and those from other
sources. One possibility is that national statistical offices are under-reporting access rates in
their countries to the ITU. These data should be carefully validated and cross-checked before
they are presented as official statistics by the ITU.
Several organisations have begun thinking more about how to improve household survey ques-
tions related to internet access – for example, there is the OECD Model Survey on ICT Access
and Usage by Households and Individuals. Core indicators are designed to monitor dimensions
in usage - that is, access to the internet, frequency and intensity of usage and the types of
activities performed (including e-commerce, e-government, online education, and so on). Sup-
plementary indicators are meant to provide more in-depth information on these phenomena,
including individuals’ satisfaction and perception of obstacles, and to extend surveying to child
online protection and to use of ICTs at school. The OECD admits that the list of questions will
need to be dynamic as technological change will affect what is important to monitor (OECD,
2015).
This is a step in the right direction. However, these questions may need to be modified for the
developing country context. For example, developing country surveys often include questions
such as ‘Do you have access to the internet in your household?’. This type of question is taken
from high-income country surveys where fixed line connections at home are very common, but
this is confusing in settings where most people connect to the internet via a mobile phone. It is
not clear, for example, how this question should be answered if say the head of the household
has a mobile phone, which other family members cannot access. Furthermore, in low-income
countries, many users may access the internet through public and shared access facilities, such
as internet cafes, community centres or ICT-equipped libraries; this is not captured in survey
questionnaires that only ask about internet access in the household. Of course, though it would
be useful to include questions on use of public facilities, it should be acknowledged that owning
an internet-enabled device comes with considerably more benefits than using a public device
or someone else’s device. For example, owning a mobile phone may be associated with greater
18convenience, privacy and security for the user, and may allow for certain uses, for example,
access to microfinance or a bank account (GSMA, 2015; ITU, 2016).
3.2.2 Measuring quality of access/use
It would be very valuable to have more information on technical internet quality in developing
countries, particularly since there is such wide variation and often internet speeds are inade-
quate for many types of uses. This would also help to focus attention of policymakers: policies
in developing countries need to focus on quality assurance in addition to their conventional focus
on proliferating internet access. Sometimes information on technical internet quality is available
from regulators, usually just at the national level. Regulators collect information on the ad-
vertised download speed of subscriptions which can be compiled into indicators of subscriptions
broken down by speed tiers to give a view of the ‘theoretical’ speed of subscriptions. However,
measurement of broadband performance is affected by the potential gap between advertised and
‘actual’ speeds delivered to customers (OECD, 2019).
Very few surveys with questions about internet use in developing countries include questions on
the quality of the internet connection. The Centro Regional de Estudos para o Desenvolvimento
da Sociedade da Informação (CETIC) survey in Brazil collects information on this, asking re-
spondents what speed bracket their home internet connection falls into (see Figure 3). However,
it is not clear how respondents know the average speed of the internet connection in megabytes
per second, short of doing a speed test on their internet-enabled devices during the interview.
Questions could also be asked about data caps, as this is a major constraint to internet usage
in developing countries. Testing internet quality is one area where there is a clear case for the
use of big data (see subsubsection 3.3.2).
It would also be useful to have more information on how people are using the internet. Aside
from basic survey questions about whether a person has access to the internet, a fundamental
follow-up question, which is rarely asked, is how the person has accessed the internet. In the
detailed Brazilian survey undertaken by CETIC, there is a question about having a computer
at home (where ‘computer’ could include a desktop computer, a notebook or a tablet). As
shown in Figure 6, the proportion of people accessing the internet exclusively via mobile phones
rose steeply from 20% in 2015 to 40% in 2019; however, the share accessing the internet via
both mobile phones and computers stayed constant over this period and the share accessing the
19internet via computers exclusively decreased slightly. One interesting possibility is that, faced
with budget constraints, Brazilians are substituting away from computer devices to smartphone
devices. This may have substantial policy implications since as shown in Table 1, even after
controlling for a multitude of individual attributes that could influence the likelihood of owning
devices, respondents who access the internet with a computer or with both a computer and
mobile phone are 10 to 20 percentage points more likely to use the internet for education or
work purposes than those who only access the internet via a mobile phone. Unfortunately, the
CETIC survey does not ask questions to differentiate between types of mobile phones that people
own, but GSMA (2020c) estimated a smartphone penetration rate of 69% for Brazil in 2019, so
it is safe to assume that most people who accessed the internet on a mobile phone did so on a
smartphone (rather than on a feature phone, which may support basic internet access).
The recommendation of the Alliance for Affordable Internet to measure ‘meaningful connectiv-
ity’ separately from basic internet access seems to be a sensible one (see subsubsection 2.3.2).
Helpfully, it has developed a draft measurement guide (Alliance for Affordable Internet, 2021a),
which suggests four indicators for the four dimensions of ‘meaningful connectivity’ which it says
should be added to ICT household surveys, and to the ITU’s official manual for completing these
(ITU, 2020a). Based on the analysis above, it might be useful to rethink whether smartphone
access to the internet should always be held up as the standard to aspire to above all other means
of access including that from computers or tablets. The analysis also suggested that it would be
helpful to develop detailed guidelines for how survey administrators can record internet quality.
20Figure 6: Means of accessing the internet in Brazil
Data from CETIC 2015-2019. ‘Computers’ include desktop computers, notebooks and
tablets.
Table 1: Probability of using the internet for ‘empowerment’-related purposes depending on
type of device used to access in Brazil
Uses of the internet
School research Distance learning Own learning Work activities
Only computer/ 0.177*** 0.104*** 0.196*** 0.181***
both computer and mobile (9.04) (7.88) (9.57) (9.44)
Individual controls Y Y Y Y
Observations 12,179 12,179 12,180 12,177
Analysis at individual level using CETIC 2019 data. Conditional on having access to the internet
in the household. ‘Computers’ include desktop computers, notebooks and tablets. Base category for
dummy: Access internet via mobile only. Significance levels: *pbe compared across countries. Again, the most widely cited source is the ITU, which monitors
prices from ITU member states, the results of which are disseminated in the World Telecommu-
nication/ICT Indicators Database and the ITU’s Yearbook of Statistics. Until now, the focus
has been on the costs of different types of internet service (that is, the data prices of fixed
and mobile connections) on personal devices rather than the cost of acquiring a device to use
the internet. Data on mobile broadband prices are collected by ITU directly from operators’
websites (the prices are collected for the largest mobile operator), while fixed-broadband price
data are collected through the ITU ICT Price Basket Questionnaire sent to the administrations
and statistical contacts of all 193 ITU member states. The mobile cellular basket is based on
the most common contract modality (prepaid or postpaid) in the economy in question - that is,
if more than 50% of subscriptions are prepaid, then prepaid is selected - otherwise, a postpaid
plan is selected (ITU, 2020a).
The affordability of a standard basket of internet usage is measured by relating domestic basket
prices to the monthly per capita gross national income and benchmarking against a set target,
offering a high-level indicator of affordability for the average earner. The Broadband Commission
for Sustainable Development’s target for 2025 is for entry-level broadband services to be made
affordable in developing countries at a level corresponding to less than 2% of monthly Gross
National Income (GNI) per capita. The baskets are designed to provide a snapshot of prices at
any given time rather than as a series. As such, the lowest cost plan is selected at any point in
time and may have different characteristics from earlier plans - for example, a higher speed or
an increased amount of data (OECD, 2019).
The ITU has made some recent progress in improving the sophistication of its affordability
measures. One issue with looking at affordability through the metric of proportion of per capita
income is that it does not distinguish between the effects of tariffs and incomes. In recent years,
the ITU has also begun to provide relevant tariff information for countries (ITU, 2018b). This
is a good move to target government action. Another issue that the ITU has paid attention to
is that even where a basket appears to be affordable for the average citizen, a significant share
of the population may find the price to be beyond their means due to income and consumption
inequality. Helpfully, ITU (2020b) examines affordability for the poorest 40% of the population
in the countries where data are available.
There may still be room for other methodological improvements. For example, the ITU’s explicit
22methodology - if mobile cellular or broadband prices vary between different regions of the country
- is to take prices that apply to those in the largest city (in terms of population) or in the
capital city (ITU, 2020a). However, only reporting this information creates perverse incentives
for governments to ignore prices in under-served regions. An effort should be made to collect
information on prices in more remote parts of countries, which could then be used in a new
measure summarising how large the price differential is between the cheapest and most expensive
region.
It is also worth pointing out that data packages of the same minimum size may be of very different
quality across countries. Figure 7 shows the massive variation in average speed of a 5MB fixed
broadband internet bundle across different country income categories based on ITU’s data. It
may be useful to consider minimum connection speeds in this context, presenting another sets
of prices that take this into account.
The ITU relies on GNI, presumably because there is good standardised data on this but, ar-
guably, household income may be the more relevant measure. GNI is an aggregate measure
used to measure economic development by the size of the economy in the context of national
accounts, and including the business sector (ITU, 2020a). Household income collected through
household surveys excludes the business sector and measures all income received by members
of a household less taxes and social security contributions. In developing countries, household
consumption expenditure may also be used. Either household income or expenditure can then
be compared to expenditure on the internet. There is huge variation in questions on expenditure
on the internet in developing country surveys, which creates confusion and makes it difficult to
examine disaggregated measures of internet affordability. Frequently the questions are extremely
vague, for example: ‘How much did you spend on the internet in the last 30 days?’ or ‘What
was the amount of the internet bill last month?’. It is unclear if these questions refer specifically
to a fixed line internet connection or if they also may refer to costs for internet accessed on a
mobile device. It seems that the best approach would be to ask questions that explicitly break
down internet expenses; for example: ‘How much did you spend on mobile internet last month?’;
‘How much did you spend on fixed line internet at home in the last month?’; and ‘How much
did you spend at internet cafes in the last month?’.
It is also important to consider the cost of internet-enabled devices in addition to the cost of using
these devices. An internet-enabled device is a prerequisite for using the service. While the price
23Figure 7: Variation in speed of cheapest 5MB fixed broadband internet bundle for countries of
different income levels
(a) Average speed of 5MB fixed broadband (b) Average speed of 5MB fixed broadband inter-
internet bundle for countries in different in- net bundle with logged speed and log price as a
come groups proportion of GNI per capita
ITU price baskets underlying indicators based on ITU and A4AI. GNI p.c. and PPP$ conversion factors from
the World Bank. USD exchange rates from the IMF or the UN. Lower income countries: AFG-Afghanistan,
BFA-Burkina Faso, ETH-Ethiopia, GIN-Guinea, GNB-Guinea-Bissau, HTI-Haiti, PRK-Korea, Dem. Peo-
ple’s Rep., MDG-Madagascar, MWI-Malawi, MLI-Mali, MOZ-Mozambique, NER-Niger, RWA-Rwanda, SOM-
Somalia, TGO-Togo, YEM-Yemen, Rep. Lower-middle income countries: DZA-Algeria, AGO-Angola, BGD-
Bangladesh, BEN-Benin, BTN-Bhutan, BOL-Bolivia, CPV-Cabo Verde, KHM-Cambodia, CMR-Cameroon,
COM-Comoros, COG-Congo, Rep., CIV-Côte d’Ivoire, DJI-Djibouti, EGY-Egypt, Arab Rep., SLV-El Salvador,
SWZ-Eswatini, GHA-Ghana, HND-Honduras, IND-India, KEN-Kenya, LAO-Lao PDR, LSO-Lesotho, MRT-
Mauritania, FSM-Micronesia, MNG-Mongolia, MAR-Morocco, MMR-Myanmar, NPL-Nepal, NIC-Nicaragua,
NGA-Nigeria, PAK-Pakistan, PNG-Papua New Guinea, PHL-Philippines, SEN-Senegal, SLB-Solomon Islands,
LKA-Sri Lanka, STP-São Tomé and Principe, TZA-Tanzania, TLS-Timor-Leste, TUN-Tunisia, VUT-Vanuatu,
VNM-Vietnam, ZMB-Zambia, ZWE-Zimbabwe. Upper-middle income countries: ARG-Argentina, BLZ-Belize,
BWA-Botswana, BRA-Brazil, CHN-China, COL-Colombia, CRI-Costa Rica, CUB-Cuba, DMA-Dominica, DOM-
Dominican Republic, ECU-Ecuador, GNQ-Equatorial Guinea, FJI-Fiji, GAB-Gabon, GRD-Grenada, GTM-
Guatemala, GUY-Guyana, IDN-Indonesia, IRN-Iran, JAM-Jamaica, JOR-Jordan, LBN-Lebanon, LBY-Libya,
MYS-Malaysia, MDV-Maldives, MHL-Marshall Islands, MEX-Mexico, NAM-Namibia, PRY-Paraguay, PER-
Peru, WSM-Samoa, ZAF-South Africa, LCA-St. Lucia, VCT-St. Vincent and the Grenadines, SUR-Suriname,
THA-Thailand, TON-Tonga.
24You can also read